 An official website of the United States government
 Field of degree: Minorities
The share of science and engineering (S&E) degrees awarded to underrepresented minorities—Hispanics or Latinos, Blacks or African Americans, and American Indians or Alaska Natives—has increased over the past decade. Minority-serving institutions—historically Black colleges or universities (HBCUs) and high-Hispanic-enrollment institutions (HHEs)—have played an important role in awarding bachelor’s degrees to students who later earn doctorates in S&E fields, helping to advance representation in these fields by minorities. Despite this progress, these groups continue to be underrepresented among S&E degree recipients relative to their representation in the overall population.
Degrees earned by underrepresented minorities
Overall
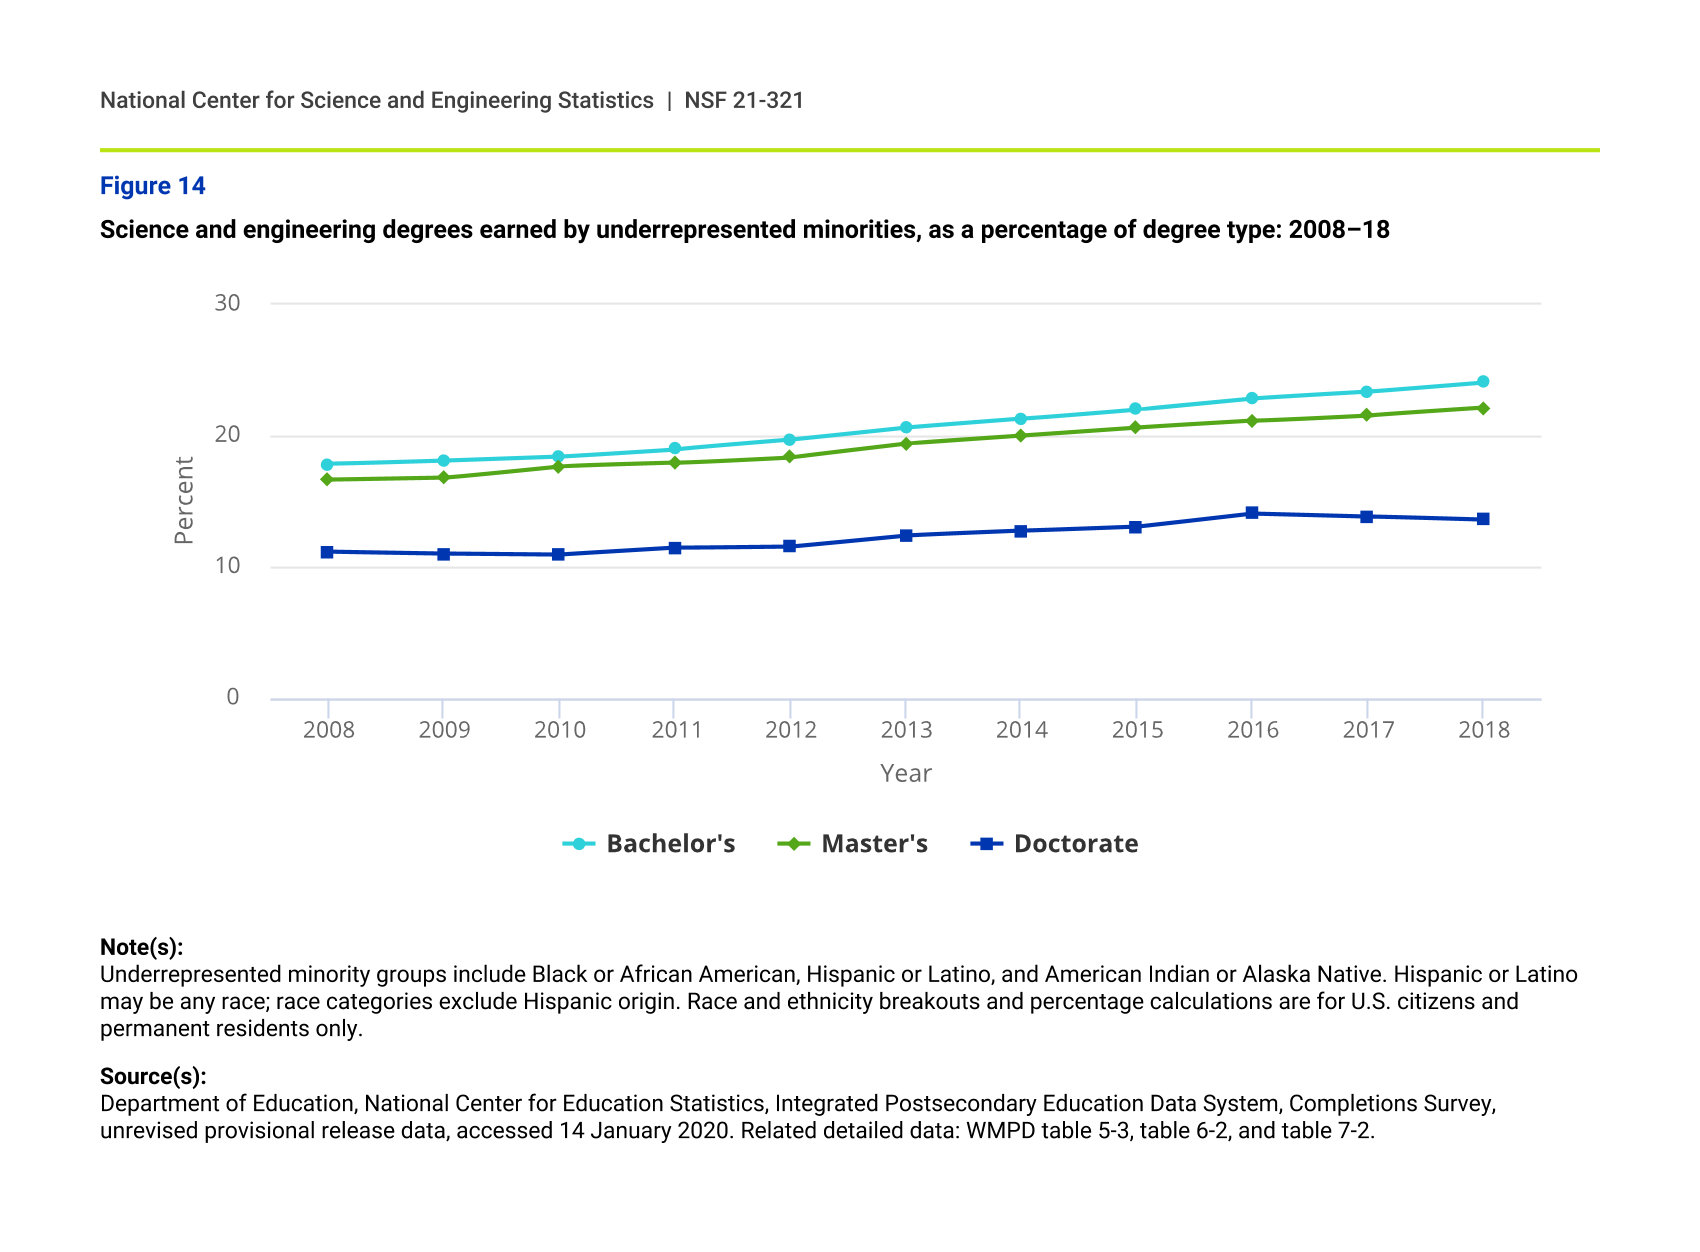
In 2018, underrepresented minority students received 24.0% of all S&E bachelor’s degrees awarded to U.S. citizens and permanent residents, 22.1% of S&E master’s degrees, and 13.6% of all S&E doctoral degrees. Underrepresented minorities have earned an increasing share of degrees at all three degree levels over the past 10 years, the only exception being a slight decline in doctorates since 2016. Even with the slight dip in the share of doctoral degrees, the number of underrepresented minority doctorate recipients increased nearly 50% over the past 10 years, from 2,247 in 2008 to 3,351 in 2018 (figure 14).
Science and engineering degrees earned by underrepresented minorities, as a percentage of degree type: 2008–18
| Year | Bachelor's | Master's | Doctorate |
|---|---|---|---|
| 2008 | 17.83 | 16.62 | 11.13 |
| 2009 | 18.10 | 16.78 | 10.99 |
| 2010 | 18.41 | 17.67 | 10.91 |
| 2011 | 18.97 | 17.91 | 11.43 |
| 2012 | 19.67 | 18.36 | 11.53 |
| 2013 | 20.60 | 19.39 | 12.38 |
| 2014 | 21.27 | 19.99 | 12.73 |
| 2015 | 22.00 | 20.60 | 13.06 |
| 2016 | 22.84 | 21.11 | 14.07 |
| 2017 | 23.34 | 21.55 | 13.84 |
| 2018 | 24.05 | 22.12 | 13.58 |
Note(s):
Underrepresented minority groups include Black or African American, Hispanic or Latino, and American Indian or Alaska Native. Hispanic or Latino may be any race; race categories exclude Hispanic origin. Race and ethnicity breakouts and percentage calculations are for U.S. citizens and permanent residents only.
Bachelor’s degrees in science and engineering
In 2018, among U.S. citizens and permanent residents, Whites earned 57.9% of bachelor’s degrees in S&E fields and Asians earned 10.7%. Hispanic and Latino graduates were awarded 15.1% of S&E bachelor’s degrees; Black or African Americans, 8.5%; and American Indian or Alaska Natives, 0.4%. All three groups of underrepresented minorities earned a larger share of bachelor’s degrees in science fields than in engineering fields in 2018 (figure 15).
Bachelor's degrees earned, by ethnicity and race: 2018
| Field | White | Asian | Black or African American | Hispanic or Latino | American Indian or Alaska Native | Native Hawaiian or Other Pacific Islander | More than one race, unknown, or other |
|---|---|---|---|---|---|---|---|
| Science | 56.63 | 10.36 | 9.34 | 15.72 | 0.45 | 0.22 | 7.28 |
| Engineering | 64.36 | 12.22 | 4.31 | 12.17 | 0.32 | 0.15 | 6.45 |
| Non-S&E | 61.54 | 5.73 | 10.62 | 14.28 | 0.48 | 0.25 | 7.09 |
S&E = science and engineering.
Note(s):
Hispanic or Latino may be any race; race categories exclude Hispanic origin. Race and ethnicity breakouts and percentage calculations are for U.S. citizens and permanent residents only.
Source(s):
Department of Education, National Center for Education Statistics, Integrated Postsecondary Education Data System, Completions Survey, 2018, unrevised provisional release data, accessed 14 January 2020. Related detailed data: WMPD table 5-3.
Hispanics or Latinos
Overall
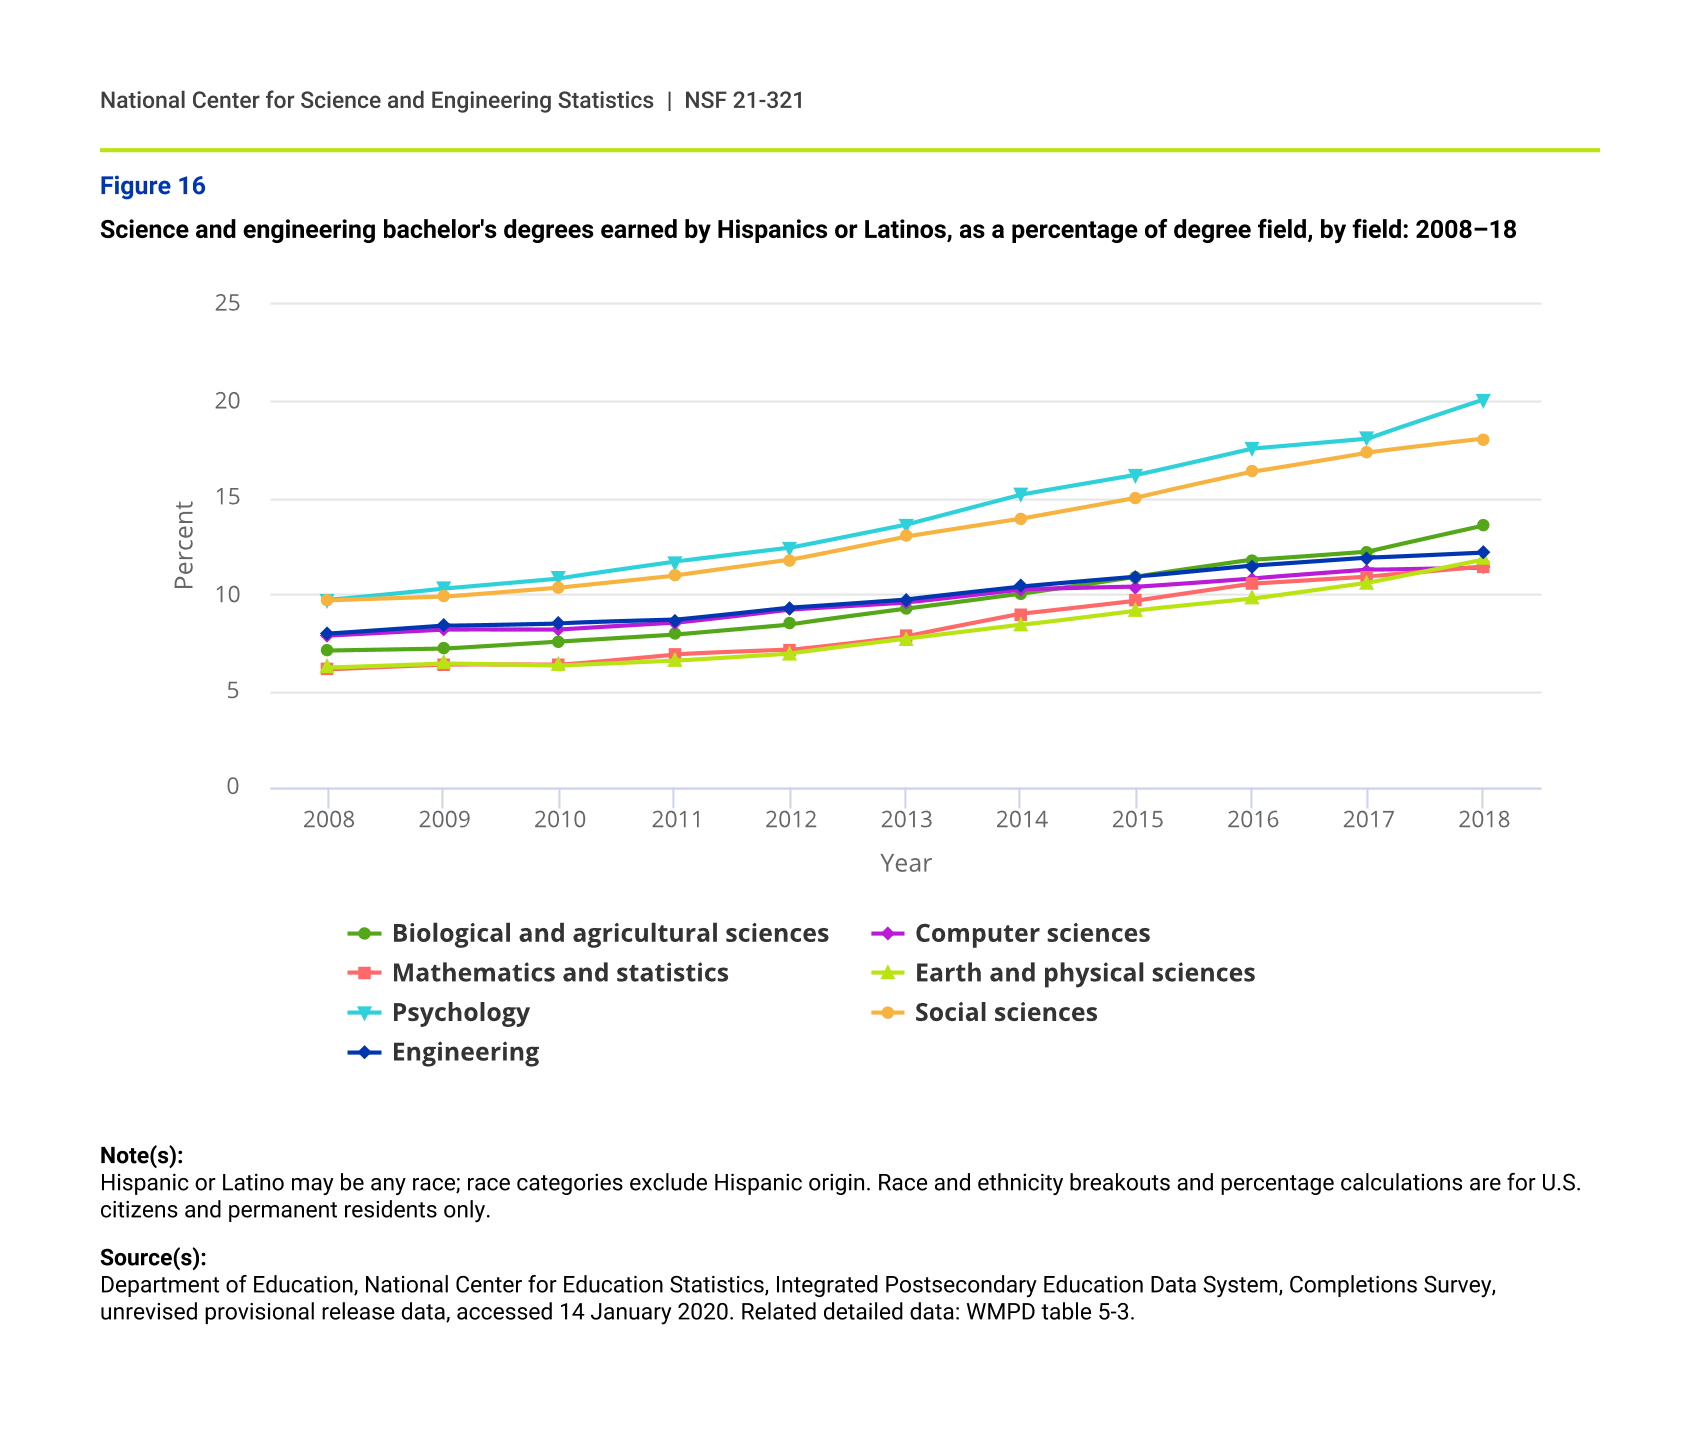
The share of S&E bachelor’s degrees awarded to Hispanics or Latinos increased over the past 10 years, from 8.5% of all S&E bachelor’s degrees awarded to U.S. citizens and permanent residents in 2008 to 15.1% in 2018. In 2018, the S&E fields with the largest Hispanic or Latino representation were psychology (20.0%), social sciences (18.0%), and biological and agricultural sciences (13.6%) (figure 16).
Science and engineering bachelor's degrees earned by Hispanics or Latinos, as a percentage of degree field, by field: 2008–18
| Year | Biological and agricultural sciences | Computer sciences | Mathematics and statistics | Earth and physical sciences | Psychology | Social sciences | Engineering |
|---|---|---|---|---|---|---|---|
| 2008 | 7.11 | 7.87 | 6.13 | 6.22 | 9.71 | 9.69 | 7.96 |
| 2009 | 7.21 | 8.18 | 6.36 | 6.43 | 10.32 | 9.87 | 8.38 |
| 2010 | 7.58 | 8.17 | 6.35 | 6.31 | 10.84 | 10.35 | 8.51 |
| 2011 | 7.94 | 8.52 | 6.91 | 6.57 | 11.68 | 10.98 | 8.67 |
| 2012 | 8.46 | 9.23 | 7.12 | 6.95 | 12.40 | 11.79 | 9.32 |
| 2013 | 9.24 | 9.59 | 7.84 | 7.69 | 13.60 | 13.01 | 9.75 |
| 2014 | 10.03 | 10.26 | 8.99 | 8.42 | 15.16 | 13.93 | 10.40 |
| 2015 | 10.93 | 10.38 | 9.68 | 9.18 | 16.18 | 15.02 | 10.90 |
| 2016 | 11.78 | 10.82 | 10.55 | 9.76 | 17.56 | 16.33 | 11.47 |
| 2017 | 12.23 | 11.26 | 10.92 | 10.60 | 18.08 | 17.34 | 11.89 |
| 2018 | 13.56 | 11.39 | 11.43 | 11.81 | 20.06 | 18.03 | 12.17 |
Note(s):
Hispanic or Latino may be any race; race categories exclude Hispanic origin. Race and ethnicity breakouts and percentage calculations are for U.S. citizens and permanent residents only.
Source(s):
Department of Education, National Center for Education Statistics, Integrated Postsecondary Education Data System, Completions Survey, unrevised provisional release data, accessed 14 January 2020. Related detailed data: WMPD table 5-3.
Baccalaureate origins of Hispanic or Latino doctorate recipients
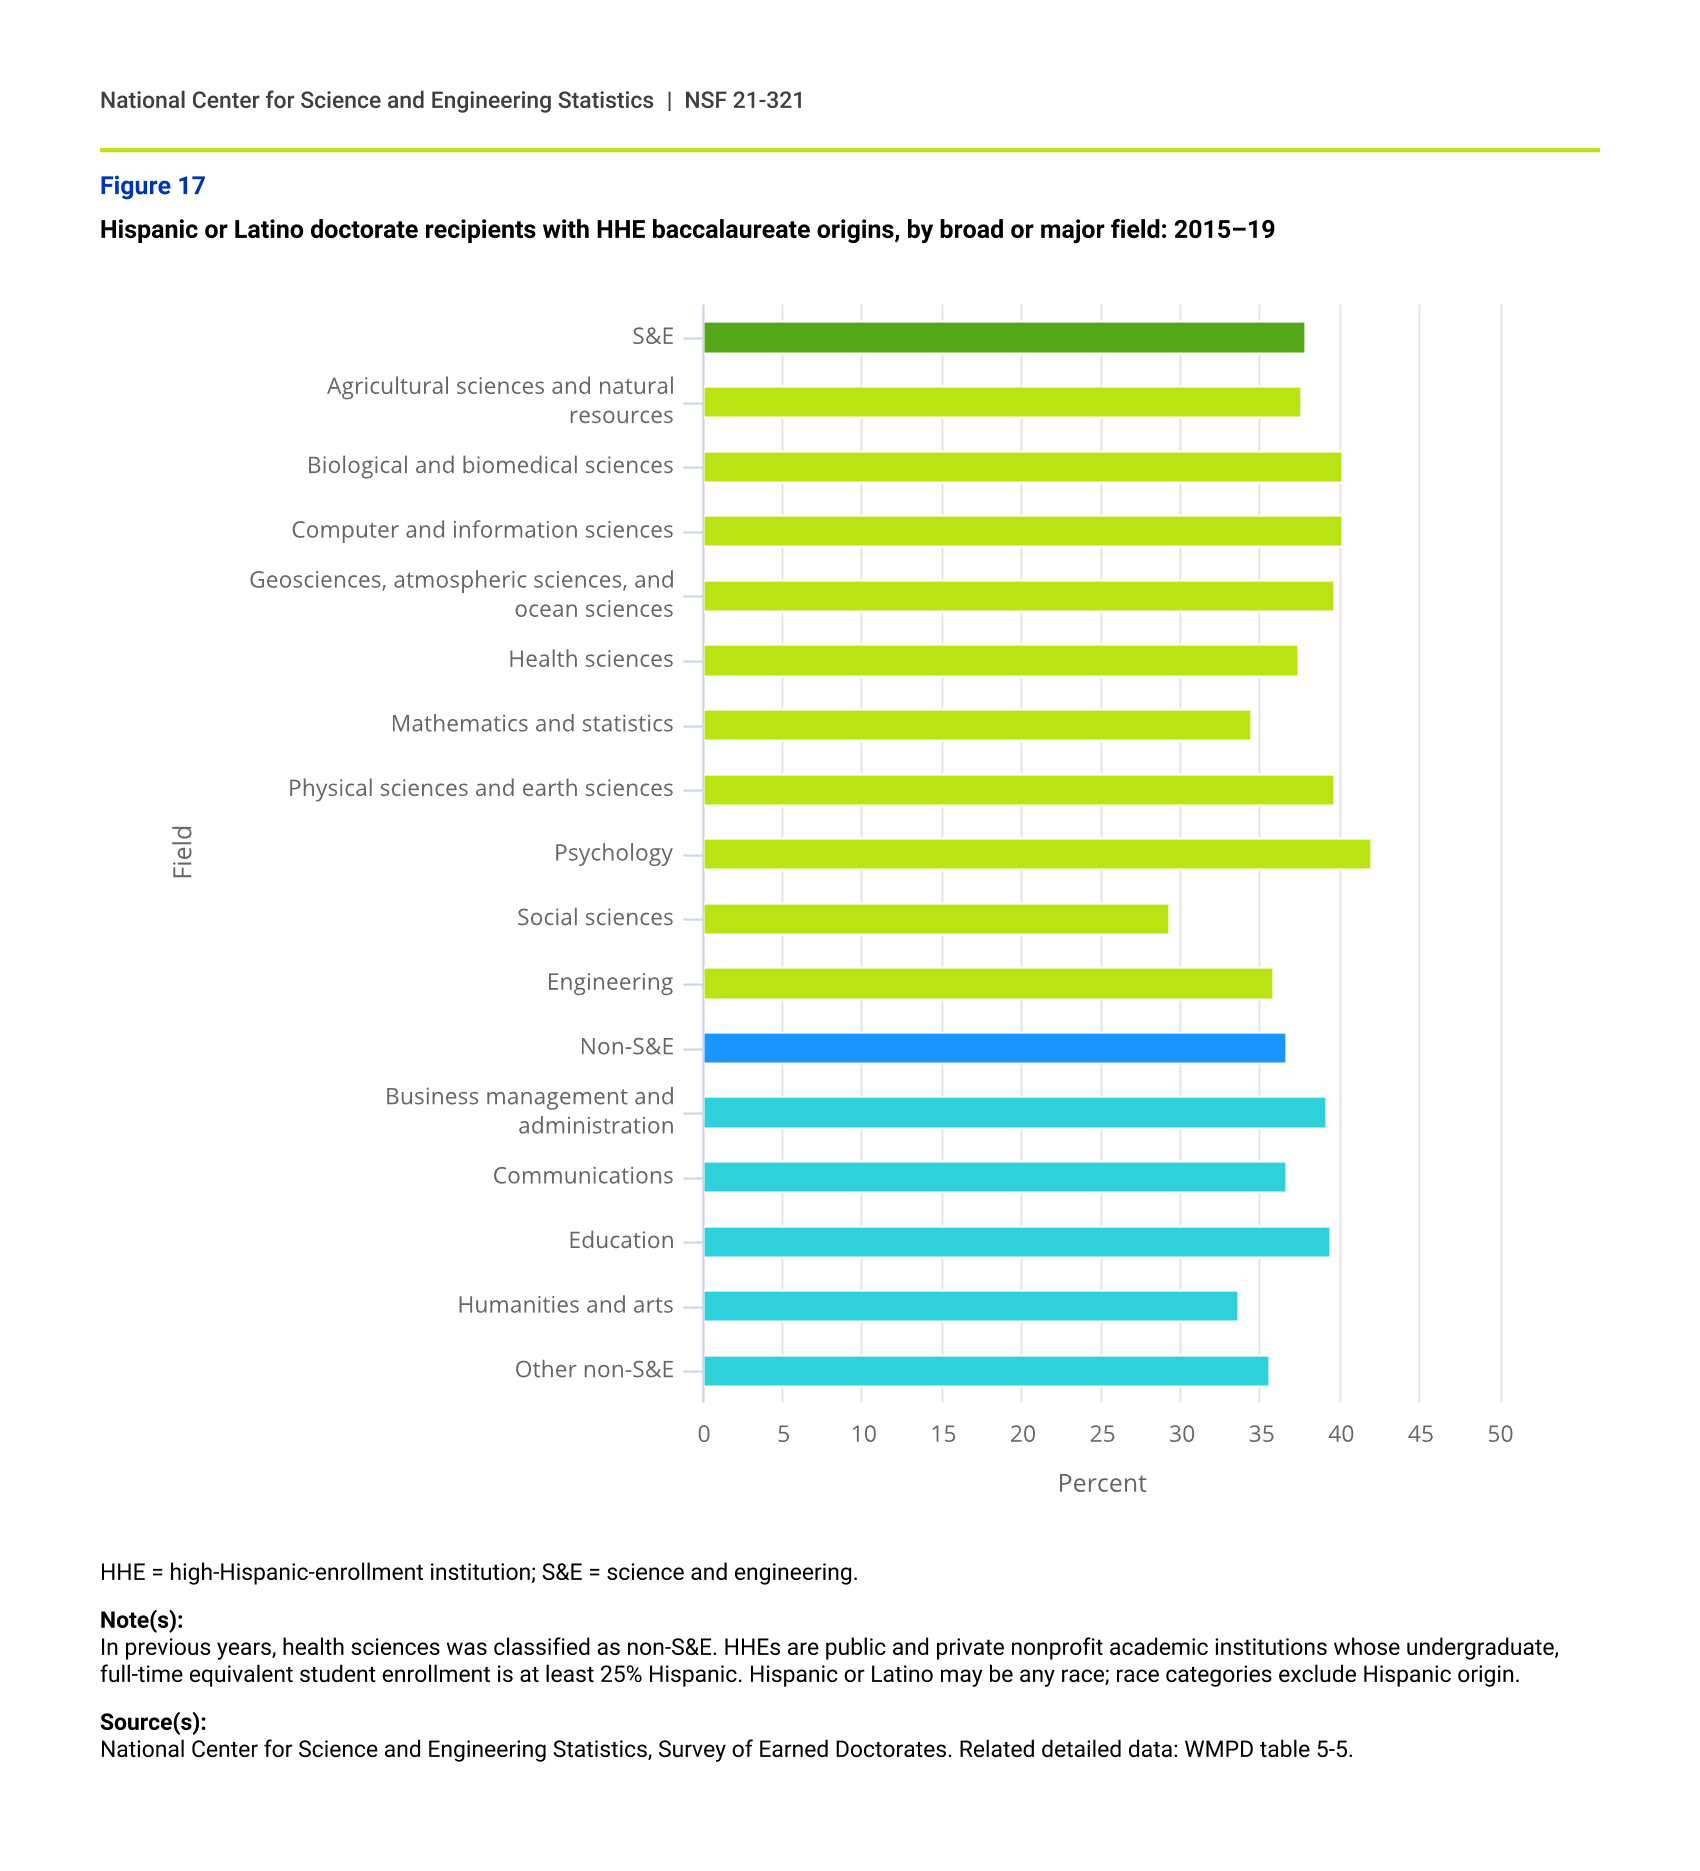
HHEs play an important role in educating Hispanic or Latino students. In 2018, 51.4% of Hispanic or Latino bachelor’s degree recipients in all fields earned their degree from HHE institutions, and the share for those in S&E fields was almost as large (49.2%). Both shares of HHE graduates were slightly higher than they were in 2016. These institutions also are important in training Hispanic students for doctoral studies—37.8% of Hispanics or Latinos who received an S&E research doctorate between 2015 and 2019 received their bachelor’s degree from an HHE institution. These institutions are the baccalaureate origins of an even larger share of Hispanic doctorate recipients in biological and biomedical sciences, computer and information sciences, physical sciences and earth sciences, and psychology (figure 17). (See appendix table A-1 for the top baccalaureate institutions of Hispanic or Latino S&E doctorate recipients.)
Hispanic or Latino doctorate recipients with HHE baccalaureate origins, by broad or major field: 2015–19
| Field | Percent |
|---|---|
| S&E | 37.81 |
| Agricultural sciences and natural resources | 37.57 |
| Biological and biomedical sciences | 40.17 |
| Computer and information sciences | 40.12 |
| Geosciences, atmospheric sciences, and ocean sciences | 39.62 |
| Health sciences | 37.48 |
| Mathematics and statistics | 34.47 |
| Physical sciences and earth sciences | 39.70 |
| Psychology | 42.06 |
| Social sciences | 29.35 |
| Engineering | 35.92 |
| Non-S&E | 36.63 |
| Business management and administration | 39.15 |
| Communications | 36.70 |
| Education | 39.34 |
| Humanities and arts | 33.62 |
| Other non-S&E | 35.59 |
HHE = high-Hispanic-enrollment institution; S&E = science and engineering.
Note(s):
In previous years, health sciences was classified as non-S&E. HHEs are public and private nonprofit academic institutions whose undergraduate, full-time equivalent student enrollment is at least 25% Hispanic. Hispanic or Latino may be any race; race categories exclude Hispanic origin.
Source(s):
National Center for Science and Engineering Statistics, Survey of Earned Doctorates. Related detailed data: WMPD table 5-5.
Blacks or African Americans
Overall
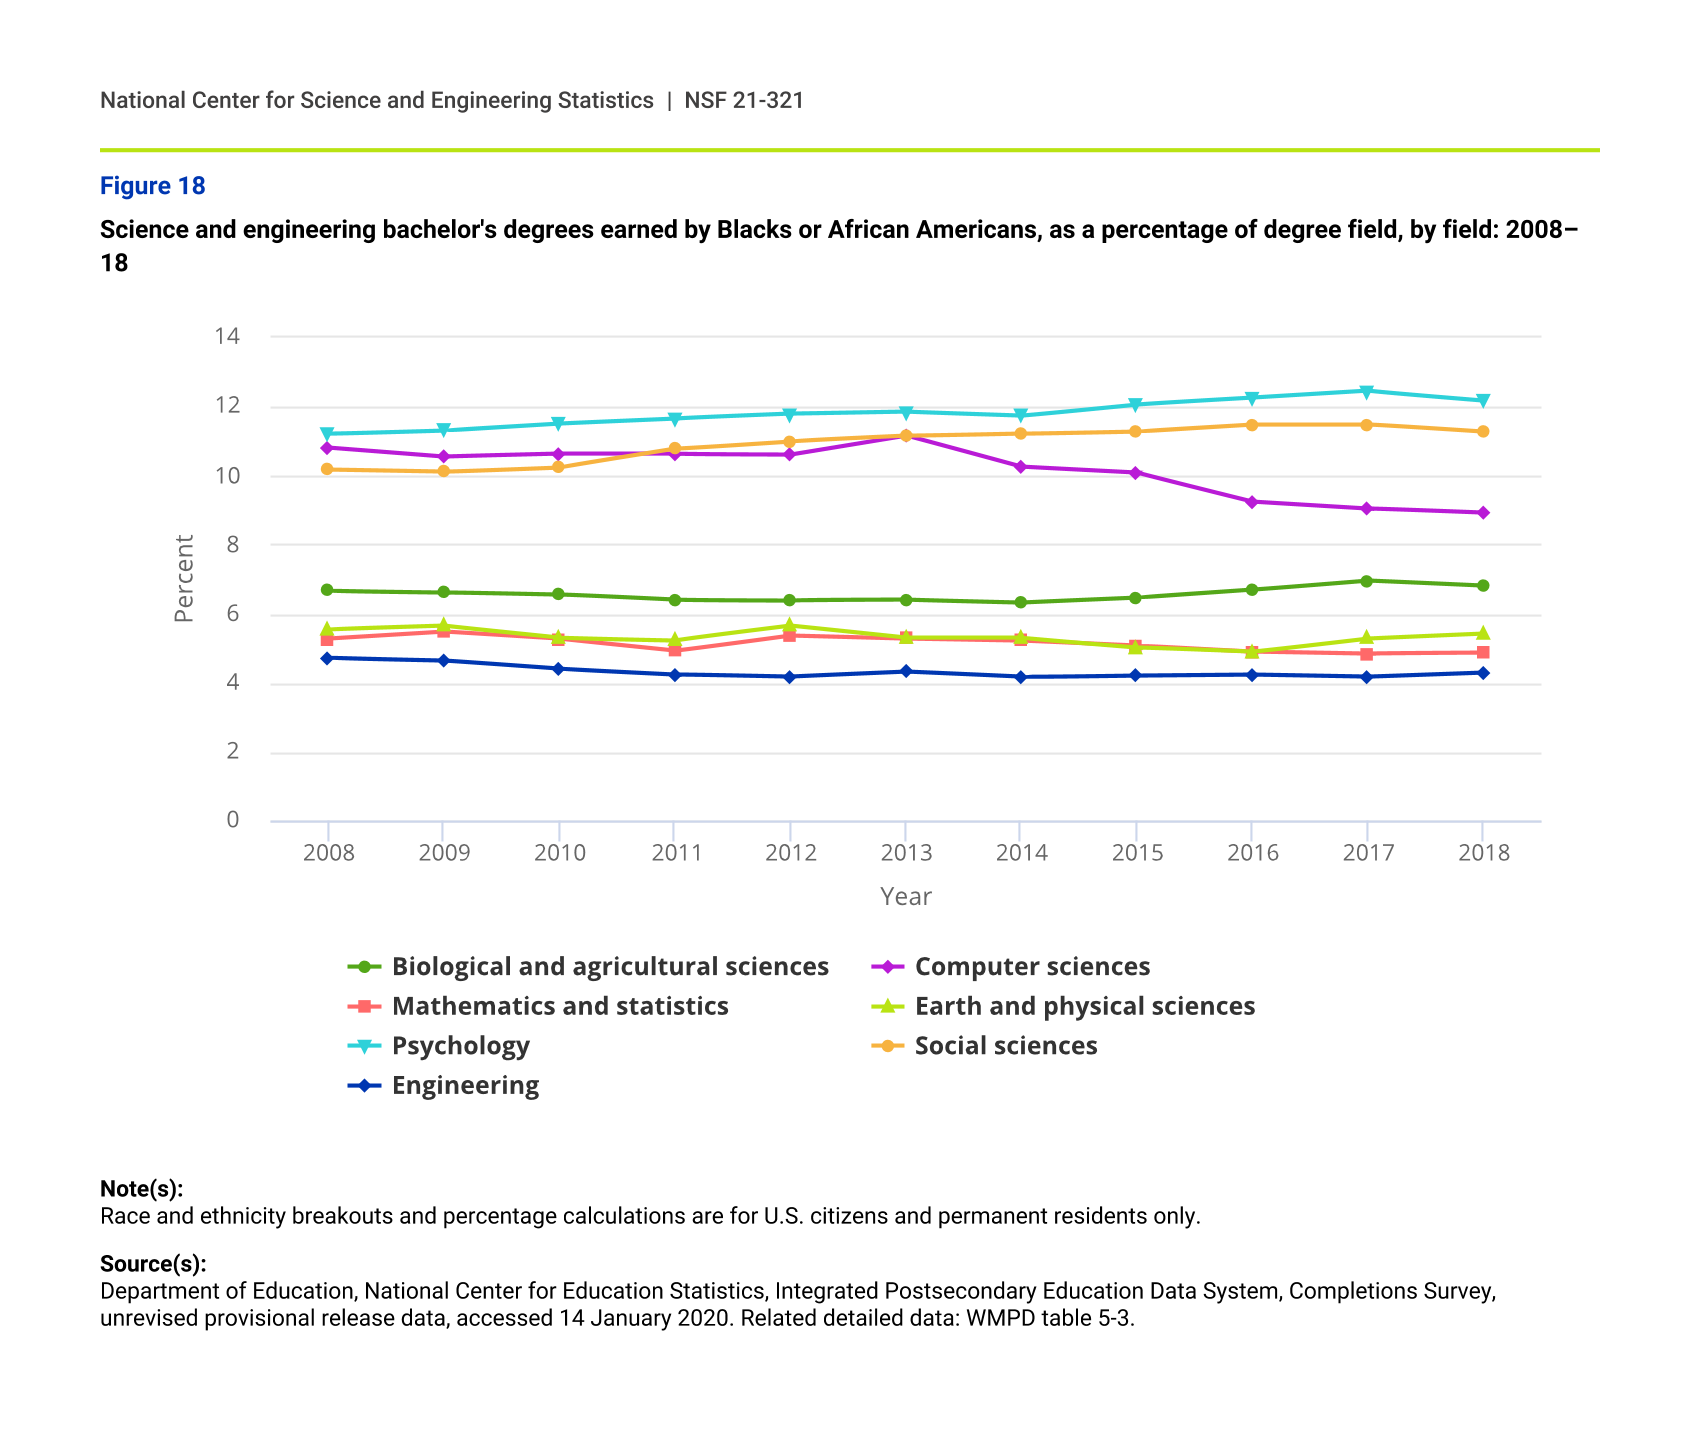
Blacks or African Americans, like Hispanics or Latinos, had larger representation in undergraduate fields of psychology (12.2% in 2018) and social sciences (11.3%) than they did in other undergraduate S&E fields. Overall, the shares of Black or African American bachelor’s degree recipients in S&E fields held fairly steady, maintaining about 8% over 2008 to 2018. However, the number of S&E bachelor's degrees awarded to Blacks or African Americans increased by 35.9% over the past 10 years, from 41,263 in 2008 to 56,084 in 2018. This increase is roughly close to the growth rate in the number of S&E bachelor’s degrees, 37.7% growth over the decade, which resulted in a similar proportion of Blacks or African Americans awarded bachelor's degrees in S&E fields over 2008 to 2018. However, representation in specific S&E fields has changed at different rates, with a relatively large decline in computer sciences and relatively little change in other S&E fields. In computer sciences, the number of Blacks or African Americans receiving bachelor’s degrees increased from 4,011 to 6,558 from 2008 to 2018, but their share declined from 10.8% to 8.9% (figure 18).
Science and engineering bachelor's degrees earned by Blacks or African Americans, as a percentage of degree field, by field: 2008–18
| Year | Biological and agricultural sciences | Computer sciences | Mathematics and statistics | Earth and physical sciences | Psychology | Social sciences | Engineering |
|---|---|---|---|---|---|---|---|
| 2008 | 6.67 | 10.81 | 5.28 | 5.55 | 11.22 | 10.18 | 4.72 |
| 2009 | 6.63 | 10.55 | 5.48 | 5.65 | 11.32 | 10.12 | 4.65 |
| 2010 | 6.56 | 10.63 | 5.27 | 5.31 | 11.52 | 10.25 | 4.41 |
| 2011 | 6.40 | 10.63 | 4.93 | 5.24 | 11.66 | 10.78 | 4.25 |
| 2012 | 6.39 | 10.62 | 5.38 | 5.65 | 11.79 | 11.00 | 4.18 |
| 2013 | 6.40 | 11.17 | 5.29 | 5.30 | 11.85 | 11.15 | 4.32 |
| 2014 | 6.32 | 10.26 | 5.23 | 5.30 | 11.74 | 11.22 | 4.17 |
| 2015 | 6.46 | 10.09 | 5.08 | 5.03 | 12.07 | 11.29 | 4.22 |
| 2016 | 6.69 | 9.26 | 4.91 | 4.90 | 12.26 | 11.49 | 4.25 |
| 2017 | 6.96 | 9.06 | 4.85 | 5.29 | 12.46 | 11.49 | 4.19 |
| 2018 | 6.81 | 8.93 | 4.87 | 5.43 | 12.19 | 11.27 | 4.31 |
Note(s):
Race and ethnicity breakouts and percentage calculations are for U.S. citizens and permanent residents only.
Source(s):
Department of Education, National Center for Education Statistics, Integrated Postsecondary Education Data System, Completions Survey, unrevised provisional release data, accessed 14 January 2020. Related detailed data: WMPD table 5-3.
Baccalaureate origins of Black or African American doctorate recipients
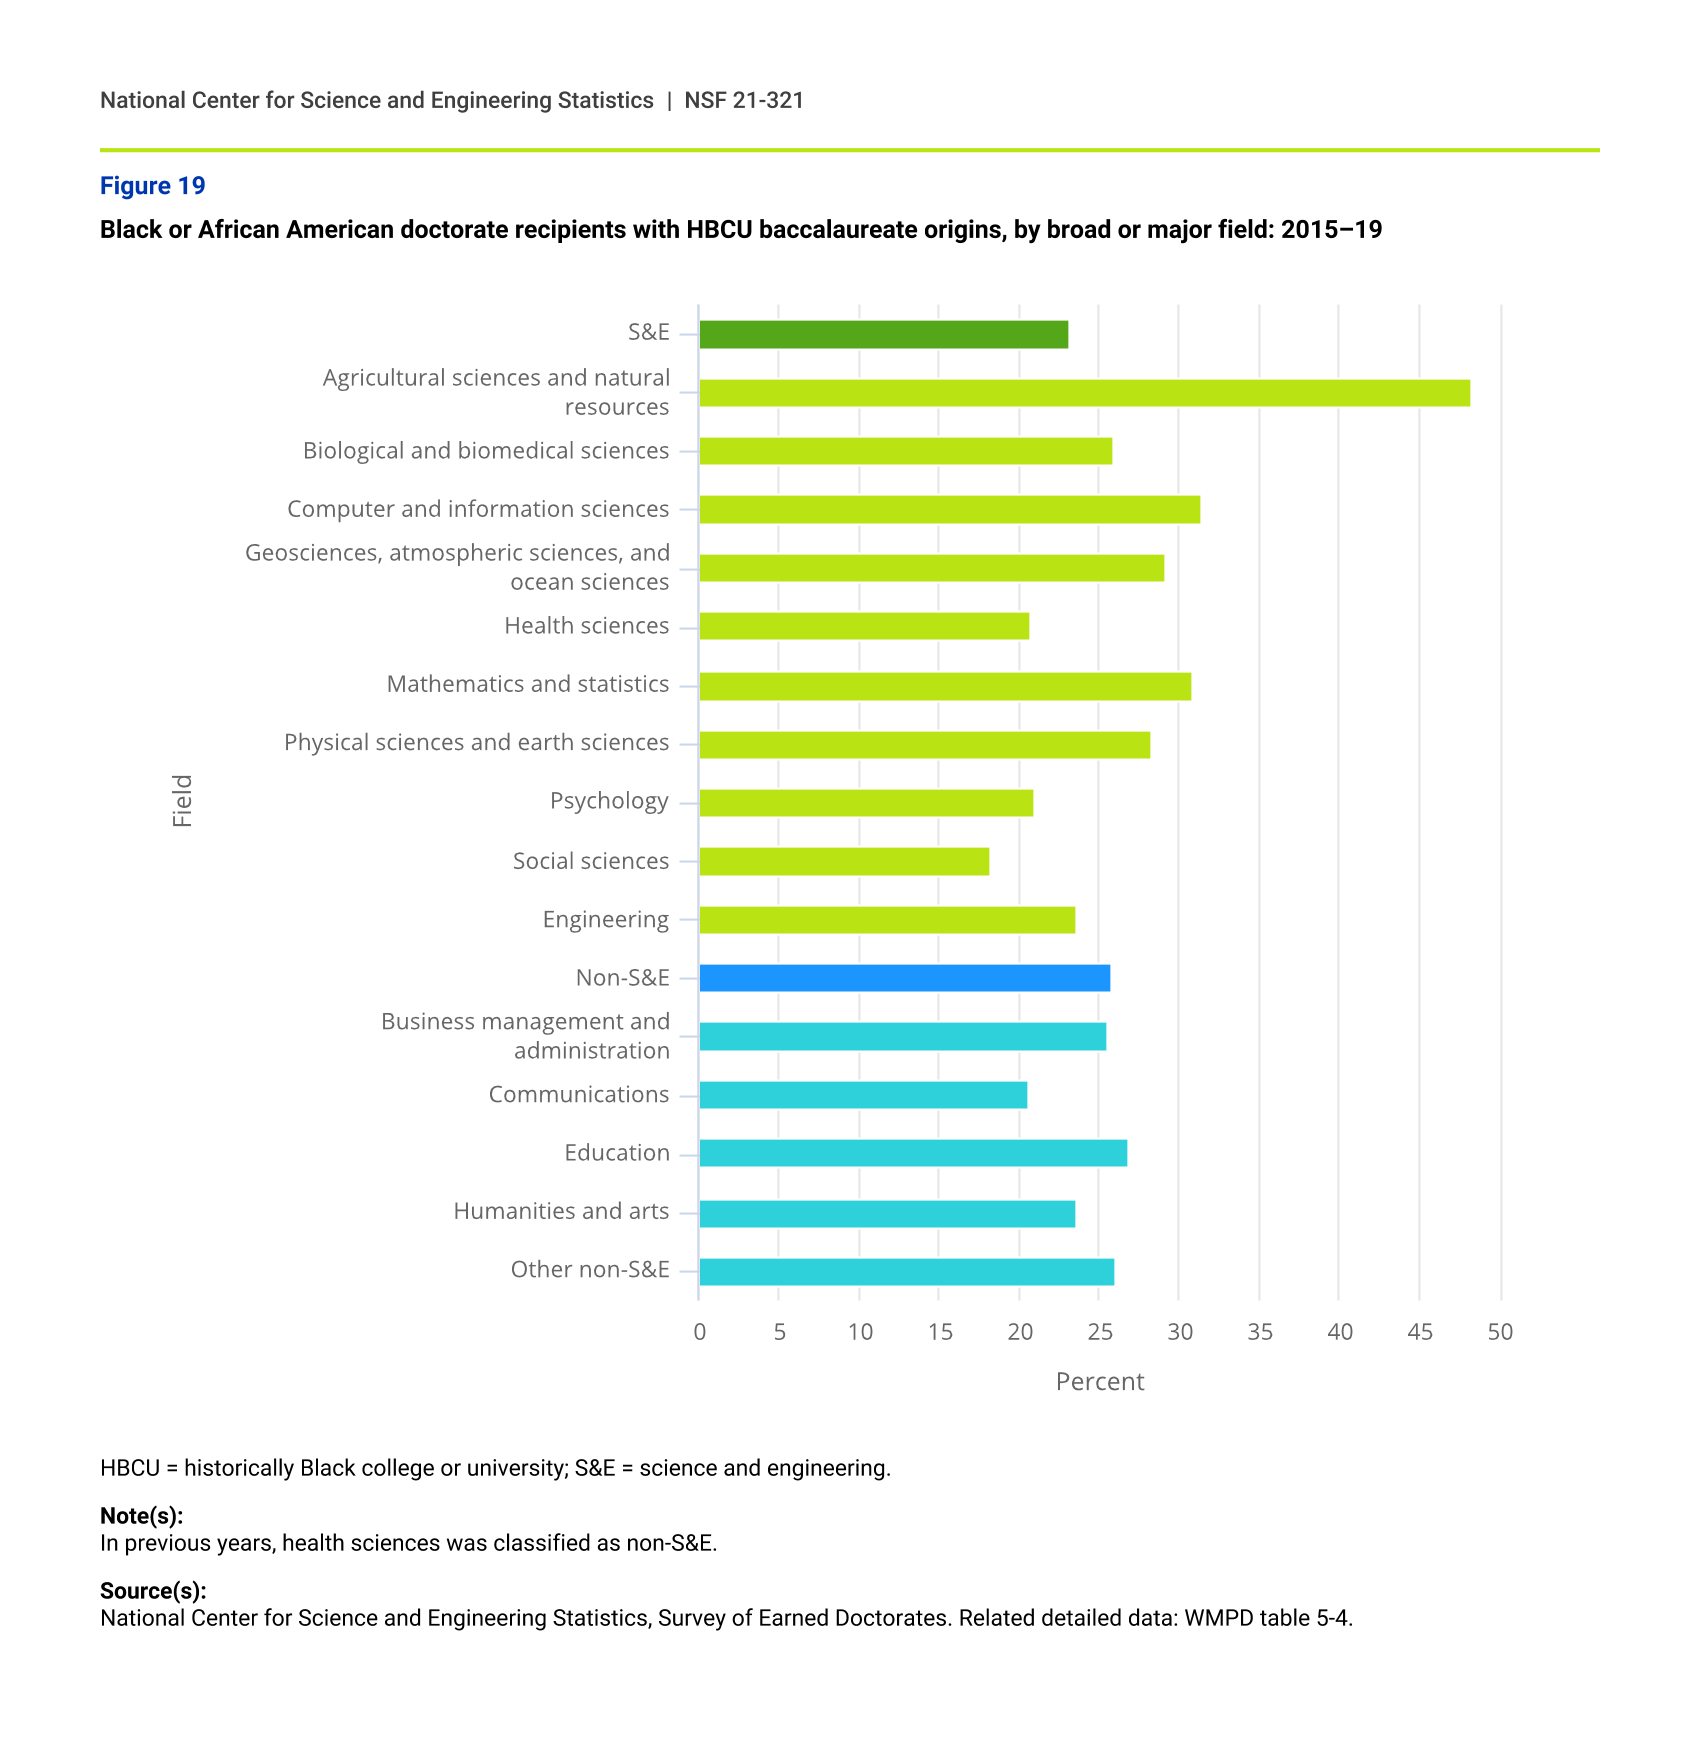
HBCUs have an important role in preparing students for S&E doctoral programs. Although 14.9% of Blacks or African Americans who received a bachelor’s degree in S&E fields in 2018 did so from an HBCU, 23.2% of Black or African American graduates who earned an S&E doctorate between 2015 and 2019 earned their bachelor’s degree from an HBCU. Both shares were slightly down over the past few years, yet it is clear that HBCUs continue to have an impact in increasing diversity in the science and engineering fields. HBCUs produced large shares of baccalaureate recipients who later earned doctoral degrees in agricultural sciences and natural resources, computer and information sciences, and mathematics and statistics (figure 19). (See appendix table A-1 for the top baccalaureate institutions of Black or African American S&E doctorate recipients.)
Black or African American doctorate recipients with HBCU baccalaureate origins, by broad or major field: 2015–19
| Field | Percent |
|---|---|
| S&E | 23.15 |
| Agricultural sciences and natural resources | 48.36 |
| Biological and biomedical sciences | 25.92 |
| Computer and information sciences | 31.33 |
| Geosciences, atmospheric sciences, and ocean sciences | 29.17 |
| Health sciences | 20.70 |
| Mathematics and statistics | 30.91 |
| Physical sciences and earth sciences | 28.28 |
| Psychology | 21.00 |
| Social sciences | 18.24 |
| Engineering | 23.53 |
| Non-S&E | 25.84 |
| Business management and administration | 25.49 |
| Communications | 20.61 |
| Education | 26.79 |
| Humanities and arts | 23.52 |
| Other non-S&E | 25.98 |
HBCU = historically Black college or university; S&E = science and engineering.
Note(s):
In previous years, health sciences was classified as non-S&E.
Source(s):
National Center for Science and Engineering Statistics, Survey of Earned Doctorates. Related detailed data: WMPD table 5-4.
American Indians or Alaska Natives
The number of American Indians or Alaska Natives who earned bachelor’s degrees in S&E declined from 2,930 to 2,844 between 2016 and 2018. Across S&E fields of study, more American Indian or Alaska Native men than women received bachelor’s degrees in engineering in 2018. However, American Indian or Alaska Native women surpassed their male counterparts in social sciences, psychology, and biological and agricultural sciences (figure 20).
Bachelor's degrees in science and engineering earned by American Indians or Alaska Natives, by sex and field: 2018
| Sex | Engineering | Social sciences | Psychology | Earth and physical sciences | Mathematics and statistics | Computer sciences | Biological and agricultural sciences |
|---|---|---|---|---|---|---|---|
| Women | 89 | 521 | 413 | 62 | 31 | 62 | 406 |
| Men | 269 | 293 | 134 | 69 | 30 | 188 | 277 |
Note(s):
Race and ethnicity breakouts are for U.S. citizens and permanent residents only.
Source(s):
Department of Education, National Center for Education Statistics, Integrated Postsecondary Education Data System, Completions Survey, 2018, unrevised provisional release data, accessed 14 January 2020. Related detailed data: WMPD table 5-3.
Persons with disability
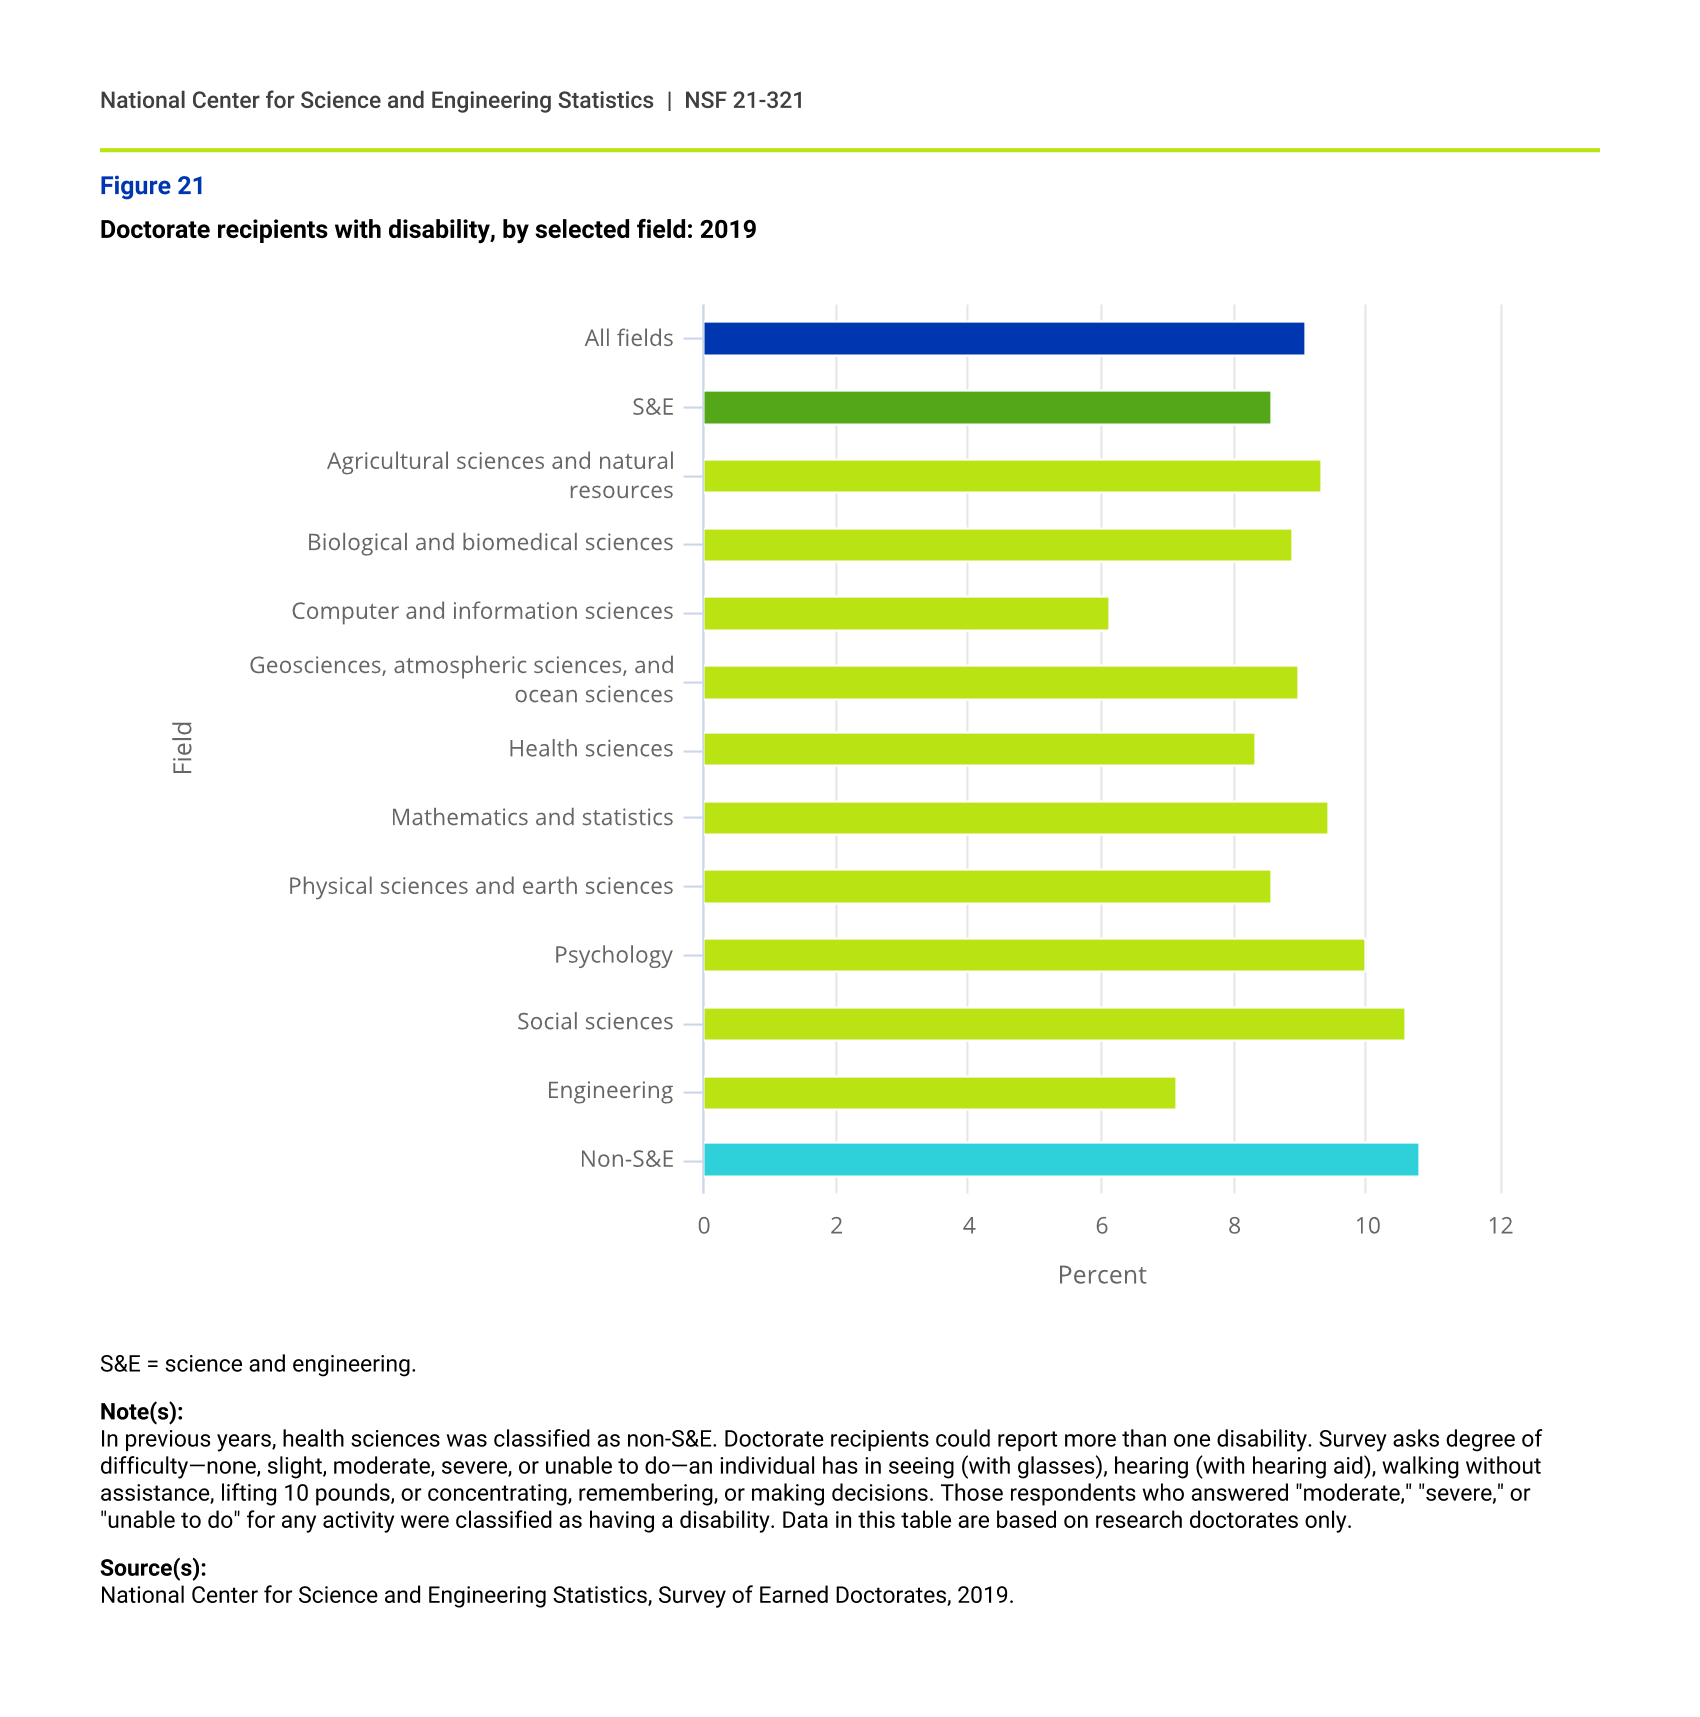
There is little data on persons with disability by field of study. However, this information is available for doctorate recipients. Of all graduates awarded doctoral degrees in 2019, 9.1% reported having a disability. That is, moderate or greater difficulty of one or more tasks—seeing; hearing; walking; lifting 10 pounds; or concentrating, remembering, or making decisions. Among doctorate recipients, the disability rate in most science fields of study was lower than the overall rate in 2019, with the exceptions of psychology (10.0%) and social sciences (10.6%). Doctorate recipients in engineering had the lowest disability rate (7.1%) (figure 21).
Doctorate recipients with disability, by selected field: 2019
| Field | Percent with disability of all disability respondents |
|---|---|
| All fields | 9.08 |
| S&E | 8.59 |
| Agricultural sciences and natural resources | 9.34 |
| Biological and biomedical sciences | 8.89 |
| Computer and information sciences | 6.14 |
| Geosciences, atmospheric sciences, and ocean sciences | 8.99 |
| Health sciences | 8.34 |
| Mathematics and statistics | 9.43 |
| Physical sciences and earth sciences | 8.59 |
| Psychology | 9.98 |
| Social sciences | 10.58 |
| Engineering | 7.13 |
| Non-S&E | 10.80 |
S&E = science and engineering.
Note(s):
In previous years, health sciences was classified as non-S&E. Doctorate recipients could report more than one disability. Survey asks degree of difficulty—none, slight, moderate, severe, or unable to do—an individual has in seeing (with glasses), hearing (with hearing aid), walking without assistance, lifting 10 pounds, or concentrating, remembering, or making decisions. Those respondents who answered "moderate," "severe," or "unable to do" for any activity were classified as having a disability. Data in this table are based on research doctorates only.
Source(s):
National Center for Science and Engineering Statistics, Survey of Earned Doctorates, 2019.