 An official website of the United States government
 Introduction
Women, persons with disabilities, and some minority groups—Blacks or African Americans, Hispanics or Latinos, and American Indians or Alaska Natives—are underrepresented in science and engineering (S&E). That is, their representation in S&E education and S&E employment is smaller than their representation in the U.S. population.
Although women have reached parity with men among S&E bachelor’s degree recipients—half of S&E bachelor’s degrees were awarded to women in 2018—women’s representation varies greatly by field and women are still underrepresented in S&E occupations. Hispanics or Latinos have gradually increased their share of S&E degrees, while Blacks or African Americans and American Indians or Alaska Natives have seen slight declines. These three minority groups remain underrepresented in S&E educational attainment and in the S&E workforce. In contrast, Whites and Asians tend to have shares of S&E degree holders and employed scientists and engineers that are similar to or greater than their share of the population and of the labor force.
Underrepresentation and overrepresentation of women and racial or ethnic groups vary by field of study and occupation. Variations in the representation of these groups may be rooted in differences in precollege course taking, participation in S&E higher education, overall educational attainment, and other reasons.
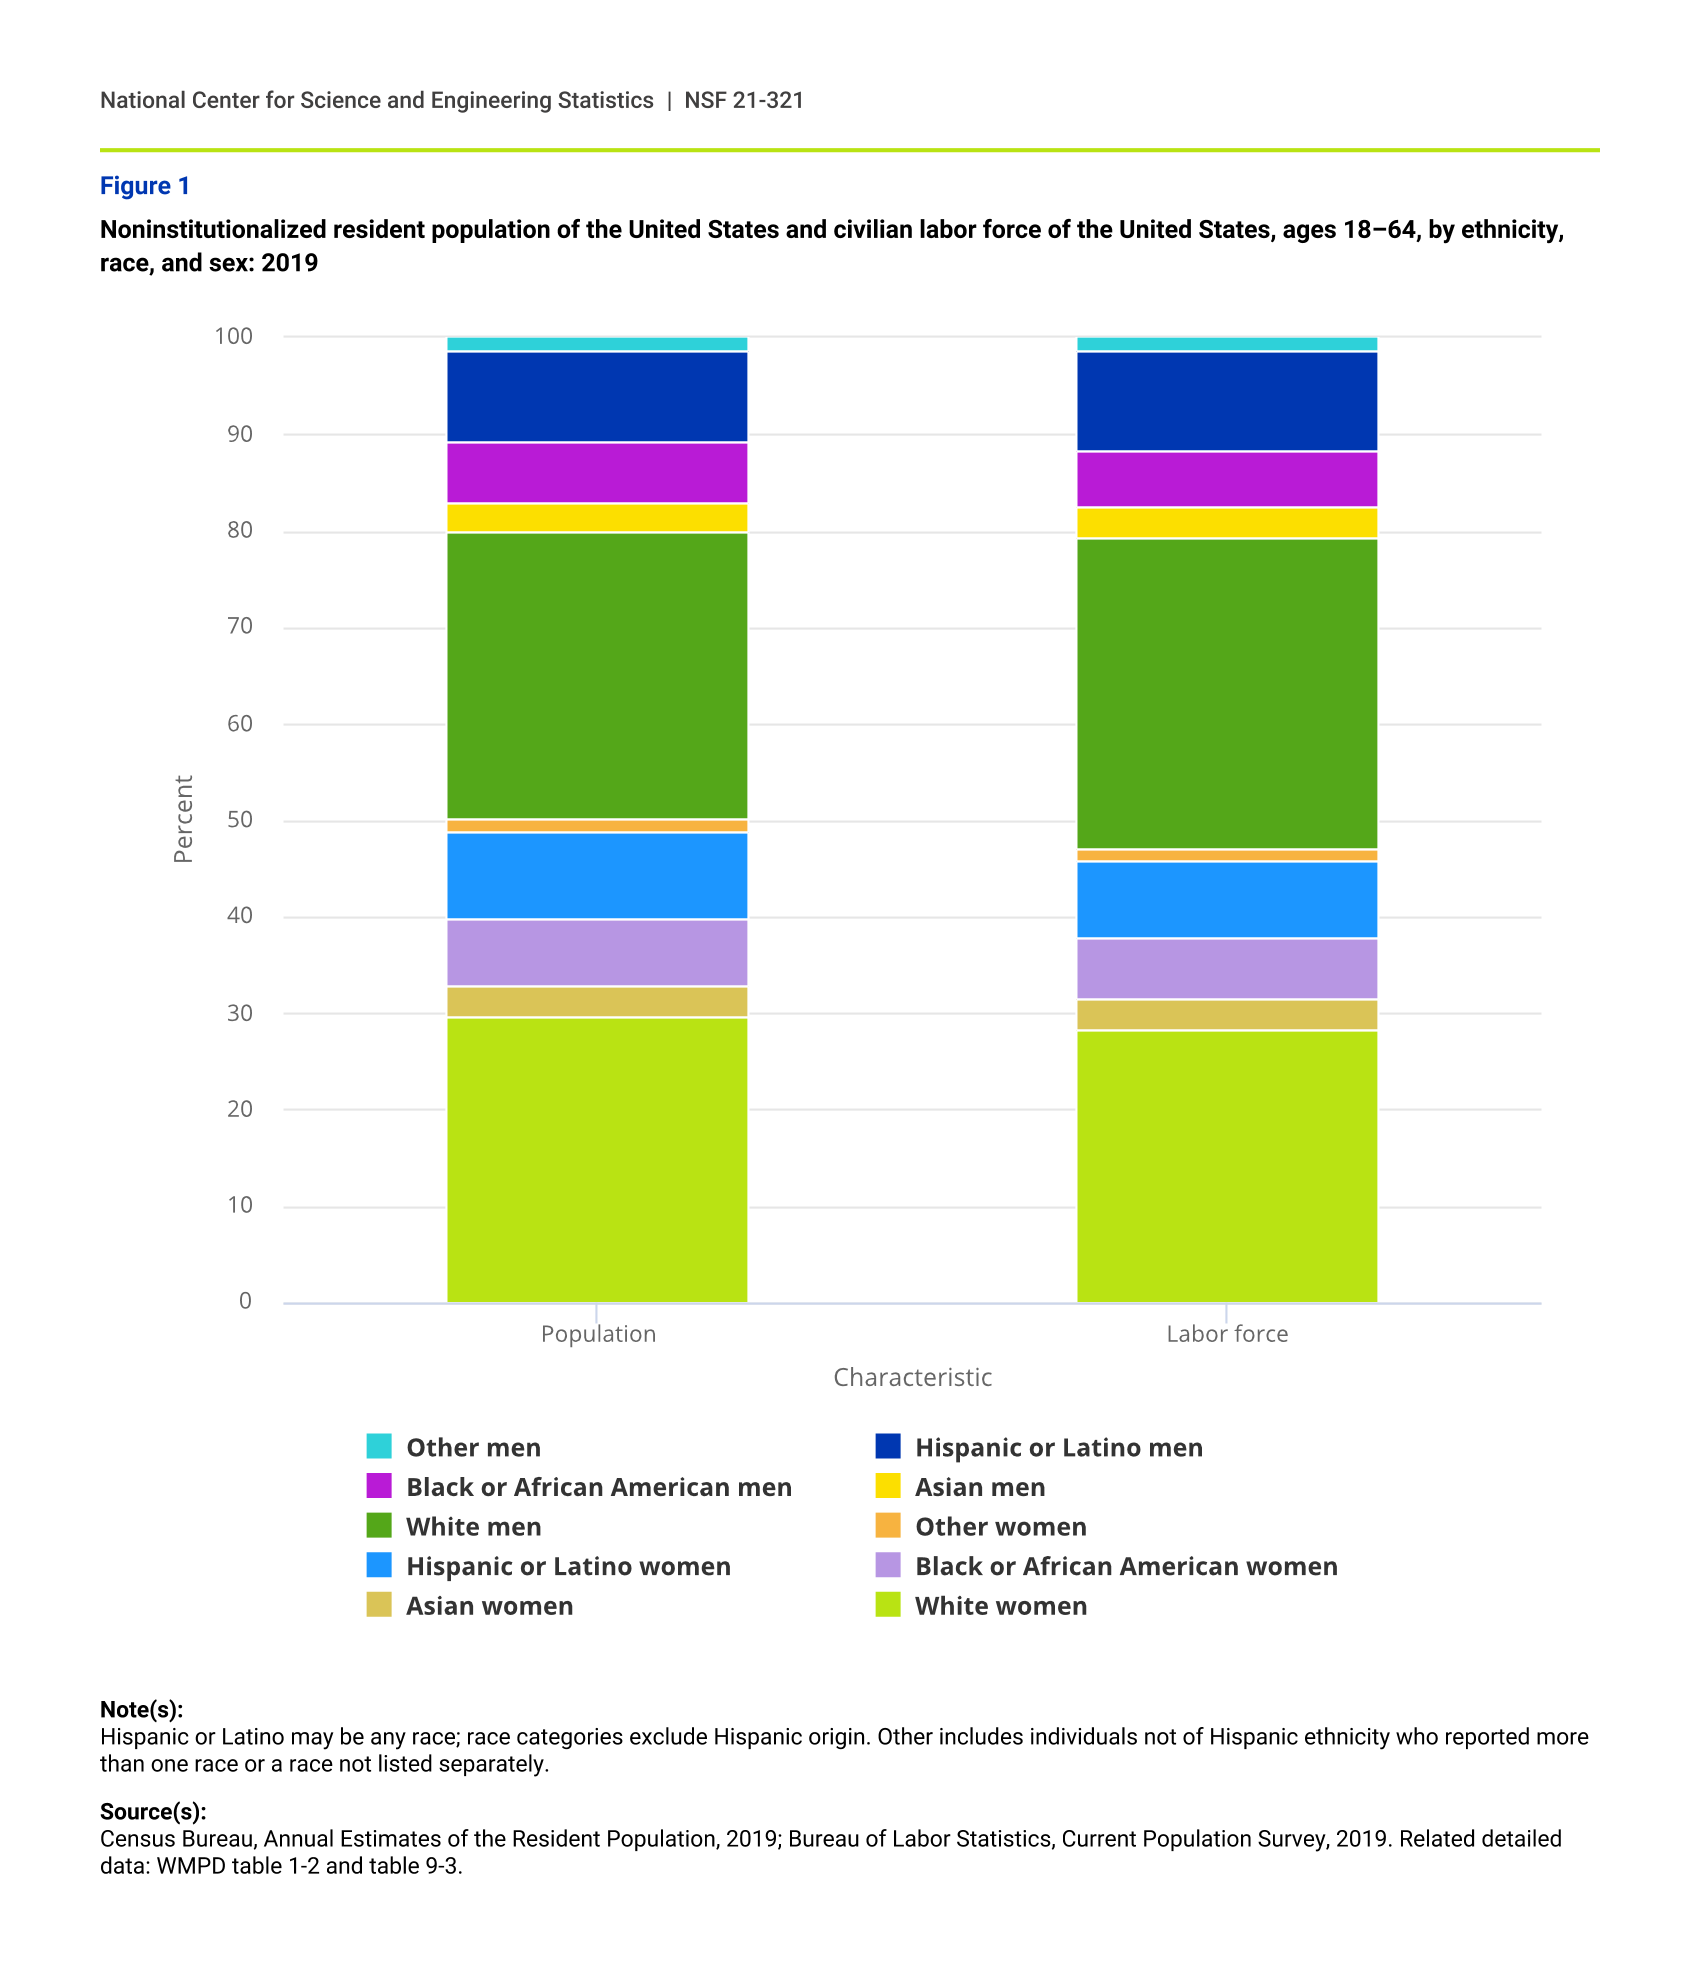
Women and underrepresented minorities constituted a substantial portion of the U.S. population ages 18–64 years old in 2019. Women were 50.1% of the population; Hispanics or Latinos, 18.5%; Blacks or African Americans, 13.0%; Asians, 6.3%; and other racial and ethnic groups combined, 2.8% (figure 1). According to the latest Census Bureau projections, minorities will account for 56% of the U.S. population by 2060. The largest growth is projected in the numbers of Hispanics, Asians, and persons of multiple races.
Although women were just over half the population ages 18–64 years old in 2019, they constituted 47.1% of the labor force—individuals who were employed or unemployed (not employed and actively looking for a job). This difference is due to women in each racial and ethnic category making up a slightly smaller share of the labor force than in the population. In contrast, White men and Hispanic or Latino men make up larger shares of the labor force than of the population, and Black or African American men make up a slightly smaller share.
In terms of the underrepresentation of women in S&E fields, the share of S&E research doctorates awarded to women in 2019 was 42.2% versus women making up 50.1% of the population and 47.1% of the labor force. Underrepresented minorities were awarded 11.7% of S&E research doctorates, while making up about a third of both the population and the labor force. Conversely, Asians were awarded 30.9% of S&E research doctorates while making up 6.3% of the population and 6.3% of the labor force. These trends will be examined in more detail in this report.
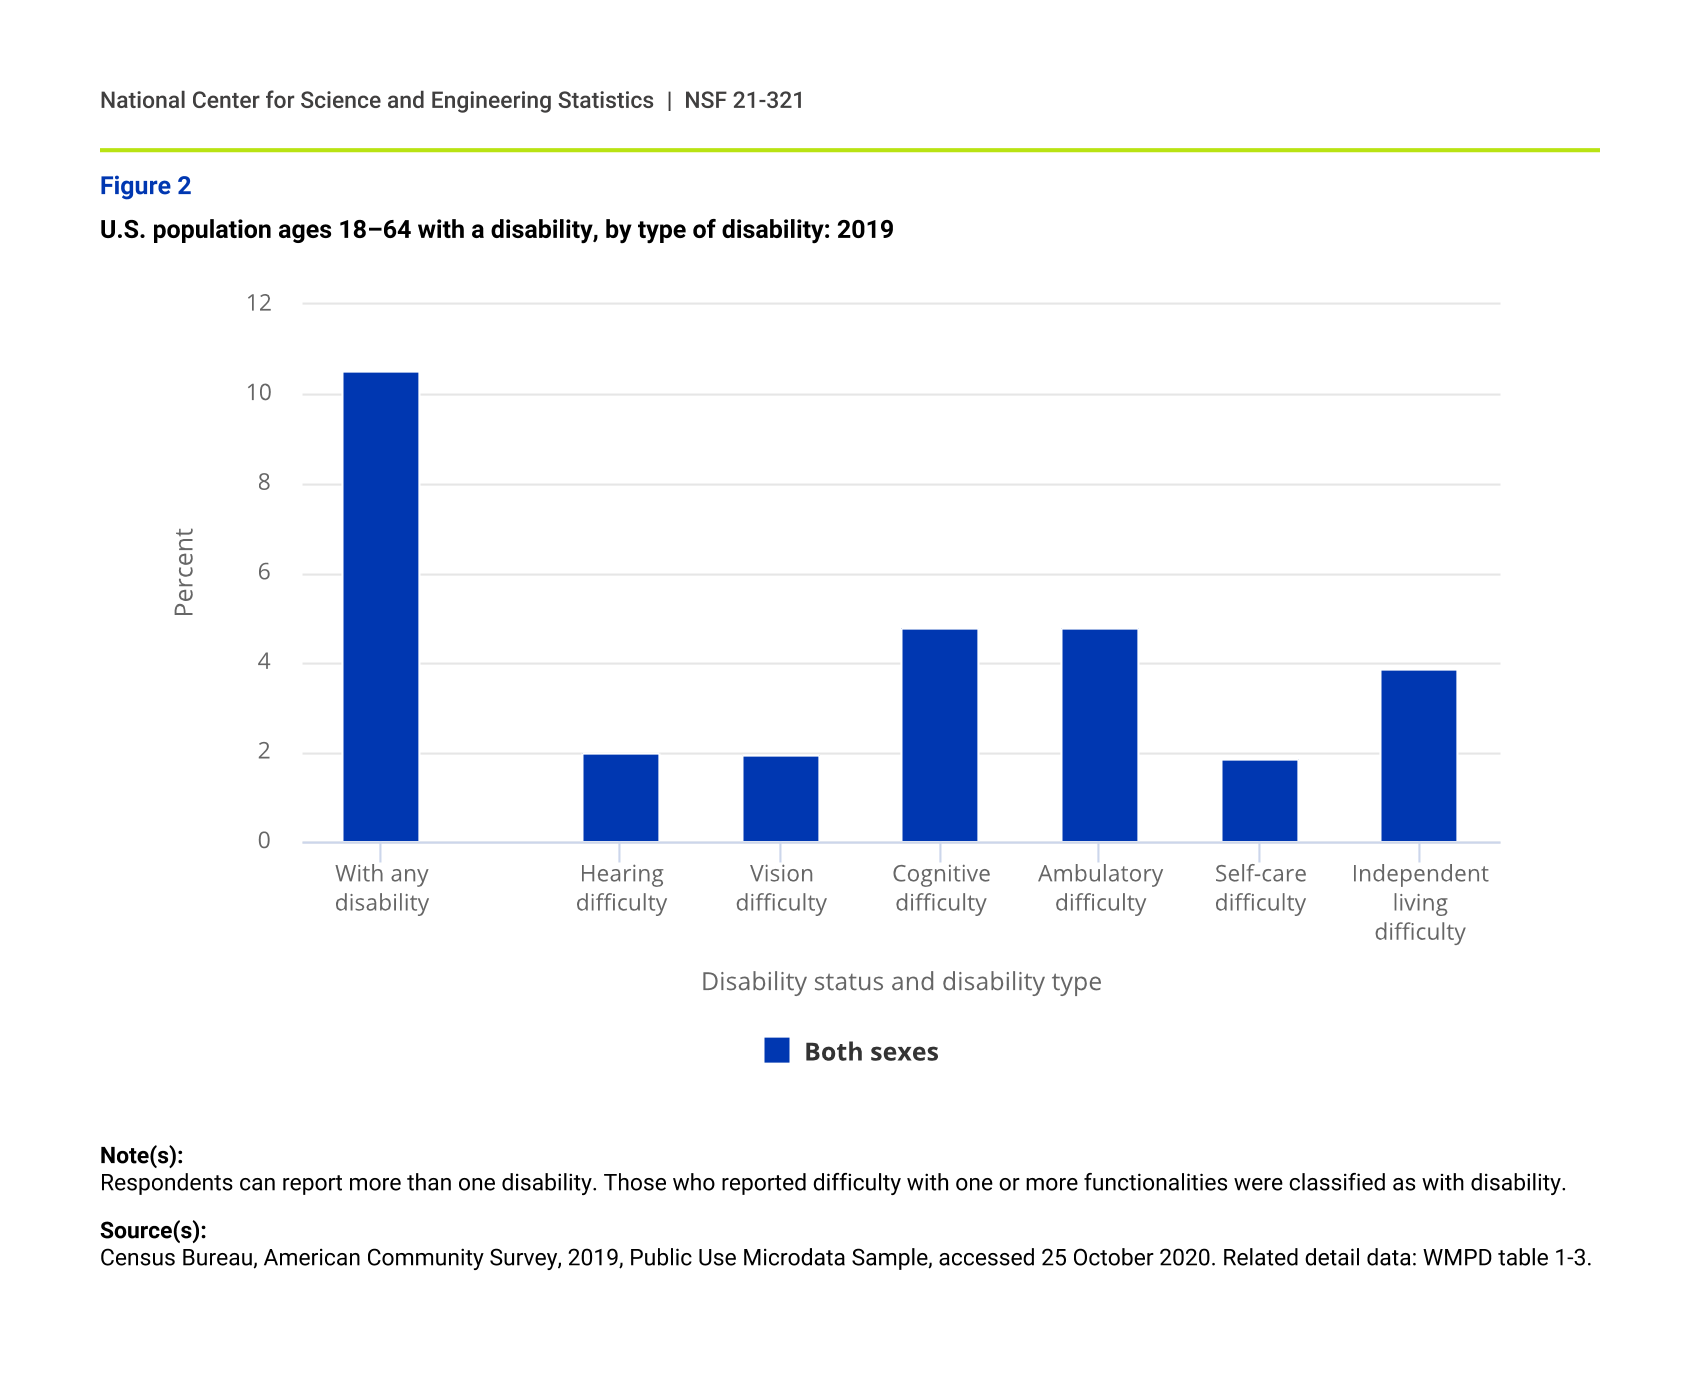
Estimates of the proportion of the population with one or more disabilities vary depending on the criteria used to define “disability.” Also, trends in the prevalence of disability may be affected by subtle changes in wording and criteria of disability survey questions over time, leading to changes in the reporting and measurement of disability. Currently, according to the Census Bureau’s American Community Survey, 10.5% of the working-age population reported some type of disability in 2019, with men and women reporting similar percentages for having any disability and for each type of disability. The most frequently reported disabilities are ambulatory difficulty and cognitive difficulty, each 4.8% of the working-age population (figure 2).
Disabilities do not necessarily limit a person’s ability to participate in educational experiences or be productive in an occupation. Persons with one or more disabilities may or may not require special accommodation to enable them to succeed in school or at work.
Noninstitutionalized resident population of the United States and civilian labor force of the United States, ages 18–64, by ethnicity, race, and sex: 2019
| Characteristic | White women | Asian women | Black or African American women | Hispanic or Latino women | Other women | White men | Asian men | Black or African American men | Hispanic or Latino men | Other men |
|---|---|---|---|---|---|---|---|---|---|---|
| Population | 29.62 | 3.32 | 6.75 | 9.06 | 1.41 | 29.78 | 3.01 | 6.26 | 9.46 | 1.35 |
| Labor force | 28.40 | 3.03 | 6.32 | 8.00 | 1.33 | 32.17 | 3.32 | 5.72 | 10.40 | 1.32 |
Note(s):
Hispanic or Latino may be any race; race categories exclude Hispanic origin. Other includes individuals not of Hispanic ethnicity who reported more than one race or a race not listed separately.
U.S. population ages 18–64 with a disability, by type of disability: 2019
| Disability status and disability type | Both sexes |
|---|---|
| With any disability | 10.52 |
| Hearing difficulty | 2.01 |
| Vision difficulty | 1.96 |
| Cognitive difficulty | 4.78 |
| Ambulatory difficulty | 4.79 |
| Self-care difficulty | 1.84 |
| Independent living difficulty | 3.87 |
Note(s):
Respondents can report more than one disability. Those who reported difficulty with one or more functionalities were classified as with disability.
Source(s):
Census Bureau, American Community Survey, 2019, Public Use Microdata Sample, accessed 25 October 2020. Related detail data: WMPD table 1-3.