 An official website of the United States government

U.S. Nonprofits Spent $22.6 Billion on R&D Activities in FY 2016
The nonprofit sector is one of four major sectors of the economy (along with business, government, and higher education) that performs or funds research and experimental development (R&D). Nationally, nonprofits spent an estimated $22.6 billion on R&D performed by their organizations in FY 2016 (table 1), which is equivalent to 4% of the estimated total spent on R&D in the United States in 2016.
Data in this InfoBrief are from the FY 2016 Nonprofit Research Activities (NPRA) Survey, sponsored by the National Center for Science and Engineering Statistics (NCSES) within the National Science Foundation. The FY 2016 NPRA Survey marks the first nationally representative collection of R&D data from U.S. 501(c) organizations other than universities and colleges in more than 20 years. When the survey was last conducted in 1997, nonprofits spent an estimated $7.3 billion on R&D, or 3% of the U.S. R&D total. Due to low response rates among certain subgroups, such as hospitals, during the FY 2016 data collection, the survey results were initially discussed via an NCSES working paper with an advisement that NCSES does not consider all the estimates in the working paper to be official statistics. Subsequently, NCSES performed an additional assessment, and this InfoBrief and corresponding FY 2016 NPRA data tables present the subset of top-level official estimates.
Total expenditures for R&D performed by nonprofit organizations, by source of funds: FY 2016
Source(s):
National Center for Science and Engineering Statistics, Survey of Nonprofit Research Activities, FY 2016.
Sources of Funding for Nonprofit R&D Performance
One of the largest funding sources for FY 2016 nonprofit research performance was the federal government, contributing $8.3 billion, or 37%, to the total (table 1). Internal funding within the nonprofit organizations was the next largest funding source, with $6.7 billion (30%) of the total originating from nonprofits’ own funds. Outside nonprofits and nonprofit foundations contributed an additional 16% ($3.5 billion) in funding. Businesses funded nearly $2 billion (9%) of the total nonprofit performance, and funding from individual donors comprised $780 million (4%).
Nonprofit R&D Performance by Type
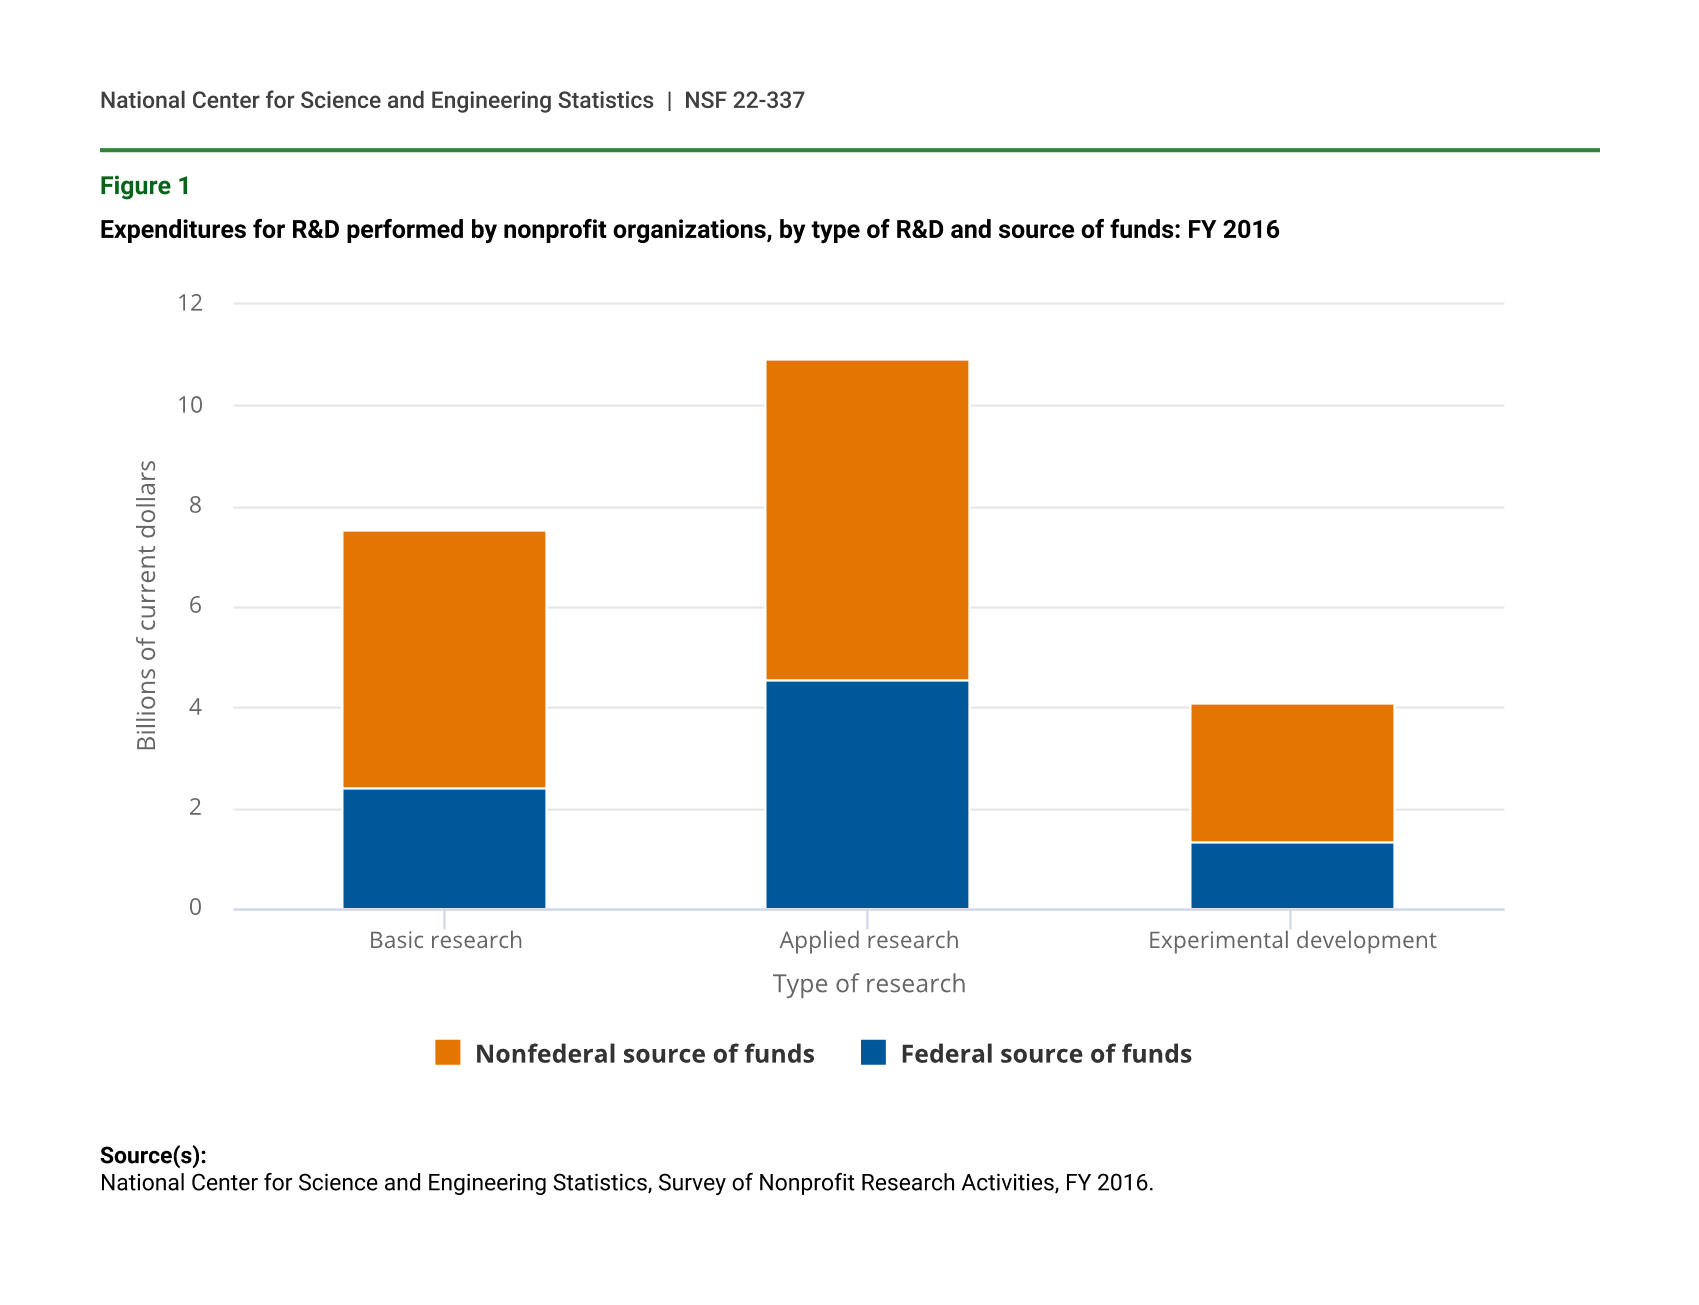
Nonprofits reported performing more applied research than basic research or experimental development in FY 2016 (figure 1). Roughly half of nonprofit R&D performance was characterized as applied research (49%), a third was basic research (33%), and the remainder was experimental development (18%). For federally funded projects, the share of applied research was even greater, at 55%.
Expenditures for R&D performed by nonprofit organizations, by type of R&D and source of funds: FY 2016
| Type of research | Federal source of funds | Nonfederal source of funds |
|---|---|---|
| Basic research | 2.40 | 5.15 |
| Applied research | 4.54 | 6.40 |
| Experimental development | 1.31 | 2.77 |
Source(s):
National Center for Science and Engineering Statistics, Survey of Nonprofit Research Activities, FY 2016.
Nonprofit R&D Personnel
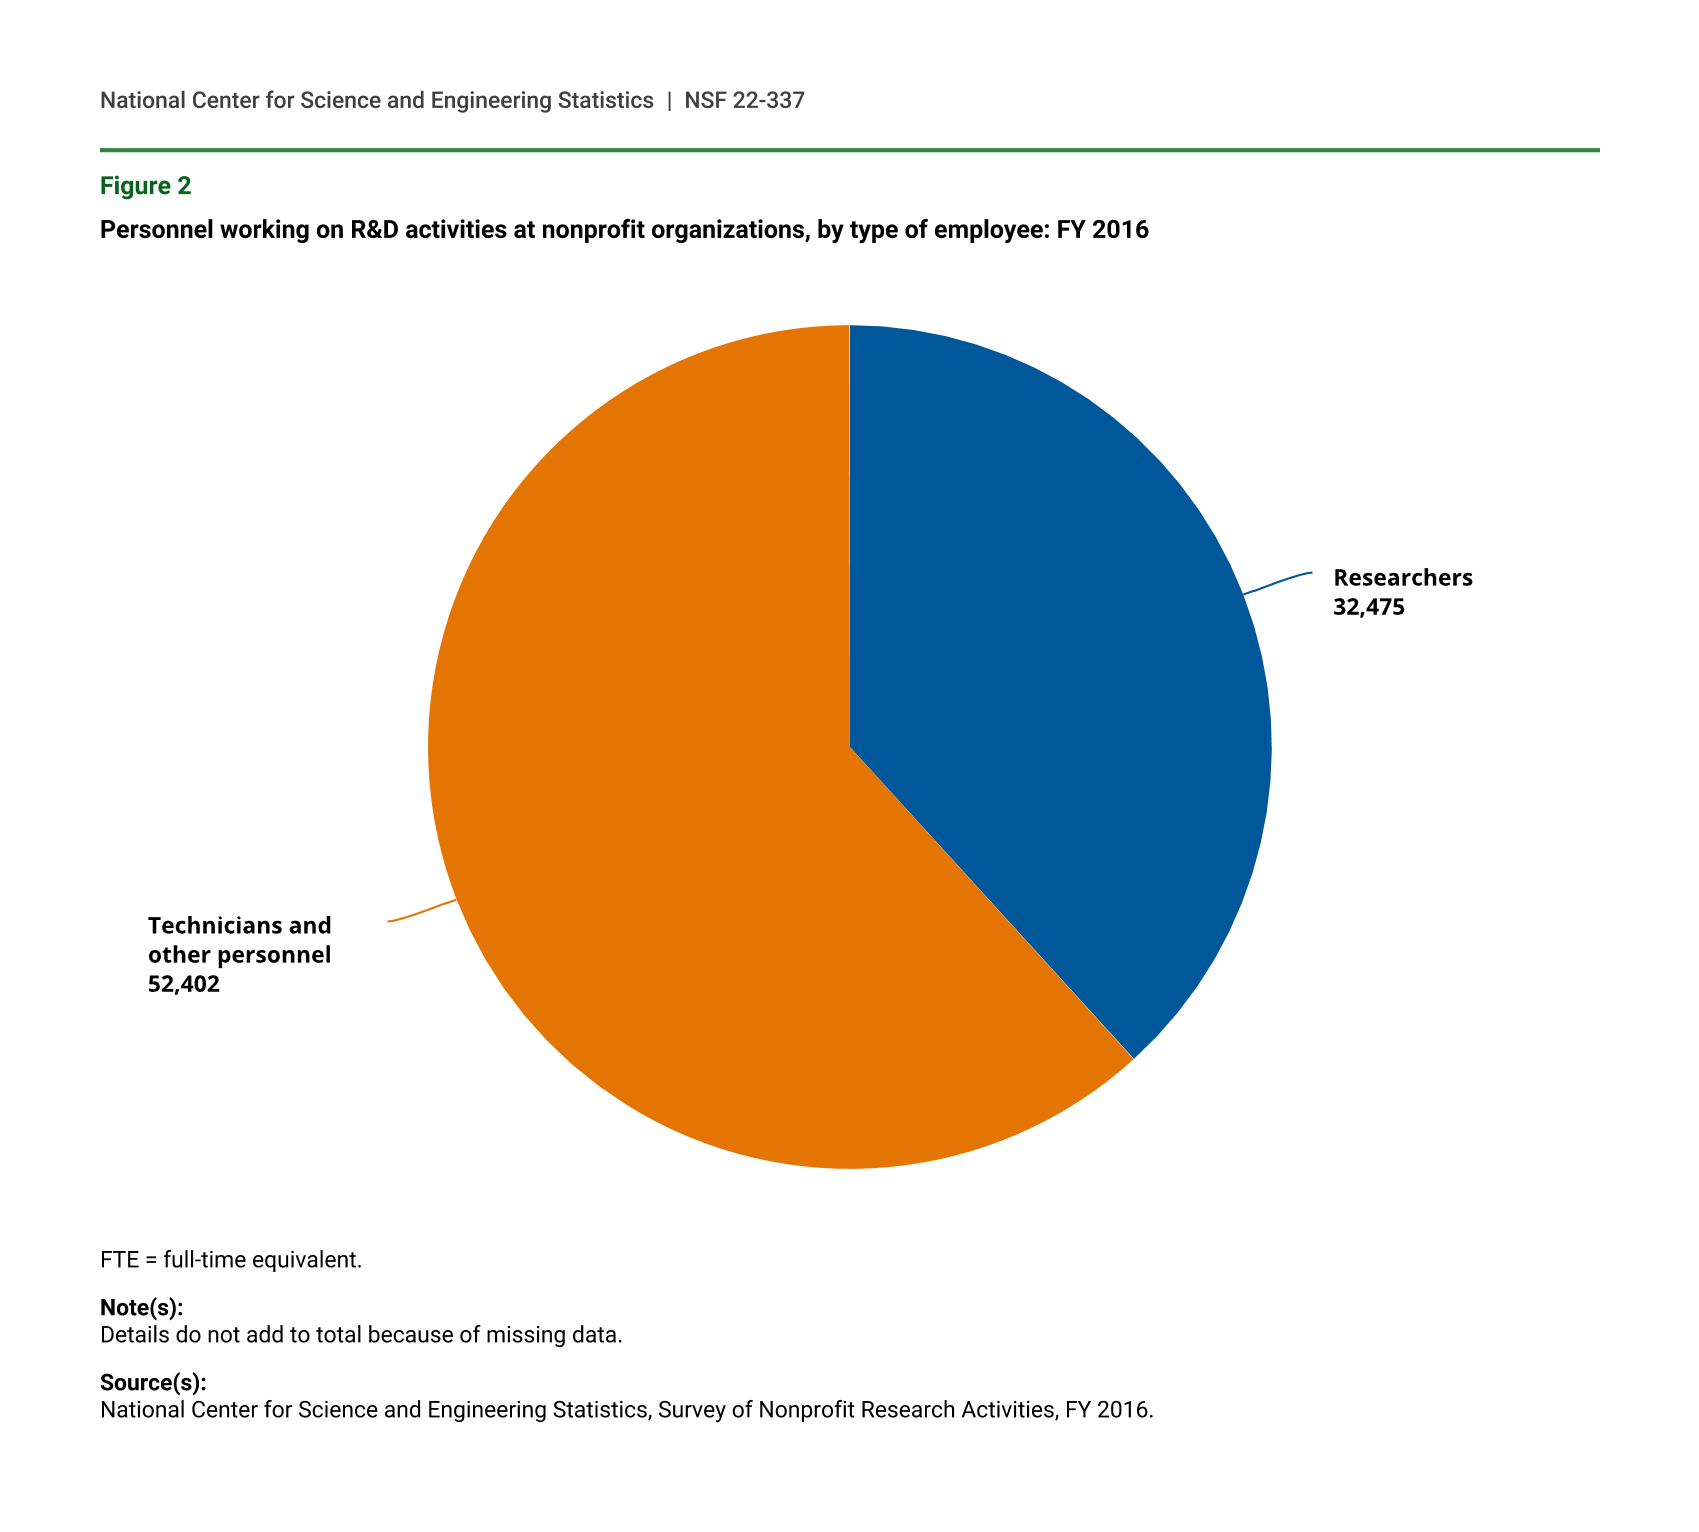
An estimated total of 87,010 full-time equivalent employees worked on R&D in the nonprofit sector in FY 2016 (figure 2). Over a third (32,475) were classified as researchers (defined as professionals engaged in the conception or creation of new knowledge), and 60% were classified as technicians and other personnel (defined as staff who work under the supervision of researchers to conduct research activities or who provide direct support services for the research project).
Personnel working on R&D activities at nonprofit organizations, by type of employee: FY 2016
| Type of employee | Total employees (FTE) |
|---|---|
| Researchers | 32,475 |
| Technicians and other personnel | 52,402 |
FTE = full-time equivalent.
Note(s):
Details do not add to total because of missing data.
Source(s):
National Center for Science and Engineering Statistics, Survey of Nonprofit Research Activities, FY 2016.
Nonprofit R&D Funding Provided to Others
In addition to the money spent performing R&D themselves, nonprofits provided $10.5 billion in funding for R&D performed outside their organizations in FY 2016 (table 2). Nearly three-quarters of this funding went to universities ($7.6 billion). The next highest amount ($1.8 billion) went to other nonprofits. Nonprofits provided $870 million in R&D funding to for-profit businesses and $232 million to other recipients.
Total funds provided by nonprofit organizations to others for R&D, by type of funded organization: FY 2016
Source(s):
National Center for Science and Engineering Statistics, Survey of Nonprofit Research Activities, FY 2016.
Data Sources, Limitations, and Availability
The FY 2016 NPRA Survey was conducted in 2018 with a sample of 6,071 nonprofit organizations representing 117,539 total eligible nonprofit organizations in the United States. The fiscal year referred to throughout this report was the nonprofit organizations’ fiscal year; for the majority (62%) of organizations reporting R&D performance, this fiscal year ended in either September or December of 2016.
The response rate was 48% unweighted and 61% weighted overall. Due to a low response rate, particularly for certain subgroups, such as hospitals (35% unweighted and 45% weighted response rate), not all of the FY 2016 NPRA Survey data met NCSES’ criteria for official statistics. This InfoBrief contains only estimates that met the official statistics criteria. For more information on the limitations of the FY 2016 NPRA Survey and our criteria for official statistics, see the FY 2016 Nonprofit Research Activities Survey: Summary of Methodology, Assessment of Quality, and Synopsis of Results working paper and the Additional Assessment of FY 2016 Nonprofit Research Activities Survey Data for NCSES Official Statistics Publication (links provided in notes 2 and 3, respectively).
The estimates in this InfoBrief are based on responses from a sample of the population and may differ from actual values because of sampling variability or other factors. As a result, apparent differences between the estimates for two or more groups may not be statistically significant. All comparative statements in this InfoBrief have undergone statistical testing and are significant at the 90% confidence level unless otherwise noted. The variances of estimates in this report were calculated using the successive difference replication method.
The full set of data tables for FY 2016 that met NCSES quality criteria for official statistics are available at https://ncses.nsf.gov/pubs/nsf22338/. For more information, please contact the author.
Notes
1For the latest statistics from National Patterns of R&D Resources on total U.S. R&D performance and sources of funding, see National Center for Science and Engineering Statistics (NCSES). 2022. National Patterns of R&D Resources: 2019–20 Data Update. Data Tables NSF 22-320. Alexandria, VA: National Science Foundation. Available at https://ncses.nsf.gov/pubs/nsf22320. The estimate from National Patterns of R&D Resources for nonprofit R&D performance in 2016 was $22.6 billion, or 4.3% of the U.S. total.
2Britt R, Jankowski JE; National Center for Science and Engineering Statistics (NCSES). 2021. FY 2016 Nonprofit Research Activities Survey: Summary of Methodology, Assessment of Quality, and Synopsis of Results. Working Paper NCSES 21-202. Alexandria, VA: National Science Foundation. Available at https://www.nsf.gov/statistics/2021/ncses21202/.
3Britt R, Mamon S, ZuWallack R; National Center for Science and Engineering Statistics (NCSES). 2022. Additional Assessment of FY 2016 Nonprofit Research Activities Survey Data for NCSES Official Statistics Publication. Alexandria, VA: National Science Foundation. Available at https://ncses.nsf.gov/pubs/ncses22212/.
4Employees were measured as full-time equivalent (FTE). For example, 1 FTE equals 40 hours per week for 52 weeks per year. If an employee works 20 hours per week, they would count as half of an FTE.
5See Technical Notes in the full set of data tables for details on the survey frame and exclusions https://ncses.nsf.gov/pubs/nsf22338/.
Suggested Citation
Britt R; National Center for Science and Engineering Statistics (NCSES). 2022. U.S. Nonprofits Spent $22.6 Billion on R&D Activities in FY 2016. NSF 22-337. Alexandria, VA: National Science Foundation. Available at https://ncses.nsf.gov/pubs/nsf22337/.
Contact Us
NCSES
National Center for Science and Engineering Statistics
Directorate for Social, Behavioral and Economic Sciences
National Science Foundation
2415 Eisenhower Avenue, Suite W14200
Alexandria, VA 22314
Tel: (703) 292-8780
FIRS: (800) 877-8339
TDD: (800) 281-8749
E-mail: ncsesweb@nsf.gov
NSF 22-337
|September 22, 2022