 An official website of the United States government

Federal Science and Engineering Support to Higher Education Increased 3% in FY 2020
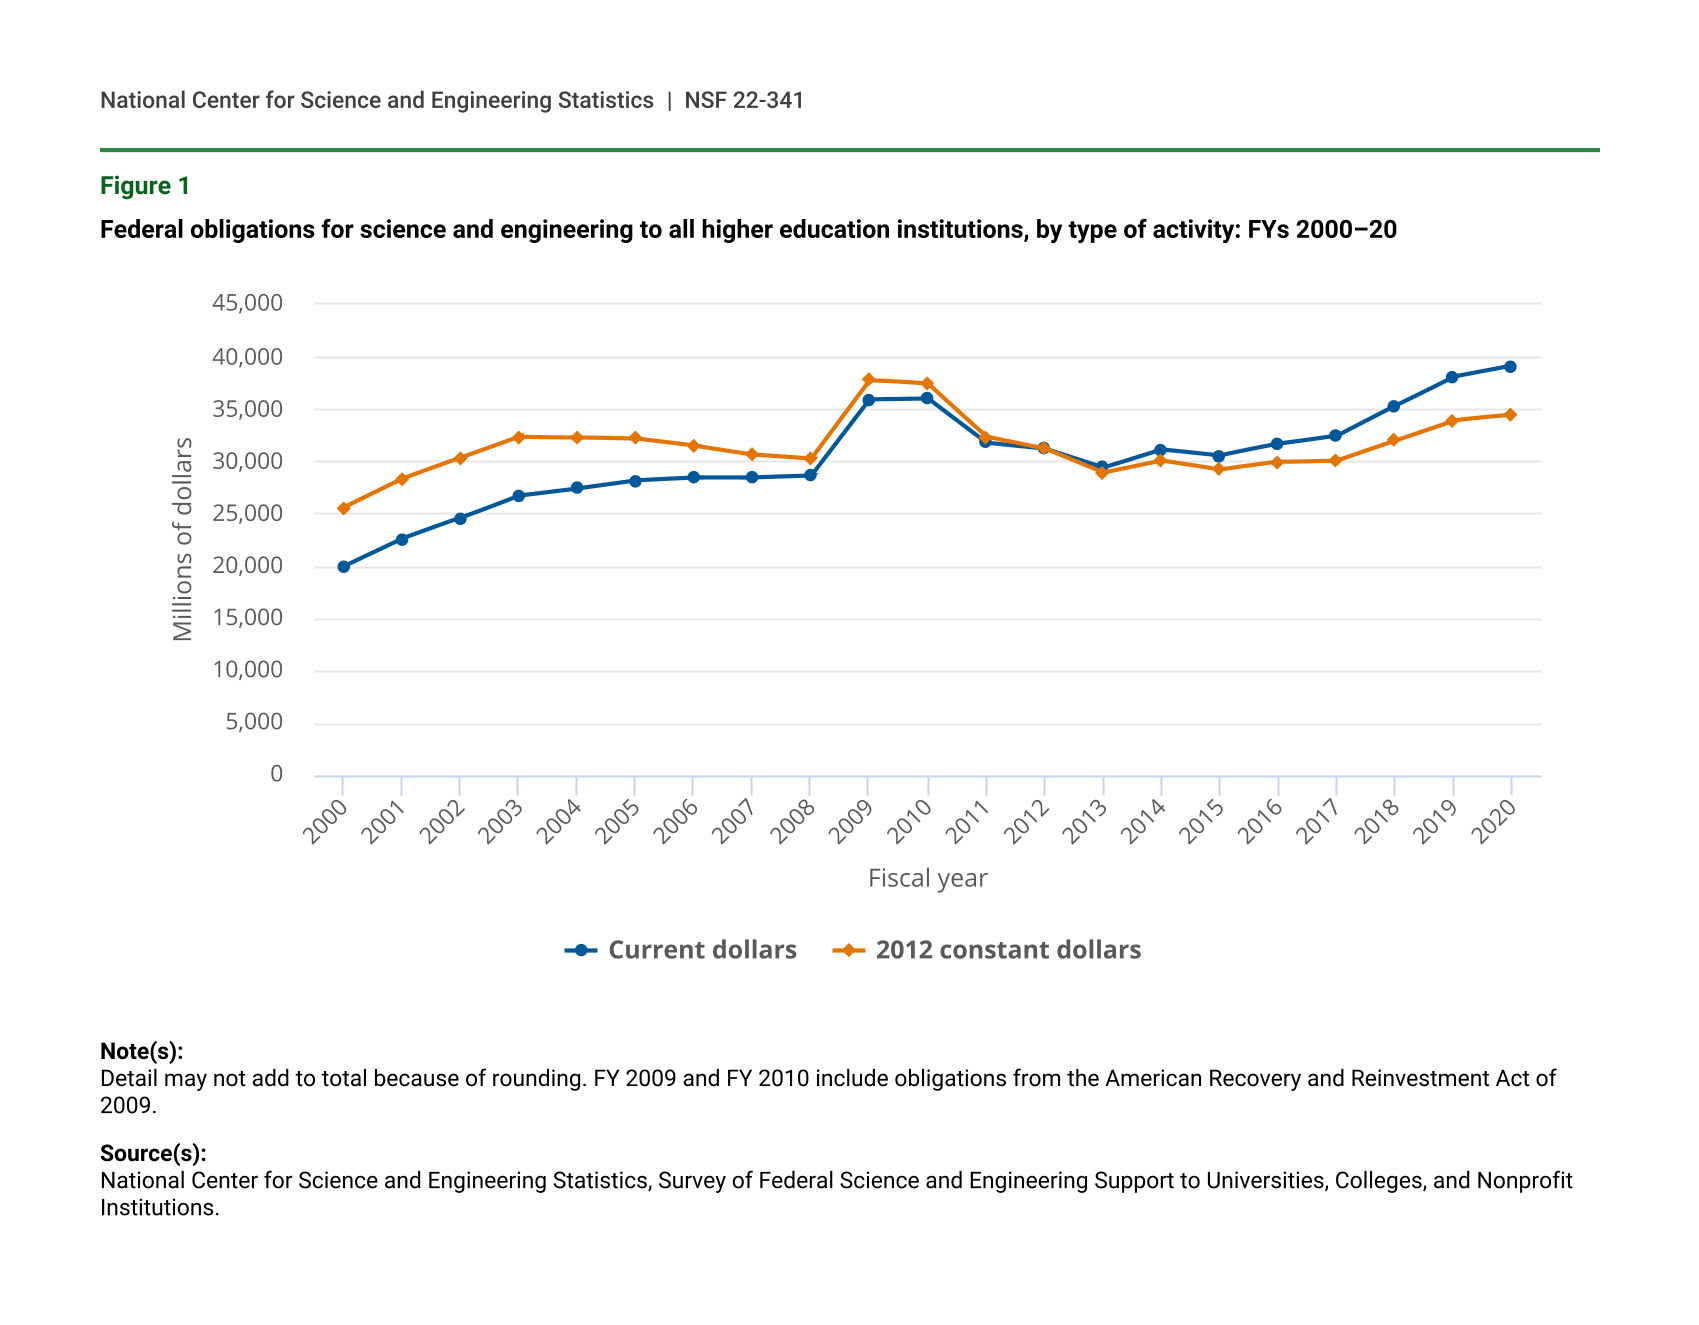
In FY 2020, federal agency obligations to universities and colleges for science and engineering (S&E) activities increased 3% from FY 2019 to a high of $39.1 billion in current dollars (figure 1). However, when adjusted for inflation, the FY 2020 obligations of $34.4 billion are below those of FYs 2009 and 2010 ($37.8 and $37.4 billion, respectively). Just as federal obligations for research and experimental development (R&D) were buoyed by the addition of funds from the American Recovery and Reinvestment Act in FYs 2009 and 2010, so too did federal obligations for S&E to higher education institutions increase with the contribution of $1.4 billion in stimulus funds in FY 2020 (table 1). Without the infusion of additional pandemic-related stimulus funds, total support for S&E to higher education would have been $37.8 billion, a decrease of 1% from FY 2019.
These and other estimates in this InfoBrief are from the FY 2020 Survey of Federal Science and Engineering Support to Universities, Colleges, and Nonprofit Institutions (Federal S&E Support Survey), conducted by the National Center for Science and Engineering Statistics (NCSES) within the National Science Foundation (NSF).
Federal obligations for science and engineering to all higher education institutions, by type of activity: FYs 2000–20
| Fiscal year | Current dollars | 2012 constant dollars |
|---|---|---|
| 2000 | 19,954 | 25,573 |
| 2001 | 22,585 | 28,308 |
| 2002 | 24,571 | 30,324 |
| 2003 | 26,727 | 32,347 |
| 2004 | 27,412 | 32,309 |
| 2005 | 28,170 | 32,193 |
| 2006 | 28,423 | 31,510 |
| 2007 | 28,413 | 30,670 |
| 2008 | 28,586 | 30,276 |
| 2009 | 35,874 | 37,753 |
| 2010 | 35,946 | 37,379 |
| 2011 | 31,762 | 32,356 |
| 2012 | 31,216 | 31,216 |
| 2013 | 29,407 | 28,901 |
| 2014 | 31,159 | 30,061 |
| 2015 | 30,563 | 29,194 |
| 2016 | 31,649 | 29,931 |
| 2017 | 32,440 | 30,107 |
| 2018 | 35,304 | 32,001 |
| 2019 | 38,084 | 33,915 |
| 2020 | 39,122 | 34,424 |
Note(s):
Detail may not add to total because of rounding. FY 2009 and FY 2010 include obligations from the American Recovery and Reinvestment Act of 2009.
Source(s):
National Center for Science and Engineering Statistics, Survey of Federal Science and Engineering Support to Universities, Colleges, and Nonprofit Institutions.
Federal obligations for science and engineering support to all higher education institutions, by stimulus and non-stimulus funds: FY 2020
Note(s):
Detail may not add to total because of rounding. In FYs 2020 and 2021, a series of supplemental appropriations bills were passed, starting in March 2020, in response to the COVID-19 pandemic: the Coronavirus Preparedness and Response Supplemental Appropriations Act, 2020 (H.R. 6074, 6 March 2020); the Families First Coronavirus Response Act (H.R. 6201, 18 March 2020); the Coronavirus Aid, Relief, and Economic Security Act (H.R. 748, 27 March 2020); the Paycheck Protection Program and Health Care Enhancement Act (H.R. 266, 24 April 2020); the added stimulus component of the Consolidated Appropriations Act, 2021 (H.R. 133, 27 December 2020); and the American Rescue Plan Act (H.R. 1319, 11 March 2021). Obligations for science and engineering support funded through these acts are collectively termed here as stimulus funding.
Source(s):
National Center for Science and Engineering Statistics, Survey of Federal Science and Engineering Support to Universities, Colleges, and Nonprofit Institutions, FY 2020.
S&E Obligations to All Universities and Colleges
Federal S&E support to higher education institutions came from 10 federal departments and 7 independent agencies. This support is broken out into six categories (see definitions in “Data Sources, Limitations, and Availability”): R&D; R&D plant; facilities and equipment for instruction in S&E; fellowships, traineeships, and training grants (FTTGs); general support for S&E; and other S&E activities. Twenty higher education institutions receiving the largest amounts of federal S&E support accounted for 36% of all S&E support obligations by the federal government for universities and colleges (table 2). Of the $14.1 billion obligated to these 20 academic institutions to support S&E activities, 95% was for R&D, 4% was for FTTGs, and less than 1% was for each of the remaining four S&E categories. These shares differ slightly from those for all other academic institutions. Of the $25.1 billion obligated to all other academic institutions, 92% was for R&D, 5% was for FTTGs, slightly more than 1% was for other S&E activities and R&D plant, and less than 1% was for facilities and equipment for instruction in S&E and for general support for S&E.
Federal obligations for science and engineering to all higher education institutions, ranked by total amount received, by type of activity: FY 2020
S&E = science and engineering.
Note(s):
Detail may not add to total because of rounding. Institution order is based on total actual dollars received before amounts are rounded.
Source(s):
National Center for Science and Engineering Statistics, Survey of Federal Science and Engineering Support to Universities, Colleges, and Nonprofit Institutions, FY 2020.
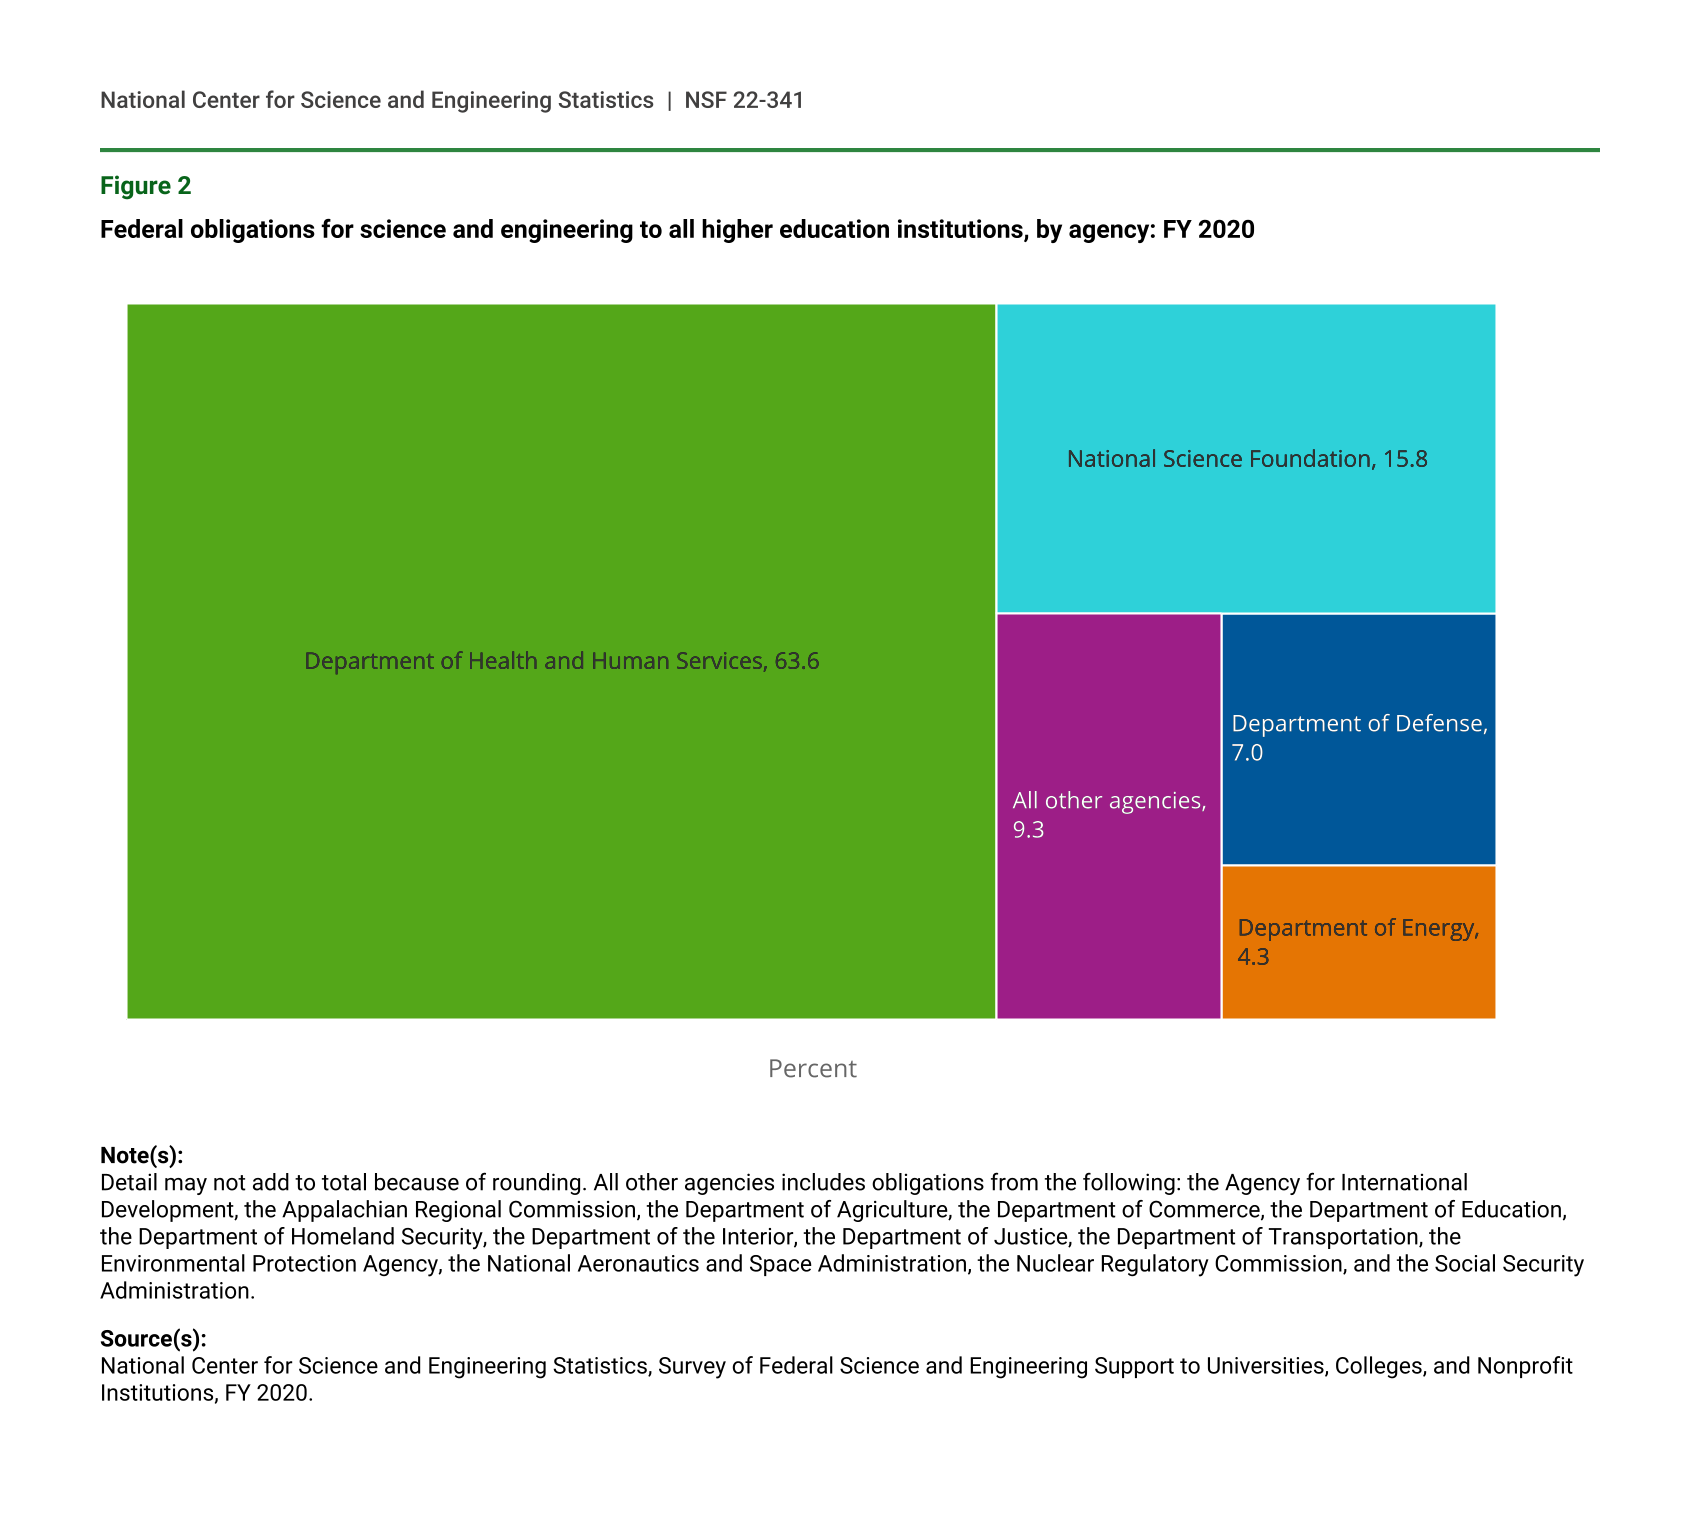
Four federal agencies accounted for 91% of all S&E support to higher education institutions in FY 2020 (figure 2): the Department of Health and Human Services (HHS), which includes the National Institutes of Health ($24.9 billion); NSF ($6.2 billion); the Department of Defense (DOD) ($2.8 billion); and the Department of Energy ($1.7 billion). Because obligations for R&D are by far the single largest component of total S&E support, these same four agencies accounted for 91% of all federal R&D obligations to the academic sector.
Federal obligations for science and engineering to all higher education institutions, by agency: FY 2020
| Agency | Percent |
|---|---|
| Department of Defense | 7.0 |
| Department of Energy | 4.3 |
| Department of Health and Human Services | 63.6 |
| National Science Foundation | 15.8 |
| All other agencies | 9.3 |
Note(s):
Detail may not add to total because of rounding. All other agencies includes obligations from the following: the Agency for International Development, the Appalachian Regional Commission, the Department of Agriculture, the Department of Commerce, the Department of Education, the Department of Homeland Security, the Department of the Interior, the Department of Justice, the Department of Transportation, the Environmental Protection Agency, the National Aeronautics and Space Administration, the Nuclear Regulatory Commission, and the Social Security Administration.
Source(s):
National Center for Science and Engineering Statistics, Survey of Federal Science and Engineering Support to Universities, Colleges, and Nonprofit Institutions, FY 2020.
S&E Obligations to Selected Types of Minority-Serving Institutions
In FY 2020, North Carolina A&T State University maintained its position as the primary recipient of federal obligations for S&E activities among all historically Black colleges and universities (HBCUs), a position it has held since FY 2016. Between FY 2011 and FY 2015, Morehouse School of Medicine was the largest HBCU recipient of federal S&E obligations. The University of Texas, Austin was the leading recipient of federal S&E support among high-Hispanic-enrollment institutions (HHEs) in FY 2020. The University of California San Diego was the largest recipient among HHEs in FY 2019. However, due to changes in enrollment, it was not classified as an HHE institution in FY 2020. Among tribal colleges and universities, Salish Kootenai College was the leading recipient of federal S&E support in FY 2020.
Historically Black Colleges and Universities
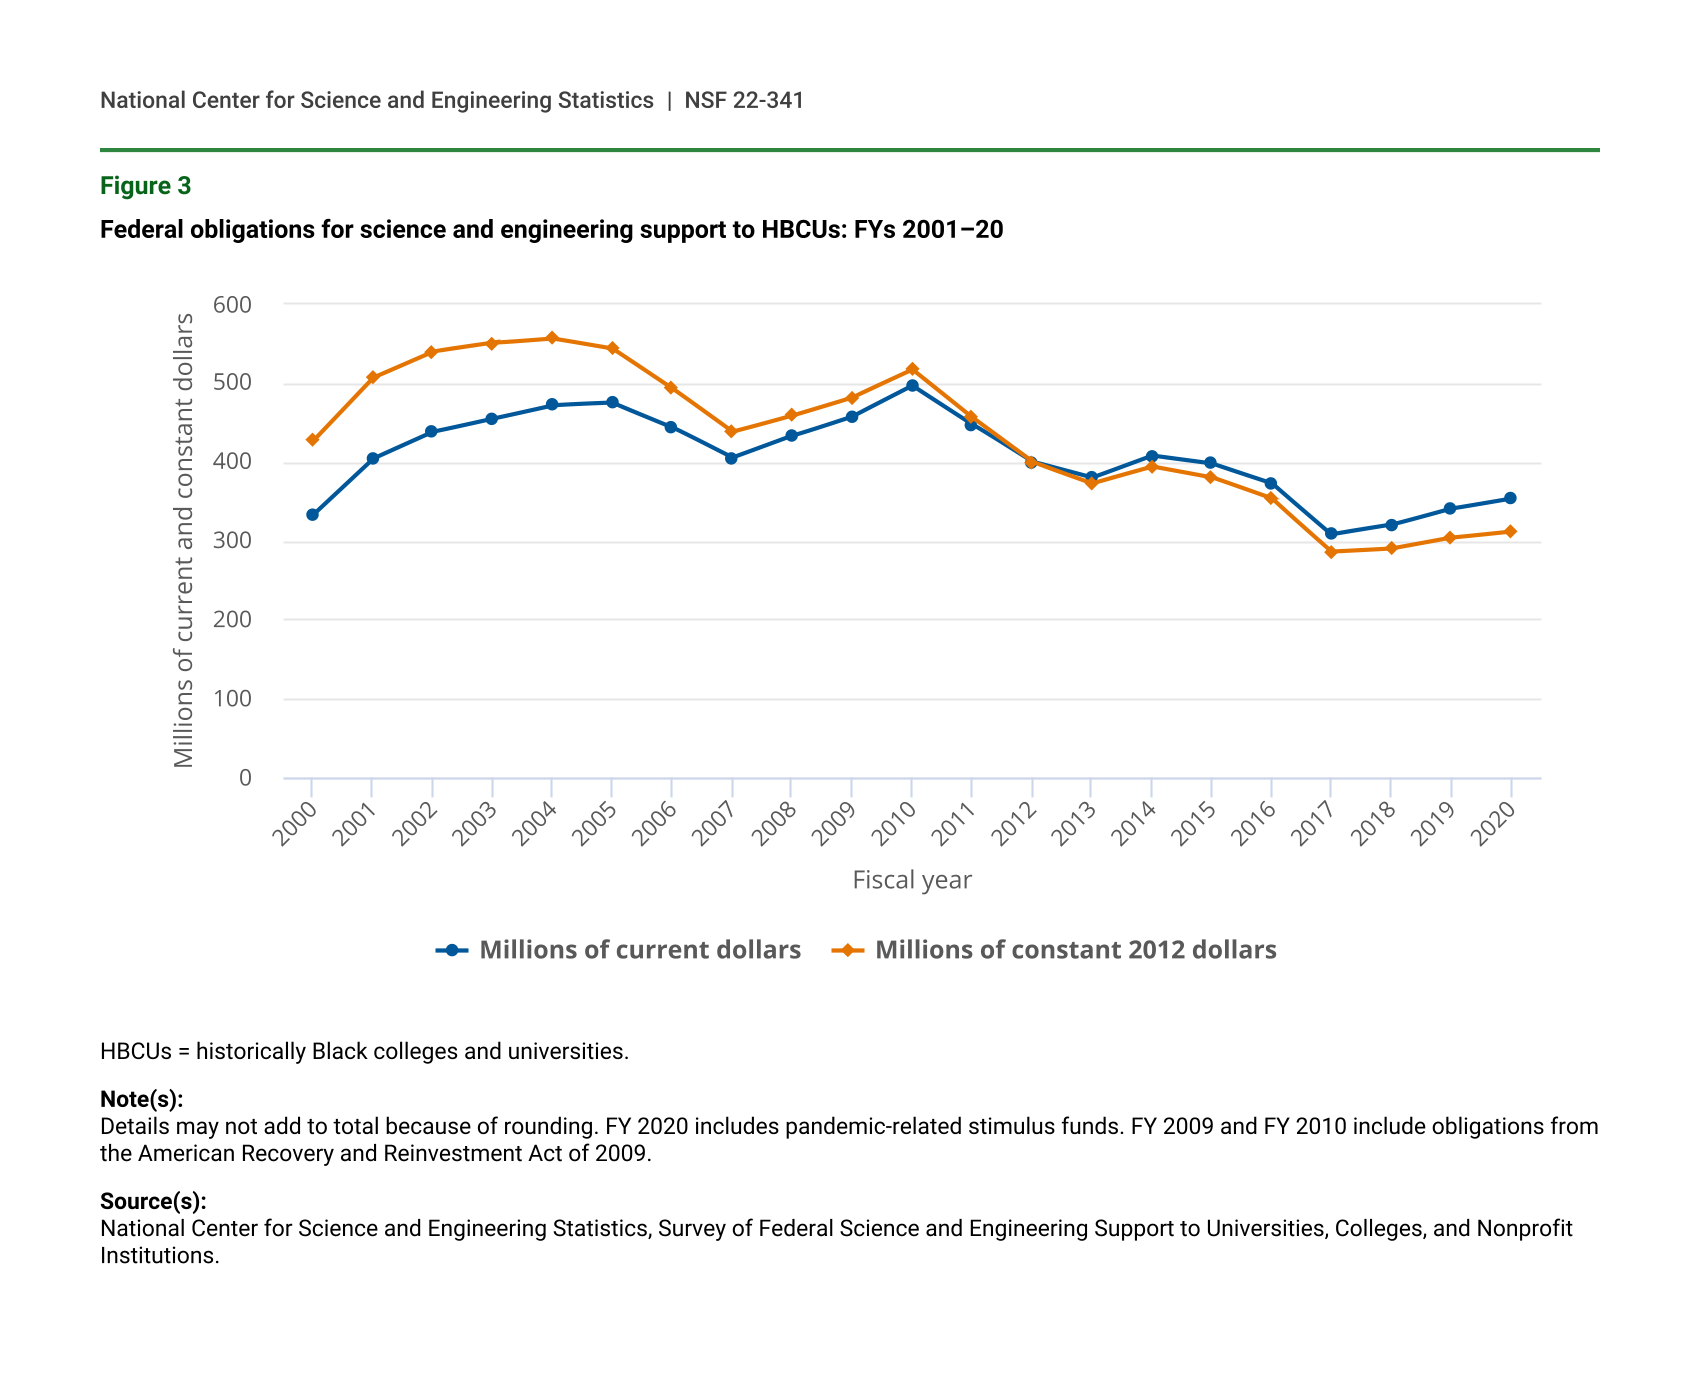
Sixty-three of the 101 HBCUs received federal obligations for S&E activities in FY 2020, totaling $354 million (figure 3). FY 2020 marked the third consecutive year for increased federal S&E support to HBCUs. When adjusted for inflation, the $312 million in S&E support to HBCUs in FY 2020 is well off the high of $557 million in FY 2004. Despite these increases in the past 3 fiscal years, total federal obligations for S&E to HBCUs in FY 2020 constitute 0.9% of all federal S&E obligations to all institutions of higher education.
Federal obligations for science and engineering support to HBCUs: FYs 2001–20
| Fiscal year | Millions of current dollars | Millions of constant 2012 dollars |
|---|---|---|
| 2000 | 333 | 427 |
| 2001 | 404 | 507 |
| 2002 | 438 | 540 |
| 2003 | 455 | 551 |
| 2004 | 472 | 557 |
| 2005 | 475 | 544 |
| 2006 | 444 | 493 |
| 2007 | 405 | 438 |
| 2008 | 433 | 459 |
| 2009 | 458 | 482 |
| 2010 | 497 | 517 |
| 2011 | 448 | 456 |
| 2012 | 400 | 400 |
| 2013 | 380 | 373 |
| 2014 | 408 | 394 |
| 2015 | 398 | 380 |
| 2016 | 373 | 353 |
| 2017 | 308 | 286 |
| 2018 | 320 | 290 |
| 2019 | 341 | 304 |
| 2020 | 354 | 312 |
HBCUs = historically Black colleges and universities.
Note(s):
Details may not add to total because of rounding. FY 2020 includes pandemic-related stimulus funds. FY 2009 and FY 2010 include obligations from the American Recovery and Reinvestment Act of 2009.
Source(s):
National Center for Science and Engineering Statistics, Survey of Federal Science and Engineering Support to Universities, Colleges, and Nonprofit Institutions.
The 15 HBCUs receiving the largest amounts of federal S&E support accounted for 65% of all S&E support obligations to HBCUs (table 3). These top 15 HBCUs also received 68% ($180 million) of all federal obligations for R&D to HBCUs, 60% ($41 million) of obligations for FTTGs, and 71% ($8 million) of other S&E activities. In total, the share of federal support for FTTGs was much larger in HBCUs (19%) than in all universities and colleges (4%). The relative emphasis on supporting research capacity reflects a longstanding approach by federal agencies to support research capacity to minority-serving institutions as well as R&D itself.
Federal obligations for science and engineering to HBCUs, ranked by total amount received, by type of activity: FY 2020
HBCUs = historically Black colleges and universities; S&E = science and engineering.
Note(s):
Detail may not add to total because of rounding. Institution order is based on total actual dollars received before amounts are rounded.
Source(s):
National Center for Science and Engineering Statistics, Survey of Federal Science and Engineering Support to Universities, Colleges, and Nonprofit Institutions, FY 2020.
High-Hispanic-Enrollment Institutions
HHEs received $3.2 billion in federal obligations for S&E support in FY 2020 (table 4). Federal support to HHEs for R&D amounted to $2.9 billion, or 91% of total federal S&E support to HHEs. By comparison, R&D accounted for 75% of the S&E total obligations to HBCUs and for 93% of federal S&E support to all higher education institutions. FTTG support to HHEs accounted for 6% of their S&E total. However, among “all other HHEs”—that is, HHEs other than the top 20 HHEs in terms of overall S&E support—their share of federal S&E support for FTTGs was 15%, which was greater than the share of federal support for FTTGs among all universities and colleges (4%).
Federal obligations for science and engineering to high-Hispanic-enrollment institutions, ranked by total amount received, by type of activity: FY 2020
HHEs = high-Hispanic-enrollment institutions; S&E = science and engineering.
Note(s):
Detail may not add to total because of rounding. Institution order is based on total actual dollars received before amounts are rounded; institutions receiving the same amount of actual dollars are listed alphabetically. Only those agencies that had obligations in the variables represented by this table appear in the table. This list of HHE institutions includes those institutions of higher education whose full-time equivalent (FTE) enrollment of undergraduate students is at least 25% Hispanic, according to fall 2020 enrollment data self-reported by the institutions in the Integrated Postsecondary Education Data System survey conducted by the National Center for Education Statistics (NCES). NCES determined FTE enrollment by calculating that approximately three part-time students are equivalent to one full-time student.
Source(s):
National Center for Science and Engineering Statistics, Survey of Federal Science and Engineering Support to Universities, Colleges, and Nonprofit Institutions, FY 2020.
The majority (53%) of the FY 2020 federal S&E support to HHEs came from HHS, with nearly $1.7 billion in obligations. NSF was the second-leading federal agency to obligate funding to support S&E at HHEs, with $764 million (24%).
Tribal Colleges and Universities
Federal agency obligations to tribal colleges and universities totaled $18 million in FY 2020 (table 5). Of the $18 million in federal obligations for S&E to tribal colleges and universities in FY 2020, R&D amounted to $7 million, or 41% of all S&E support, whereas FTTGs totaled $10 million, or 55% of total S&E support. Similar to HBCUs, the distribution of types of S&E support illustrates how relatively larger shares of federal S&E obligations to tribal colleges and universities are for building research and training capacity within these institutions through FTTGs and other activities, compared with these obligations to all other institutions.
Federal obligations for science and engineering to tribal colleges and universities, ranked by total amount received, by activity: FY 2020
S&E = science and engineering.
Note(s):
Detail may not add to total because of rounding. Institution order is based on total actual dollars received before amounts are rounded. Only those agencies that had obligations in the variables represented by this table appear in the table. The list of tribal colleges and universities is from the White House Initiative on American Indian and Alaska Native Education (see https://sites.ed.gov/whiaiane/tribes-tcus/tribal-colleges-and-universities/). In accordance with Executive Order No. 13270, "Tribal Colleges and Universities," as extended by Executive Order No. 13316, the list includes all of the colleges cited in section 532 of the Equity in Educational Land-Grant Status Act of 1994 (7 U.S.C. 301 note), any other institution that qualifies for funding under the Tribally Controlled Community College Assistance Act of 1978 (25 U.S.C. 1801 et seq.), and Diné College, which is authorized in the Navajo Community College Assistance Act of 1978, Public Law 95-471, title II (25 U.S.C. 640a note). The statutory definition of American Indian tribally controlled colleges and universities, to which the Higher Education Act refers at §316(b)(3), 20 U.S.C. 1059c(b)(3), is in section 2(a)(4) of the Tribally Controlled College and University Assistance Act of 1978, 25 U.S.C. 1801(a)(4).
Source(s):
National Center for Science and Engineering Statistics, Survey of Federal Science and Engineering Support to Universities, Colleges, and Nonprofit Institutions, FY 2020.
NSF continues to be the leading agency to support S&E activities within tribal colleges and universities with obligations of $17 million or 93% of all federal S&E support. HHS followed with $1 million.
Data Sources, Limitations, and Availability
Data were obtained from the 18 agencies (10 federal departments and 8 independent agencies) that made S&E obligations to academic and nonprofit institutions in FY 2020, as reported to the Federal S&E Support Survey. The survey collects federal S&E support data by funding agency, individually named institution, type of activity, type of institution, and geographic location.
The six funding categories of federal S&E support are defined as follows:
- Research and experimental development (R&D) includes all direct, indirect, incidental, or related costs resulting from or necessary to perform R&D by private individuals and organizations under grant, contract, or cooperative agreement.
- R&D plant includes all projects whose principal purpose is to provide support for construction, acquisition, renovation, modification, repair, or rental of facilities, land, works, or fixed equipment for use in scientific or engineering R&D.
- Facilities and equipment for S&E instruction includes all programs whose principal purpose is to provide support for construction, acquisition, renovation, modification, repair, or rental of facilities, land, works, or equipment for use in instruction in S&E.
- Fellowships, traineeships, and training grants (FTTGs) includes all fellowship, traineeship, and training grant programs that are directed primarily toward the development and maintenance of the scientific workforce.
- General support for S&E includes funds used for scientific projects and support for activities within a specified discipline; explicit purpose is not specified.
- Other S&E activities includes all academic S&E obligations that cannot be assigned elsewhere and activities in support of technical conferences, teacher institutes, and programs aimed at increasing precollege and undergraduate students' scientific knowledge.
The full set of data tables on the FY 2020 Federal S&E Support Survey are available at https://www.nsf.gov/statistics/srvyfedsupport/. Data for the survey are available in NCSES's interactive data tool (https://ncsesdata.nsf.gov/ids/fss). For more information, please contact the survey manager.
Notes
1Gross domestic product implicit price deflators were used to convert current to constant 2012 dollars. Data on calendar year, historical figures, 2000–20, can be found in Bureau of Economic Analysis, National Economic Accounts, Gross Domestic Product, accessed 6 November 2021.
2In FYs 2020 and 2021, a series of supplemental appropriations bills were passed, starting in March 2020, in response to the COVID-19 pandemic: the Coronavirus Preparedness and Response Supplemental Appropriations Act, 2020 (H.R. 6074, 6 March 2020); the Families First Coronavirus Response Act (H.R. 6201, 18 March 2020); the Coronavirus Aid, Relief, and Economic Security Act (H.R. 748, 27 March 2020); the Paycheck Protection Program and Health Care Enhancement Act (H.R. 266, 24 April 2020); the added stimulus component of the Consolidated Appropriations Act, 2021 (H.R. 133, 27 December 2020); and the American Rescue Plan Act (H.R. 1319, 11 March 2021). Obligations for S&E support funded through these acts are collectively termed here as stimulus funding.
3Details available in the full set of data tables: table 8.
4Details available in the full set of data tables: table 21.
5Details available in the full set of data tables: table 26.
6HHEs are those institutions whose full-time equivalent (FTE) enrollment of undergraduate students is at least 25% Hispanic, according to fall 2020 enrollment data self-reported by the institutions in the Integrated Postsecondary Education Data System survey conducted by the National Center for Education Statistics (NCES). NCES determined FTE enrollment by calculating that approximately three part-time students are equivalent to one full-time student.
7Details available in the full set of data tables: table 27.
8The Higher Education Act of 1965, as amended, defines an HBCU as “any historically Black college or university that was established prior to 1964, whose principal mission was, and is, the education of Black Americans, and that is accredited by a nationally recognized accrediting agency or association determined by the Secretary (of Education) to be a reliable authority as to the quality of training offered or is, according to such an agency or association, making reasonable progress toward accreditation.”
9Details available in the full set of data tables: table 26.
10The list of tribal colleges and universities is from the White House Initiative on American Indian and Alaska Native Education (see https://sites.ed.gov/whiaiane/tribes-tcus/tribal-colleges-and-universities/). In accordance with Executive Order No. 13270, “Tribal Colleges and Universities,” as extended by Executive Order No. 13316, the list includes all of the colleges cited in section 532 of the Equity in Educational Land-Grant Status Act of 1994 (7 U.S.C. 301 note), any other institution that qualifies for funding under the Tribally Controlled Community College Assistance Act of 1978 (25 U.S.C. 1801 et seq.), and Diné College, which is authorized in the Navajo Community College Assistance Act of 1978, Public Law 95-471, title II (25 U.S.C. 640a note). The statutory definition of American Indian tribally controlled colleges and universities, to which the Higher Education Act refers at §316(b)(3), 20 U.S.C. 1059c(b)(3), is in section 2(a)(4) of the Tribally Controlled College and University Assistance Act of 1978, 25 U.S.C. 1801(a)(4).
11Details available in the full set of data tables: table 27.
Suggested Citation
National Center for Science and Engineering Statistics (NCSES). 2022. Federal Science and Engineering Support to Higher Education Increased 3% in FY 2020. NSF 22-341. Alexandria, VA: National Science Foundation. Available at https://ncses.nsf.gov/pubs/nsf22341/.
Contact Us
NCSES
National Center for Science and Engineering Statistics
Directorate for Social, Behavioral and Economic Sciences
National Science Foundation
2415 Eisenhower Avenue, Suite W14200
Alexandria, VA 22314
Tel: (703) 292-8780
FIRS: (800) 877-8339
TDD: (800) 281-8749
E-mail: ncsesweb@nsf.gov
NSF 22-341
|September 20, 2022