 An official website of the United States government

Universities Report Largest Growth in Federally Funded R&D Expenditures since FY 2011
Research and development spending by academic institutions totaled $89.9 billion in FY 2021, an increase of $3.4 billion (4.0%) from FY 2020 (table 1). R&D expenditures funded from federal sources accounted for $3.0 billion of the total increase. Federally funded R&D expenditures had not increased by $3 billion or more since FY 2011, when the American Recovery and Reinvestment Act of 2009 supplemented the flow of R&D support dollars. University-funded R&D expenditures were 2.1% greater ($459 million) than in FY 2020 due largely to several institutions’ improved accounting of internally funded R&D through new financial systems and reorganizations. Universities reported $149 million more in R&D expenditures funded from state and local governments, an increase of 3.2% from FY 2020. R&D expenditures funded by nonprofit organizations (-2.6%, -$150 million) and businesses (-1.3%, -$68 million) decreased, while R&D funded by all other sources was virtually flat (0.2% increase, $6 million increase). The data discussed in this report are from the Higher Education Research and Development (HERD) Survey, sponsored by the National Center for Science and Engineering Statistics (NCSES) within the National Science Foundation (NSF). For more information on the survey, see “Data Sources, Limitations, and Availability.”
Higher education R&D expenditures, by source of funds: FYs 2010–21
Note(s):
Because of rounding, detail may not add to total. Includes all institutions surveyed in the fiscal years shown.
Source(s):
National Center for Science and Engineering Statistics, Higher Education Research and Development Survey.
R&D Expenditures, by Federal Funding Sources
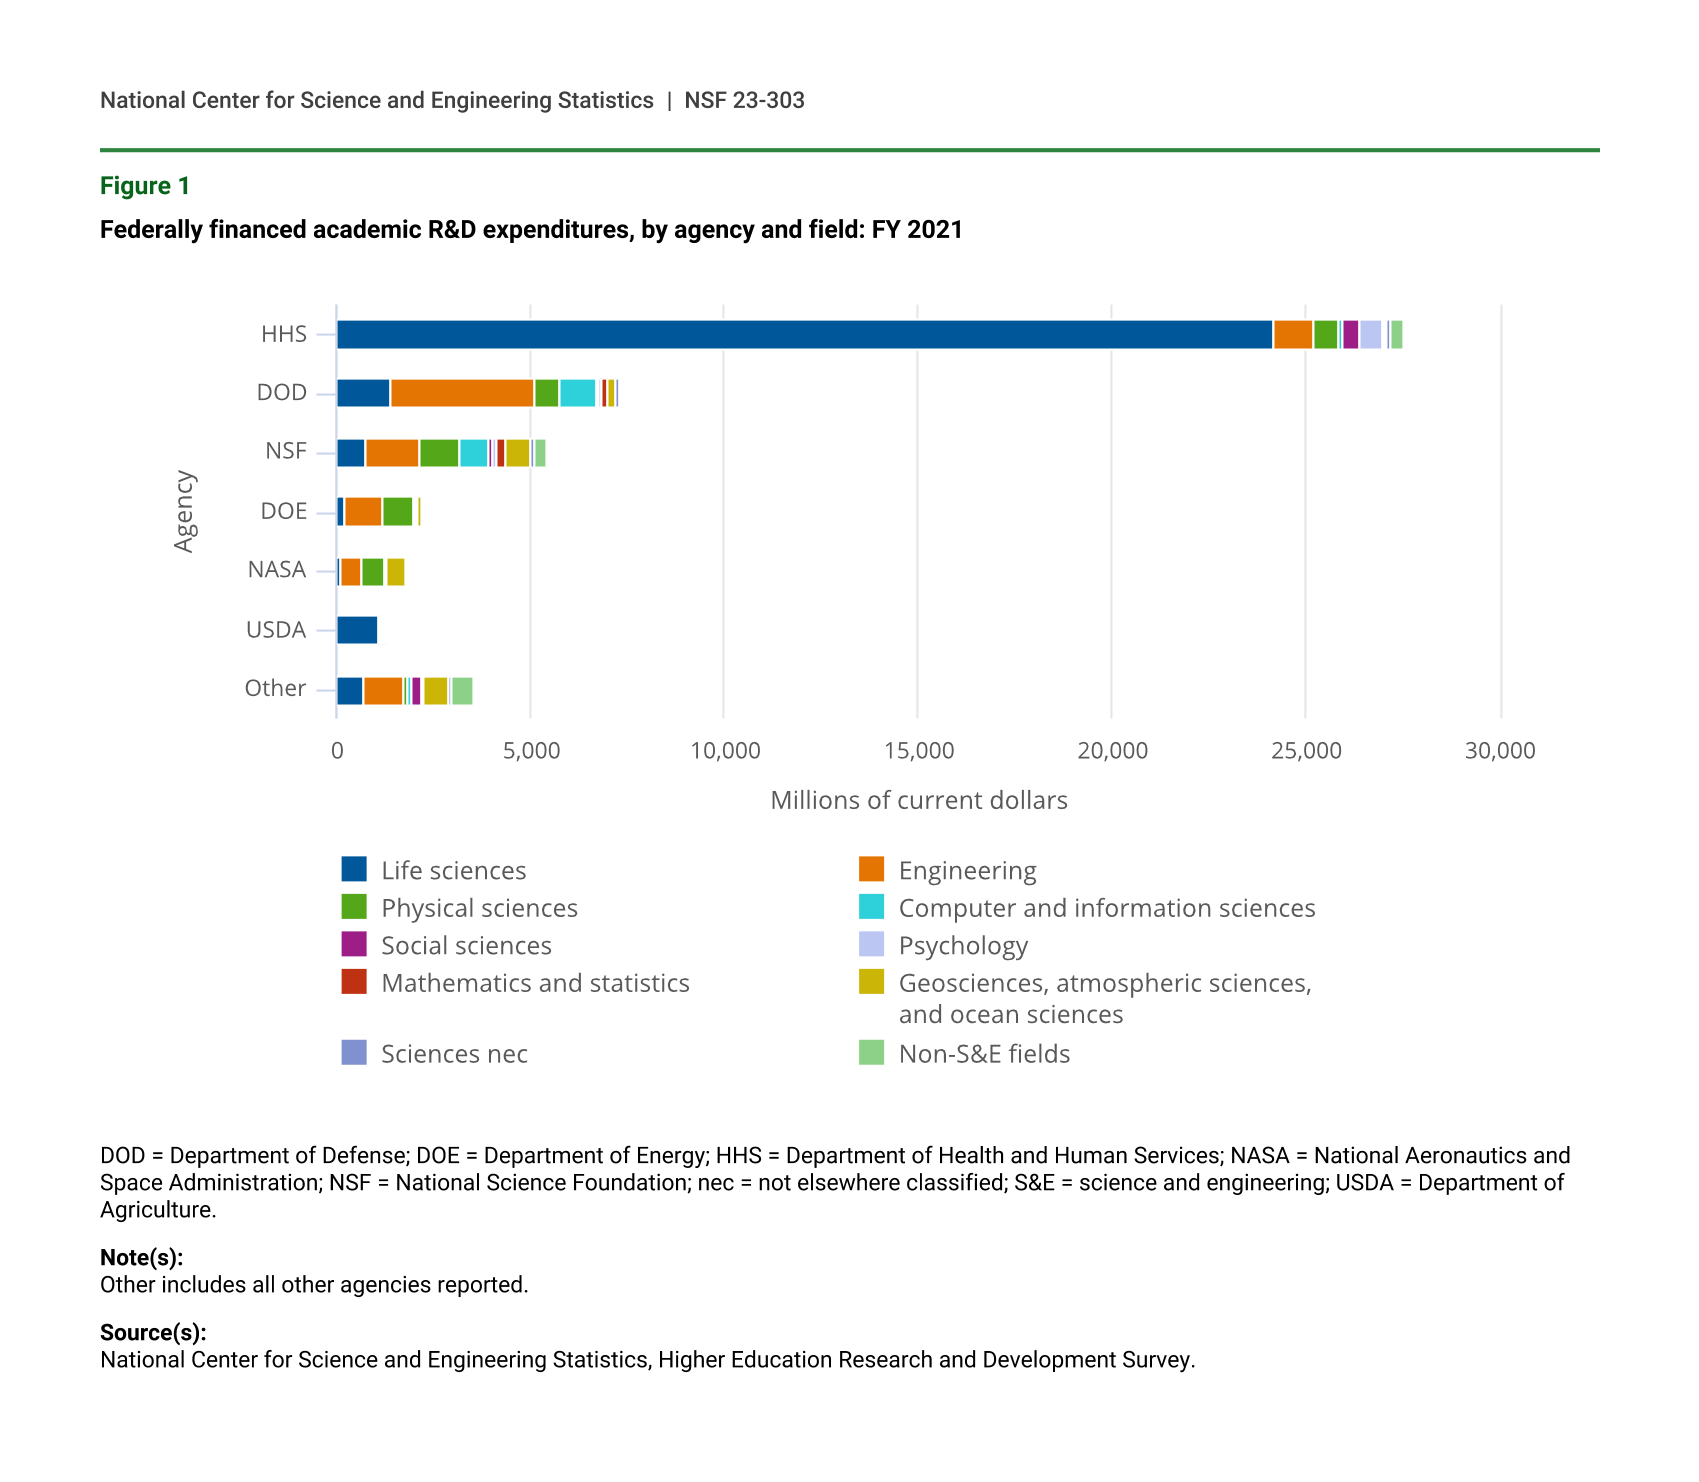
Federally funded R&D at universities surpassed $49 billion in FY 2021, which accounted for 55% of total R&D (table 2). This is slightly higher than the 53% share from FY 2018 to FY 2020. The largest federal source of R&D expenditures for higher education institutions was the Department of Health and Human Services (HHS)—which includes the National Institutes of Health—at $27.5 billion, up $2.1 billion from FY 2020. HHS accounted for 56% of FY 2021 federally funded R&D and 71% of the overall FY 2021 increase in federally funded R&D. HHS funds supported over $24 billion in life sciences R&D, which notably includes biological and biomedical sciences and health sciences (figure 1). HHS funds also supported more than $1 billion in engineering R&D expenditures. The Department of Defense (DOD) ($7.4 billion total, $285 million increase) and the Department of Energy (DOE) ($2.2 billion total, $180 million increase) were the only other agencies where funded R&D expenditures increased by more than $100 million in FY 2021. These two agencies also supported significant engineering R&D in FY 2021: $3.7 billion funded by DOD and $960 million funded by DOE. R&D expenditures funded by the Department of Agriculture (USDA) ($1.3 billion total, $54 million increase) were overwhelmingly devoted to life sciences ($1.1 billion), which includes agricultural sciences as well as natural resources and conservation. The National Aeronautics and Space Administration (NASA) ($1.8 billion total, $11 million increase) contributed to the growth with $560 million funding in engineering R&D and $453 million funding in geosciences, atmospheric sciences, and ocean sciences R&D. R&D expenditures funded by the National Science Foundation ($5.4 billion total) decreased $5 million from FY 2020, while all other federal sources ($3.5 billion total) increased 11% or $345 million. NSF funded over a billion dollars of R&D in both engineering ($1.4 billion) and physical sciences ($1.1 billion).
Higher education R&D expenditures, by source of funds: FYs 2011–21
DOD = Department of Defense; DOE = Department of Energy; HHS = Department of Health and Human Services; NASA = National Aeronautics and Space Administration; NSF = National Science Foundation; USDA = Department of Agriculture.
Note(s):
Because of rounding, detail may not add to total. Beginning in FY 2012, institutions reporting less than $1 million in total R&D expenditures completed a shorter version of the survey questionnaire, and those totals are not reflected here. Total expenditures from institutions reporting less than $1 million in R&D in FY 2021 was $149 million. Total federally funded R&D for these institutions was $85 million.
Source(s):
National Center for Science and Engineering Statistics, Higher Education Research and Development Survey.
Federally financed academic R&D expenditures, by agency and field: FY 2021
| Agency | Life sciences | Engineering | Physical sciences | Computer and information sciences | Social sciences | Psychology | Mathematics and statistics | Geosciences, atmospheric sciences, and ocean sciences | Sciences nec | Non-S&E fields |
|---|---|---|---|---|---|---|---|---|---|---|
| HHS | 24,181.1 | 1,028.8 | 642.9 | 139.4 | 407.0 | 584.4 | 68.1 | 53.9 | 104.2 | 322.5 |
| DOD | 1,421.7 | 3,703.9 | 652.4 | 928.4 | 69.7 | 53.1 | 152.7 | 236.1 | 83.1 | 62.4 |
| NSF | 734.8 | 1,391.0 | 1,070.9 | 707.4 | 154.1 | 80.8 | 205.6 | 653.9 | 96.9 | 315.2 |
| DOE | 239.6 | 959.7 | 794.7 | 57.2 | 10.7 | 1.2 | 9.3 | 111.5 | 27.2 | 7.3 |
| NASA | 89.6 | 560.1 | 588.8 | 23.1 | 17.4 | 18.6 | 2.9 | 453.1 | 6.1 | 8.9 |
| USDA | 1,068.9 | 75.3 | 6.3 | 8.7 | 58.0 | 4.8 | 4.8 | 32.9 | 5.3 | 37.4 |
| Other | 717.3 | 996.1 | 96.4 | 130.5 | 238.9 | 69.7 | 32.4 | 603.8 | 51.3 | 611.1 |
DOD = Department of Defense; DOE = Department of Energy; HHS = Department of Health and Human Services; NASA = National Aeronautics and Space Administration; NSF = National Science Foundation; nec = not elsewhere classified; S&E = science and engineering; USDA = Department of Agriculture.
Note(s):
Other includes all other agencies reported.
Source(s):
National Center for Science and Engineering Statistics, Higher Education Research and Development Survey.
R&D Expenditures, by Field
R&D expenditures in all science fields combined increased $2.7 billion (4.1%) in FY 2021, reaching $70.3 billion (table 3). Engineering R&D expenditures ($14.3 billion total) increased 4.3% ($586 million) and non-science and engineering R&D ($5.1 billion total) increased 1.8% ($90 million). R&D expenditures in the life sciences subfields of health sciences (up $1.9 billion to $29.9 billion) and biological and biomedical sciences (up $793 million to $16.6 billion) accounted for 78% of the total growth in FY 2021. This share is substantially greater than in recent years: FY 2020 (39%), FY 2019 (53%), and FY 2018 (67%).
R&D expenditures in three major science fields decreased in FY 2021: social sciences (down 3.8%), mathematics and statistics (down 3.4%), and psychology (down 2.6%). R&D in three other fields grew only slightly in FY 2021: physical sciences (up 1.2%); computer and information sciences (up 0.9%); and geosciences, atmospheric sciences, and ocean sciences (up 0.4%).
Higher education R&D expenditures, by R&D field: FYs 2020–21
nec = not elsewhere classified; S&E = science and engineering.
Note(s):
This table includes only institutions reporting $1 million or more in total R&D expenditures in FY 2020. Institutions reporting less than $1 million in total R&D expenditures in FY 2020 completed a shorter version of the survey form in FY 2021, and that form did not collect R&D expenditures by detailed field. Total expenditures from institutions reporting less than $1 million in R&D in FY 2021 was $149 million.
Source(s):
National Center for Science and Engineering Statistics, Higher Education Research and Development Survey.
Top University Research Performers
The top 30 institutions in terms of R&D expenditures accounted for 42% of the total spent on R&D within the higher education sector in FY 2021, which is consistent with the preceding years (table 4). Twenty-four institutions reported at least $1 billion in R&D during FY 2021. Nineteen institutions crossed that reporting threshold in FY 2019. Sixteen of the top 30 were public institutions, accounting for $20.2 billion in total R&D expenditures, and 14 were private institutions accounting for $17.9 billion. Institutions with medical schools were well-represented in this group; 27 of the top 30 reported medical school R&D expenditures.
Vanderbilt University and Vanderbilt University Medical Center moved onto the list of top 30 universities with the highest R&D totals in FY 2021, at number 24, following accounting changes at the institution. The University of California, Berkeley moved off the list. Similarly, Ohio State University began more effectively accounting for internally funded R&D through a new financial system and other organizational changes. Consequently, Ohio State University moved from number 24 in FY 2020 to number 12 in FY 2021. The University of Minnesota moved down 2 positions to number 22, although their R&D total increased by $31 million. The Massachusetts Institute of Technology moved down 6 positions to number 29 after reporting $39 million less in FY 2021 R&D.
Thirty institutions reporting the largest FY 2021 R&D expenditures in all fields: FYs 2019–21
a Johns Hopkins University includes the Applied Physics Laboratory, with $1,950 million in total R&D expenditures in FY 2021.
b University of Maryland includes expenditures from University of Maryland, Baltimore and University of Maryland, College Park campuses. In FY 2019, the two campuses began reporting as one research unit to reflect their new strategic partnership. This relationship was codified through the University of Maryland Strategic Partnership Act passed by the Maryland General Assembly in 2016. Prior to 2019, both campuses reported to the Higher Education Research and Development Survey as separate institutions.
Note(s):
Because of rounding, detail may not add to total. This table reflects the leading 30 institutions for FY 2021; the institutions listed may not be in the top 30 of prior fiscal years.
Source(s):
National Center for Science and Engineering Statistics, Higher Education Research and Development Survey.
Data Sources, Limitations, and Availability
The higher education R&D expenditures data were collected from a census of 910 universities and colleges that grant a bachelor’s degree or higher and expended at least $150,000 in R&D in FY 2020. To reduce respondent burden, the HERD Survey requests abbreviated data from institutions reporting less than $1 million in R&D expenditures during the previous fiscal year. Except for the totals reported in table 1, all other totals shown in this InfoBrief exclude expenditures from the 262 institutions that completed a short-form version of the survey. The institutions completing the short-form survey accounted for $149 million (0.2%) of total higher education R&D expenditures in FY 2021.
The fiscal year referred to throughout this report is the academic fiscal year. For most academic institutions, FY 2021 represents 1 July 2020 through 30 June 2021.
The amounts reported include all funds expended for activities specifically organized to produce research outcomes and sponsored by an outside organization or separately accounted for using institution funds. R&D expenditures at university-administered federally funded research and development centers (FFRDCs) are collected in a separate survey, the FFRDC Research and Development Survey, available at https://www.nsf.gov/statistics/ffrdc/.
The full set of data tables and technical information from this survey are available at https://ncses.nsf.gov/pubs/nsf23304.
Notes
1FY 2011 was the peak year for higher education R&D expenditures funded by the American Recovery and Reinvestment Act of 2009. For more details on those expenditures, see the NCSES InfoBrief Higher Education R&D Expenditures Resume Slow Growth in FY 2013 (https://www.nsf.gov/statistics/2015/nsf15314/), and table 12 in the HERD FY 2014 data tables (https://ncsesdata.nsf.gov/herd/2014/).
2For example, Ohio State University did not previously include all internally funded R&D expenditures, including those within their Health System and Comprehensive Cancer Center, which are primarily categorized as medical school R&D. All R&D is now organized under the Enterprise for Research, Innovation and Knowledge. The implementation of a new financial system, in addition to restructured internal organizations, allowed the university to identify previously unreported R&D expenditures. These changes contributed to the $278 million increase they reported in institutionally funded R&D in FY 2021.
Similarly, the Vanderbilt University Medical Center (VUMC) reported very low institutionally funded R&D in past years as part of the Vanderbilt University and VUMC HERD submission. VUMC’s new methodology captures non-sponsored R&D investments, funded institutionally, that are separately accounted for through R&D accounts. These changes contributed to the $115 million increase Vanderbilt University and VUMC reported in institutionally funded R&D in FY 2021.
3See table 3 in this InfoBrief for the full breakdown of all R&D fields and subfields.
4See table 10 in the Higher Education Research and Development: Fiscal Year 2021 (HERD21) data tables for expenditures by R&D field for FYs 2010–21.
5See HERD21: table 72, for R&D expenditures at institutions with a medical school and by institutional control.
6See endnote number 2.
Suggested Citation
Gibbons, MT; National Center for Science and Engineering Statistics (NCSES). 2022. Universities Report Largest Growth in Federally Funded R&D Expenditures since FY 2011. NSF 23-303. Alexandria, VA: National Science Foundation. Available at https://ncses.nsf.gov/pubs/nsf23303.
Contact Us
NCSES
National Center for Science and Engineering Statistics
Directorate for Social, Behavioral and Economic Sciences
National Science Foundation
2415 Eisenhower Avenue, Suite W14200
Alexandria, VA 22314
Tel: (703) 292-8780
FIRS: (800) 877-8339
TDD: (800) 281-8749
E-mail: ncsesweb@nsf.gov
NSF 23-303
|December 15, 2022