 An official website of the United States government

U.S. Nonprofits' R&D Performance Totaled $27 Billion in FY 2021
U.S. nonprofits spent an estimated $27.2 billion on research and experimental development (R&D) performed within their organizations in FY 2021 (table 1).
Total expenditures for R&D performed by nonprofit organizations, by source of funds and type of nonprofit organization: FY 2021
a Nonprofit organizations are classified using the 2017 North American Industry Classification System code that accounts for the majority of their payroll. This classification may differ from the National Taxonomy of Exempt Entities Core Codes system used by the Internal Revenue Service and National Center for Charitable Statistics.
Note(s):
These data exclude nonprofit universities and colleges and federally funded research and development centers administered by nonprofit organizations. Detail may not add to total because of rounding.
Source(s):
National Center for Science and Engineering Statistics and Census Bureau, Nonprofit Research Activities FY 2021 module of the 2022 Annual Business Survey.
Data in this InfoBrief are from the Nonprofit Research Activities (NPRA) FY 2021 module of the 2022 Annual Business Survey, conducted by the Census Bureau for the National Center for Science and Engineering Statistics (NCSES) within the National Science Foundation. It is the second collection of nonprofit R&D data by the Annual Business Survey and the continuation of an annual data series for this population.
Sources of Funding for Nonprofit R&D Performance
The largest funding source for nonprofit R&D performance was the federal government, contributing $11.6 billion, or 43%, of the total. Nonprofit organizations’ own internal funds were the next largest source at $7.5 billion, or 28%, of the total. For-profit businesses funded $3.0 billion (11%), nonprofit foundations contributed $1.7 billion (6%), and individual donors contributed $1.4 billion (5%). The remaining sources each contributed 2% or less to total nonprofit R&D performance.
There was variation in the distribution of funding sources across the different types of nonprofits (table 1). Science and technology organizations reported a much smaller proportion of their total R&D performance was internally funded (17% or $1.9 billion) than healthcare organizations (35% or $4.7 billion) and other nonprofits (40% or $972 million) did. On the other hand, science and technology organizations reported a much larger proportion of R&D funded by the federal government ($6.5 billion or 58%) than healthcare organizations ($4.7 billion or 34%) or all other nonprofits ($434 million or 18%) did.
Nonprofit R&D Performance by Type
Nonprofits reported that 44% ($11.9 billion) of their FY 2021 R&D performance was categorized as basic research and 37% ($10.0 billion) was applied research (table 2). The remaining 19% ($5.3 billion) was categorized as experimental development. A higher proportion of the federally funded R&D total was spent on applied research (44%) compared to the nonfederally funded R&D total (31%).
Total expenditures for R&D performed by nonprofit organizations, by type of R&D and source of funds: FY 2021
Note(s):
These data exclude nonprofit universities and colleges and federally funded research and development centers administered by nonprofit organizations. Detail may not add to total because of rounding.
Source(s):
National Center for Science and Engineering Statistics and Census Bureau, Nonprofit Research Activities FY 2021 module of the 2022 Annual Business Survey.
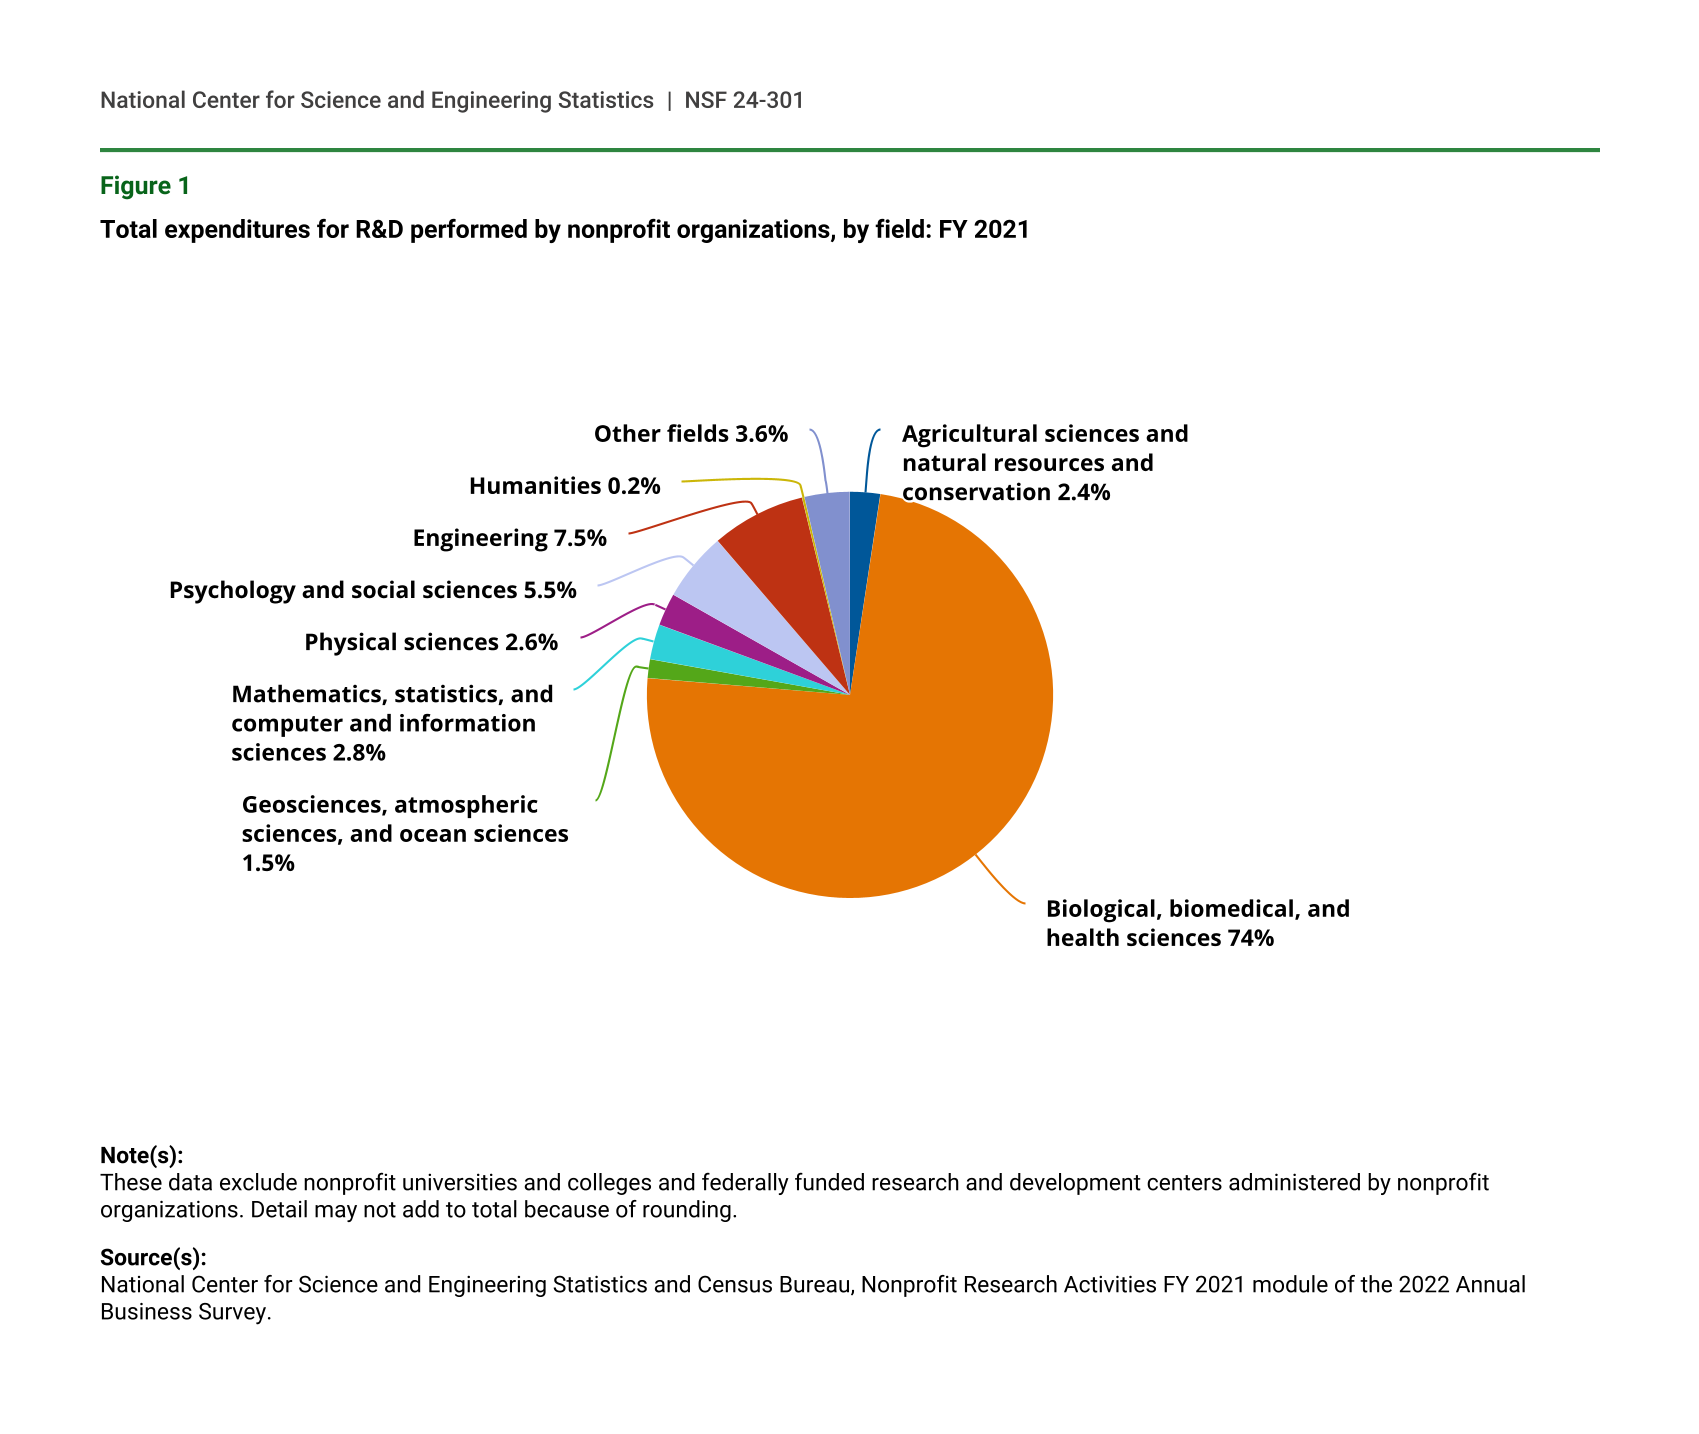
Nonprofit R&D Performance by Field
The vast majority (74%, or $20 billion) of FY 2021 nonprofit R&D spending was in biological, biomedical, and health sciences (figure 1). Nonprofits also spent 7.5% ($2.0 billion) on R&D within engineering fields. Another 5.5% ($1.5 billion) was devoted to psychology and social sciences R&D.
Total expenditures for R&D performed by nonprofit organizations, by field: FY 2021
| Field | Percent of R&D expenditures |
|---|---|
| Agricultural sciences and natural resources and conservation | 2.4 |
| Biological, biomedical, and health sciences | 74.0 |
| Geosciences, atmospheric sciences, and ocean sciences | 1.5 |
| Mathematics, statistics, and computer and information sciences | 2.8 |
| Physical sciences | 2.6 |
| Psychology and social sciences | 5.5 |
| Engineering | 7.5 |
| Humanities | 0.2 |
| Other fields | 3.6 |
Note(s):
These data exclude nonprofit universities and colleges and federally funded research and development centers administered by nonprofit organizations. Detail may not add to total because of rounding.
Source(s):
National Center for Science and Engineering Statistics and Census Bureau, Nonprofit Research Activities FY 2021 module of the 2022 Annual Business Survey.
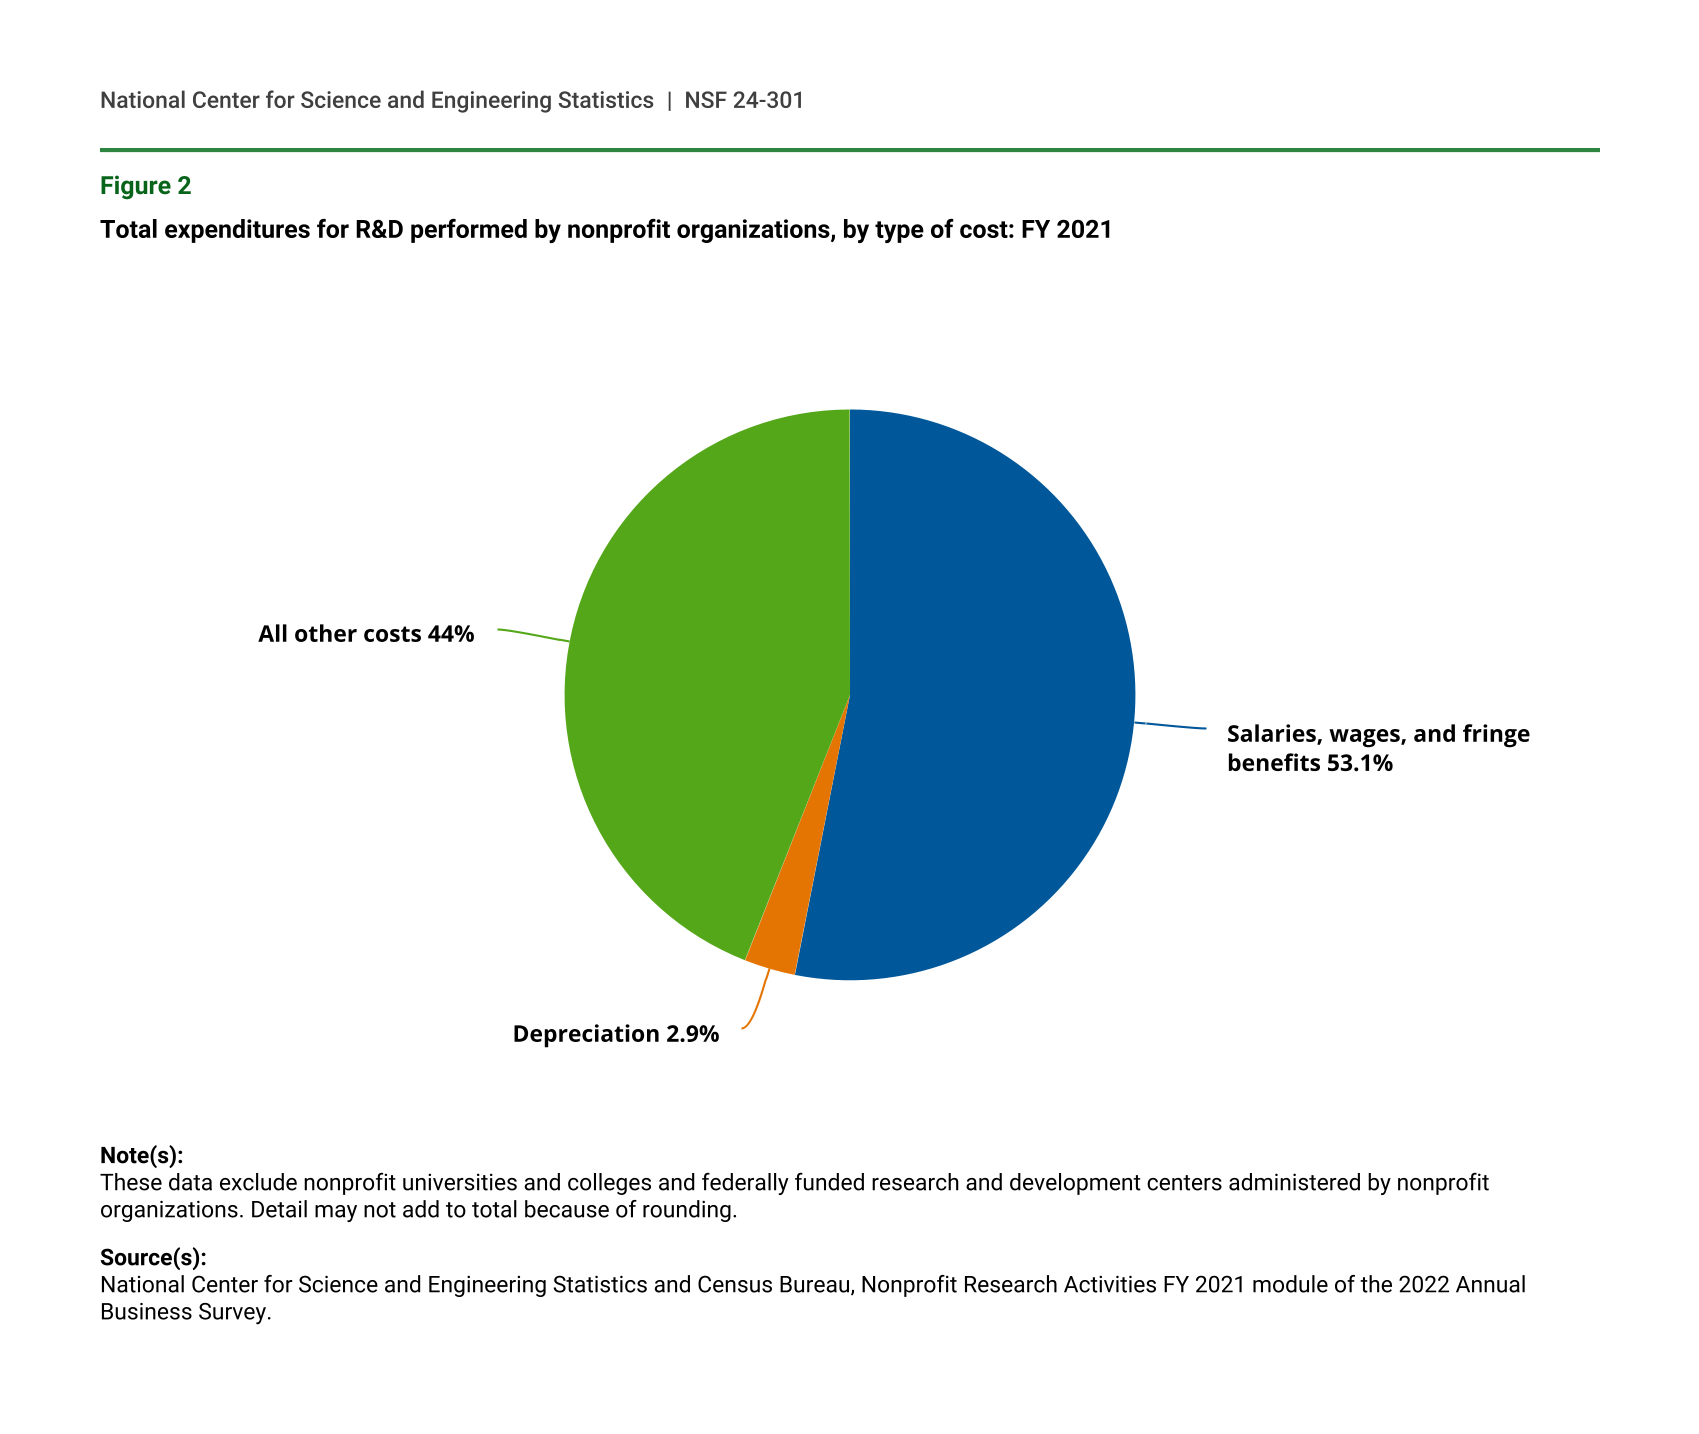
Nonprofit R&D Performance by Type of Cost
A new question added to the survey for FY 2021 requested R&D expenditures by type of cost. Over half (53%) of the total R&D expenditures was for salaries, wages, and fringe benefits of the employees working on the R&D (figure 2). Nearly 3% was spent on depreciation of tangible research assets, such as buildings or equipment, and amortization of intangible assets, such as patents. The remaining 44% was spent on all other costs, including administrative and overhead costs associated with research.
Total expenditures for R&D performed by nonprofit organizations, by type of cost: FY 2021
| Type of cost | Percent of R&D expenditures |
|---|---|
| Salaries, wages, and fringe benefits | 53.1 |
| Depreciation | 2.9 |
| All other costs | 44.0 |
Note(s):
These data exclude nonprofit universities and colleges and federally funded research and development centers administered by nonprofit organizations. Detail may not add to total because of rounding.
Source(s):
National Center for Science and Engineering Statistics and Census Bureau, Nonprofit Research Activities FY 2021 module of the 2022 Annual Business Survey.
Nonprofit R&D Personnel
An estimated total of 196,418 employees worked on R&D within U.S. nonprofit organizations in FY 2021, including 147,578 full-time equivalent (FTE) employees. Of the FTE total, 39% were classified as researchers, 39% were classified as technicians, and the remaining 22% were other support personnel (table 3). Healthcare organizations accounted for over half of the FTE totals (54%). Other nonprofit organizations had a higher proportion of researchers (52% of their total) compared to healthcare and science and technology organizations (36% and 40%, respectively).
Headcount and full-time equivalent (FTE) counts of R&D employees of nonprofit organizations, by occupation category and type of nonprofit organization: FY 2021
i = more than 50% of the estimate is a combination of imputation and reweighting to account for nonresponse.
a Nonprofit organizations are classified using the 2017 North American Industry Classification System code that accounts for the majority of their payroll. This classification may differ from the National Taxonomy of Exempt Entities Core Codes system used by the Internal Revenue Service and National Center for Charitable Statistics.
Note(s):
These data exclude nonprofit universities and colleges and federally funded research and development centers administered by nonprofit organizations. Detail may not add to total because of rounding.
Source(s):
National Center for Science and Engineering Statistics and Census Bureau, Nonprofit Research Activities FY 2021 module of the 2022 Annual Business Survey.
Survey Information and Data Availability
The NPRA FY 2021 module of the 2022 Annual Business Survey was conducted in 2022 with a sample of 8,050 nonprofit organizations representing 40,650 total eligible nonprofit organizations in the United States. Higher education institutions and nonprofit-administered federally funded research and development centers (FFRDCs) are not included in this survey, as these populations are already included in NCSES’s Higher Education R&D Survey and FFRDC R&D Survey. The fiscal year referred to throughout this report was the nonprofit organizations’ fiscal year; for the majority of organizations reporting R&D performance, this fiscal year ended in either September or December 2021.
The response rate was 81%. The estimates in this InfoBrief are based on responses from a sample of the population and may differ from actual values because of sampling variability or other factors. As a result, apparent differences between the estimates for two or more groups may not be statistically significant. All comparative statements in this InfoBrief have undergone statistical testing and are significant at the 90% confidence level unless otherwise noted. The variances of estimates in this report were calculated using the delete-a-group jackknife replication method.
The full set of data tables for FY 2021 are available at https://ncses.nsf.gov/surveys/nonprofit-research-activities/2021#data. For more information, please contact the author.
Notes
1All amounts in this report are shown in current dollars.
2Data and information specific to the Nonprofit Research Activities module is found at https://ncses.nsf.gov/surveys/nonprofit-research-activities. Other data and information from the Annual Business Survey is available at https://ncses.nsf.gov/surveys/annual-business-survey.
3Employee numbers were reported both as total headcounts and as full-time equivalents (FTE). Headcounts represent every individual employed by the organization during FY 2021 regardless of their total hours worked. The FTE counts convert the headcounts to a total of full-time equivalent employees using the following calculation: 1 FTE equals 40 hours per week for 52 weeks per year. If an employee works 20 hours per week, they count as half of an FTE.
4See the “Technical Notes” to the FY 2021 data tables for details on the survey frame and exclusions (https://ncses.nsf.gov/surveys/nonprofit-research-activities/2021#technical-notes).
Correction(s)
In table 2, the estimates for FY 2021 were generated from microdata that included some uncorrected balance errors. This affected all cells except for the one with All R&D, Total. This error was also seen in the text describing the table findings, where the proportion of nonfederally funded R&D total was listed as 32% instead of 31%. The table and the text have been corrected, so text now reads, “A higher proportion of the federally funded R&D total was spent on applied research (44%) compared to the nonfederally funded R&D total (31%).
Suggested Citation
Britt R; National Center for Science and Engineering Statistics (NCSES). 2023. U.S. Nonprofits' R&D Performance Totaled $27 Billion in FY 2021. NSF 24-301. Alexandria, VA: National Science Foundation. Available at https://ncses.nsf.gov/pubs/nsf24301.
Contact Us
NCSES
National Center for Science and Engineering Statistics
Directorate for Social, Behavioral and Economic Sciences
National Science Foundation
2415 Eisenhower Avenue, Suite W14200
Alexandria, VA 22314
Tel: (703) 292-8780
FIRS: (800) 877-8339
TDD: (800) 281-8749
E-mail: ncsesweb@nsf.gov
NSF 24-301
|October 23, 2023