 An official website of the United States government

Graduate Enrollment in Science, Engineering, and Health Continues to Increase among Foreign Nationals, while Postdoctoral Appointment Trends Vary across Fields
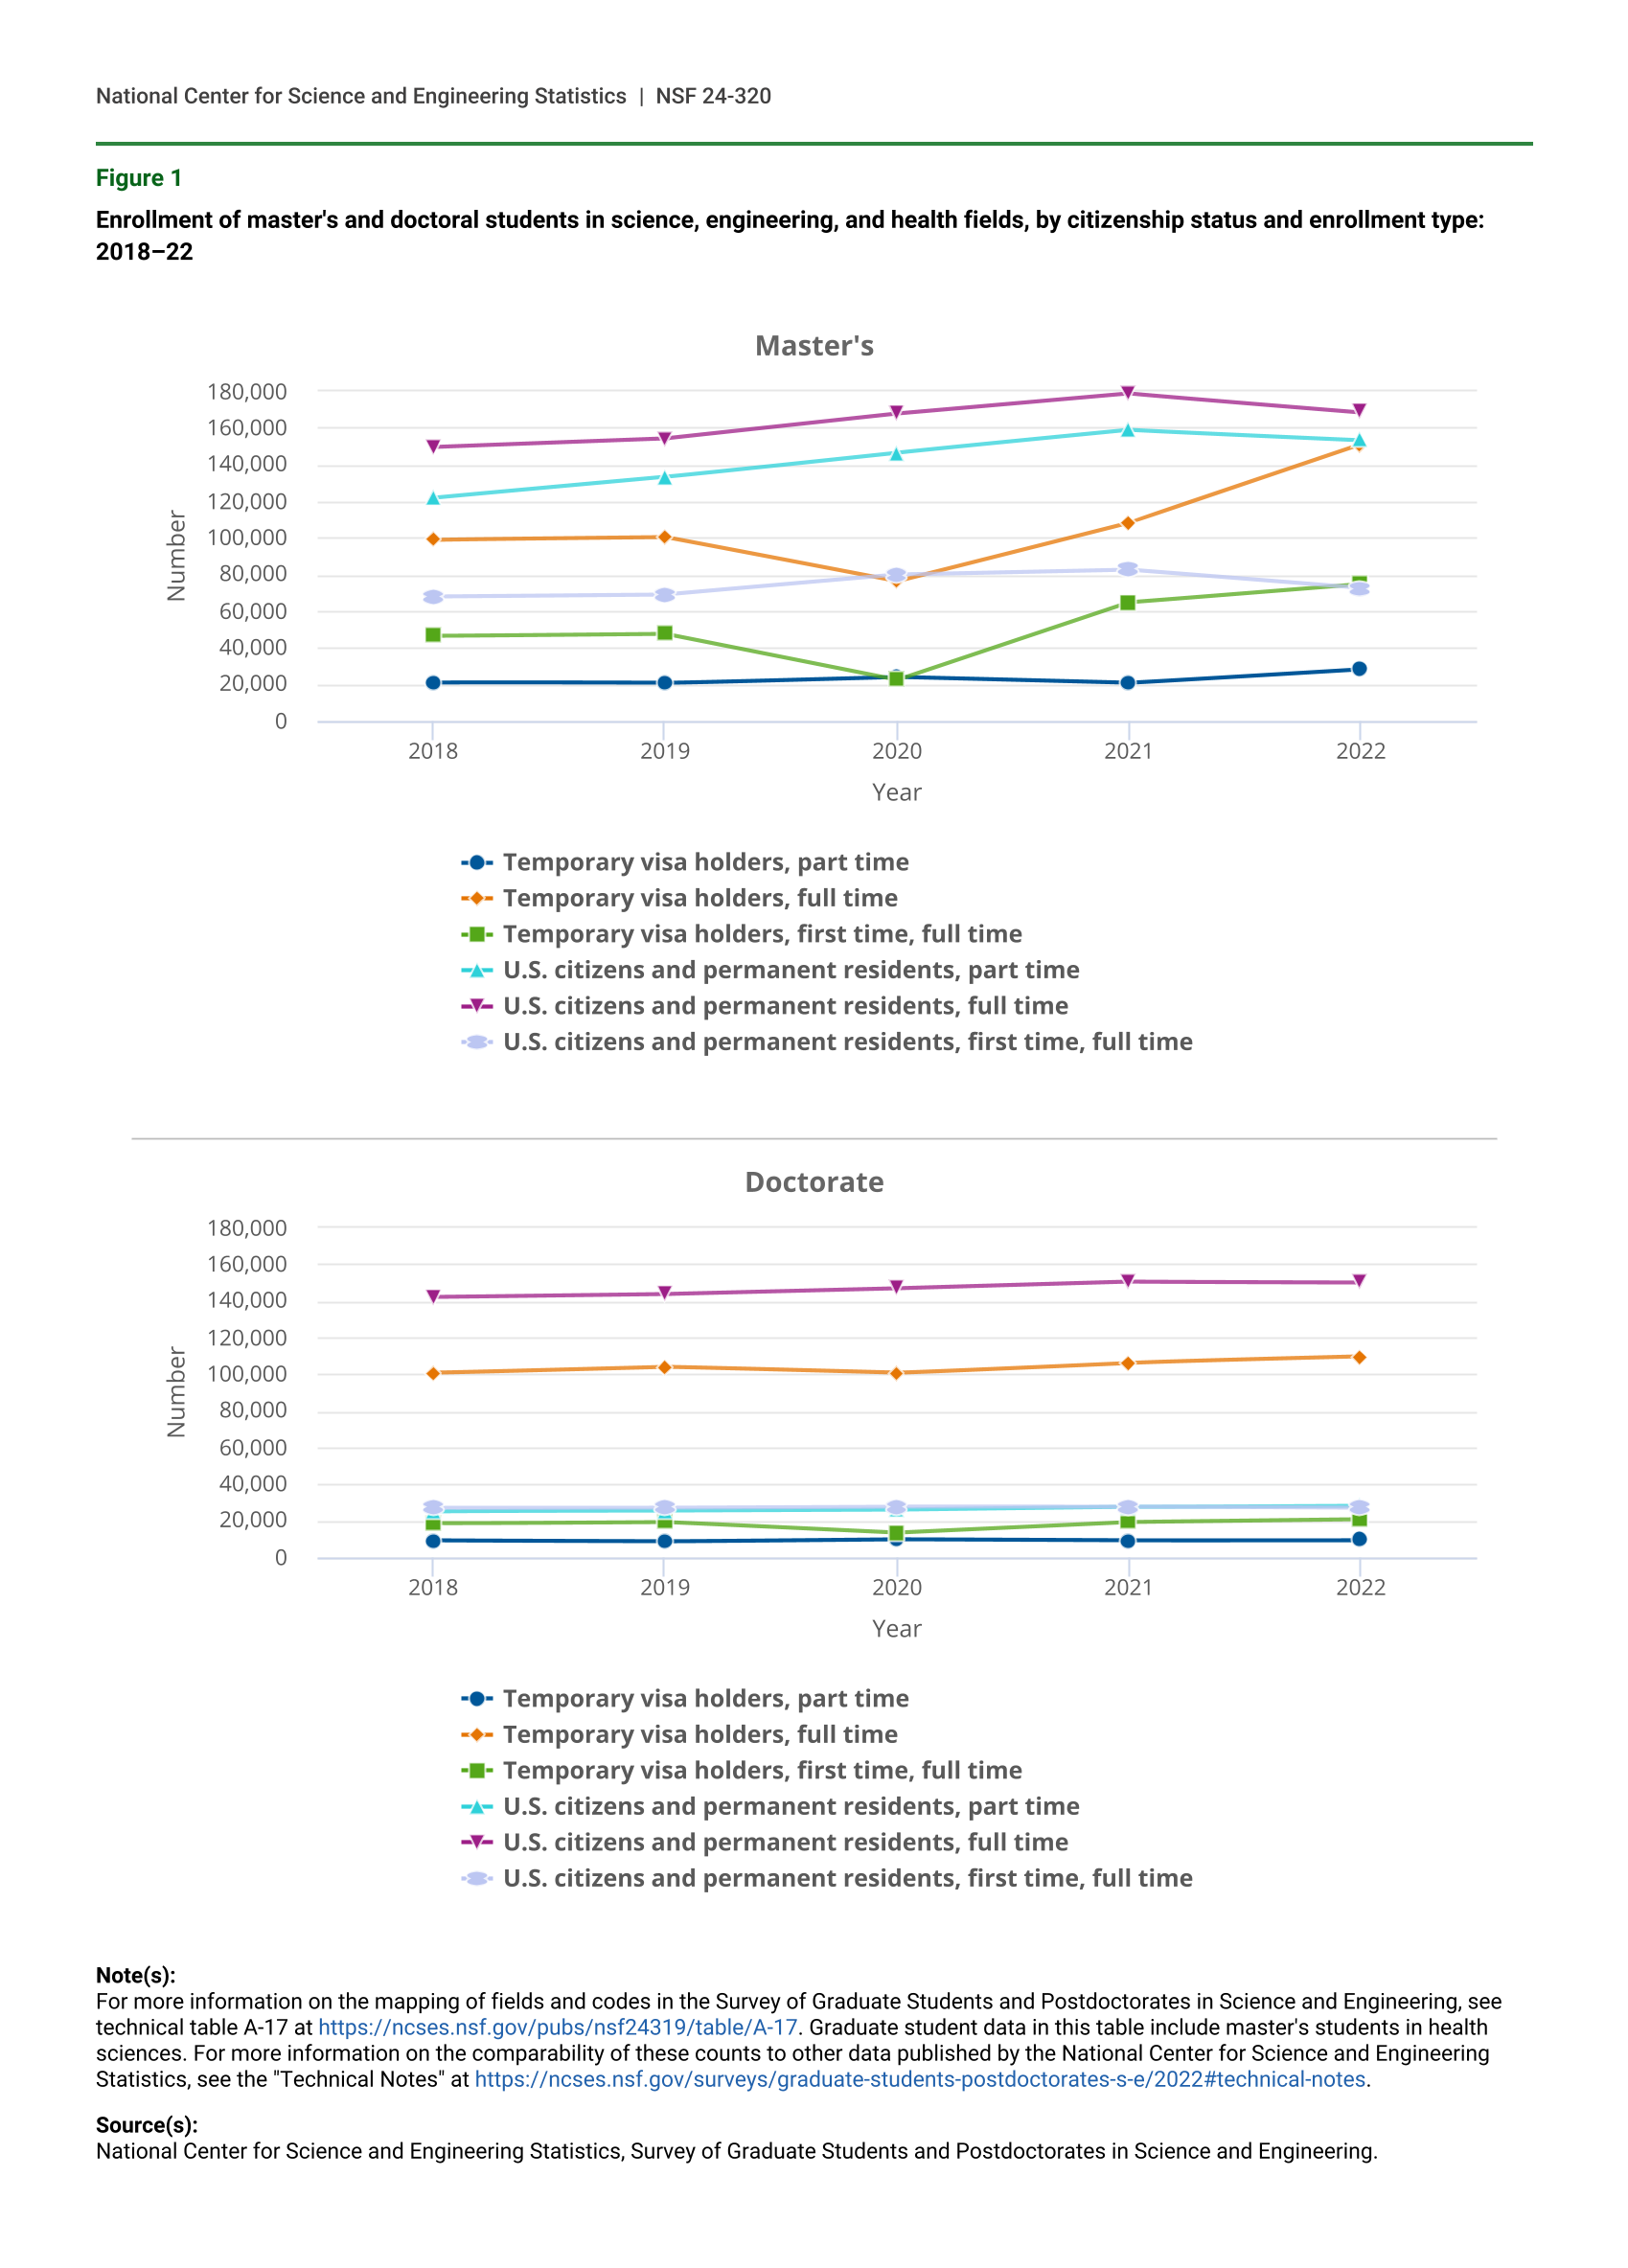
Between 2021 and 2022, graduate student enrollment in science, engineering, and health (SEH) fields increased by 5.0% (up by 38,378 graduate students), mostly due to an increase of 42,816 temporary visa holders enrolled in full-time master’s programs (figure 1). Full-time SEH master’s enrollment in 2022 was 319,618, whereas full-time doctoral enrollment was 259,683 (table 1), the highest number recorded in the Survey of Graduate Students and Postdoctorates in Science and Engineering (GSS).
Enrollment of master's and doctoral students in science, engineering, and health fields, by citizenship status and enrollment type: 2018–22
| Year | Temporary visa holders, part time | Temporary visa holders, full time | Temporary visa holders, first time, full time | U.S. citizens and permanent residents, part time | U.S. citizens and permanent residents, full time | U.S. citizens and permanent residents, first time, full time |
|---|---|---|---|---|---|---|
| 2018 | 20,902 | 99,019 | 46,393 | 121,757 | 149,533 | 67,821 |
| 2019 | 20,516 | 100,342 | 47,610 | 133,180 | 154,190 | 68,897 |
| 2020 | 24,080 | 76,093 | 22,381 | 146,539 | 167,766 | 79,715 |
| 2021 | 20,816 | 108,142 | 64,825 | 158,843 | 178,812 | 82,441 |
| 2022 | 28,348 | 150,958 | 74,913 | 153,345 | 168,660 | 72,404 |
| Year | Temporary visa holders, part time | Temporary visa holders, full time | Temporary visa holders, first time, full time | U.S. citizens and permanent residents, part time | U.S. citizens and permanent residents, full time | U.S. citizens and permanent residents, first time, full time |
|---|---|---|---|---|---|---|
| 2018 | 9,066 | 100,739 | 18,501 | 25,133 | 142,158 | 27,009 |
| 2019 | 8,652 | 104,103 | 19,348 | 25,327 | 143,807 | 27,177 |
| 2020 | 9,861 | 100,728 | 13,429 | 25,818 | 146,928 | 27,744 |
| 2021 | 9,271 | 106,330 | 19,155 | 27,403 | 150,539 | 27,515 |
| 2022 | 9,395 | 109,534 | 20,658 | 28,145 | 150,149 | 26,758 |
Note(s):
For more information on the mapping of fields and codes in the Survey of Graduate Students and Postdoctorates in Science and Engineering, see technical table A-17 at https://ncses.nsf.gov/pubs/nsf24319/table/A-17. Graduate student data in this table include master's students in health sciences. For more information on the comparability of these counts to other data published by the National Center for Science and Engineering Statistics, see the "Technical Notes" at https://ncses.nsf.gov/surveys/graduate-students-postdoctorates-s-e/2022#technical-notes.
Source(s):
National Center for Science and Engineering Statistics, Survey of Graduate Students and Postdoctorates in Science and Engineering.
Enrollment of master’s students and doctoral students in science, engineering, and health, by enrollment type, citizenship, sex, race, and ethnicity: 2018–22
* = value < 0.05%.
a Race and ethnicity data are available for U.S. citizens and permanent residents only.
Note(s):
Percentages may not add to total because of rounding. For more information on the mapping of fields and codes in the Survey of Graduate Students and Postdoctorates in Science and Engineering, see technical table A-17 https://ncses.nsf.gov/pubs/nsf24319/table/A-17. Graduate student data in this table include master's students in health sciences. For more information on the comparability of these counts to other published data from the National Center for Science and Engineering Statistics, see the "Technical Notes" at https://ncses.nsf.gov/surveys/graduate-students-postdoctorates-s-e/2022#technical-notes.
Source(s):
National Center for Science and Engineering Statistics, Survey of Graduate Students and Postdoctorates in Science and Engineering.
The number of SEH postdoctoral appointees (postdocs) in academic institutions declined slightly by 0.9% (578 postdocs) between 2021 and 2022 and has declined by 3.1% (2,033) since 2018. Postdoctoral employment among U.S. citizens and permanent residents declined by 8.3% (2,466) between 2021 and 2022, whereas postdoctoral employment of temporary visa holders increased by 5.6% (1,888) (table 2).
Postdoctoral appointments, by citizenship, sex, race, and ethnicity: 2018–22
a Race and ethnicity data are available for U.S. citizens and permanent residents only.
Source(s):
National Center for Science and Engineering Statistics, Survey of Graduate Students and Postdoctorates in Science and Engineering.
These and other findings in this InfoBrief are from the 2022 GSS, and the trend data are from 2018 to 2022. Data from the GSS provide insight into the composition of the current and future science and engineering (S&E) workforce by collecting data on graduate students, postdocs, and doctorate-holding nonfaulty researchers (NFRs) in SEH fields. The GSS is sponsored by the National Center for Science and Engineering Statistics (NCSES) within the National Science Foundation and by the National Institutes of Health (NIH).
Trends in Graduate Enrollment, by Citizenship Status
Enrollment trends by citizenship status and race and ethnicity provide important information about the composition of the future S&E workforce. This section highlights the increase in overall SEH graduate student enrollment, with variation by enrollment type and degree level. Enrollment trends diverged for temporary visa holders and U.S. citizens and permanent residents.
Enrollment in full-time master’s programs fluctuated between 2018 and 2022. After a temporary decline in 2020 followed by an increase in 2021, enrollment in full-time master’s programs increased by 11.4% between 2021 and 2022, from 286,954 to 319,618. Full-time doctoral enrollment also rose from 2021 to 2022, growing by 1.1% from 256,869 to 259,683 (table 1).
Temporary Visa Holders
Continuing the upward trend from 2020 to 2021, and consistent with data on international students from the Department of Homeland Security’s Student and Exchange Visitor Information System (SEVIS), the enrollment of temporary visa holders in SEH master’s and doctoral fields increased between 2021 and 2022. Among temporary visa holders, the number of full-time master’s students increased 39.6% (from 108,142 to 150,958) and the number of full-time doctoral students increased 3.0% (from 106,330 to 109,534). First-time, full-time enrollment of master’s students holding temporary visas increased 15.6% in 2022. This increase caused the number of first-time, full-time master’s students on temporary visas (74,913) to be larger than first-time, full-time U.S. citizens or permanent residents (72,404), a change from the previous 4 years. First-time, full-time enrollment for doctoral students holding temporary visas increased 7.8%, from 19,155 in 2021 to 20,658 in 2022 (table 1, figure 1).
U.S. Citizens and Permanent Residents
Conversely, SEH enrollment of U.S. citizens and permanent resident graduate students decreased between 2021 and 2022, reversing the trend from the previous few years (decrease of 3.0%, from 515,597 in 2021 to 500,299 in 2022). Among master’s students, this decrease includes a decline from 2021 to 2022 of 3.5% (5,498) for part-time enrollment and of 5.7% (10,152) for full-time enrollment. The drop in full-time master’s enrollment is almost entirely due to the decline in first-time, full-time enrollment (decrease of 12.2%, or 10,037) (table 1).
The changes in doctoral student enrollment between 2021 and 2022 varied by enrollment type among U.S. citizens and permanent residents. Part-time doctoral enrollment rose by 2.7% (742), whereas full-time doctoral enrollment was mostly flat, decreasing by only 0.3% (390). However, first-time, full-time doctoral enrollment decreased by 2.8% (757) (table 1).
Full-time enrollment trends by race and ethnicity for U.S. citizens and permanent residents varied across racial and ethnic groups and between master’s and doctoral enrollment. Among Hispanics or Latinos, master’s enrollment decreased by 2.9% (769) between 2021 and 2022, whereas doctoral enrollment increased by 2.9% (513). Over the same period, among Blacks or African Americans, master’s enrollment decreased by 6.1% (1,036), whereas doctoral enrollment increased by 3.5% (326). Among Asians, enrollment in master’s programs decreased by 1.5% (324), whereas doctoral enrollment increased by 4.7% (326). Meanwhile, between 2021 and 2022, among Whites, enrollment decreased for master’s and doctoral students by 7.4% (7,023) and by 2.3% (2,155), respectively (table 1).
Field of Study Trends for Master’s and Doctoral Students
Although overall enrollment for master’s and doctoral students grew between 2021 and 2022, growth was uneven across fields. This section focuses on the fastest growing fields.
Master’s Enrollment Trends, by Field
From 2021 to 2022, master’s enrollment grew by 8.6% (26,187) in science fields and by 8.3% (7,894) in engineering fields. Master’s enrollment in health fields did not change substantially from 2021 to 2022. Since 2018, master’s enrollment increased by 37.6% (90,656) in science fields, 10.7% (9,956) in engineering fields, and 16.7% (9,488) in health fields (table 3).
For master’s students, multidisciplinary and interdisciplinary science studies had the largest percentage increase in enrollment, increasing 41.2% between 2021 and 2022. However, computer and information sciences had the largest numeric increase during this time, rising by 27.2% (27,773) to a total of 129,972 master’s students. The next three largest growing fields for master’s students in terms of percentage growth between 2021 and 2022 were electrical, electronics, communications, and computer engineering (16.7%, or 4,621), other engineering (9.8%, or 1,203), and civil, environmental, transportation and related engineering (7.6%, or 891). The three fields showing the largest numeric declines in enrollment during this time for master’s students were psychology (3,557, or 6.9%), social sciences (2,915, or 6.1%), and clinical medicine (770, or 2.3%) (table 3).
Enrollment of master’s students and doctoral students in science, engineering, and health, by field: 2018–22
Note(s):
For more information on the mapping of fields and codes in the Survey of Graduate Students and Postdoctorates in Science and Engineering, see technical table A-17 at https://ncses.nsf.gov/pubs/nsf24319/table/A-17. Graduate student data in this table include master's students in health sciences. For more information on the comparability of these counts to other published data from the National Center for Science and Engineering Statistics, see the "Technical Notes" at https://ncses.nsf.gov/surveys/graduate-students-postdoctorates-s-e/2022#technical-notes.
Source(s):
National Center for Science and Engineering Statistics, Survey of Graduate Students and Postdoctorates in Science and Engineering.
Doctoral Enrollment Trends, by Field
As with master’s enrollment, doctoral enrollment also rose to a record high in 2022 (297,223), although 1- and 5-year gains were smaller. From 2021 to 2022, health fields grew the most percentagewise at 8.6% (1,429), followed by science fields at 1.1% (2,195). Engineering enrollment numbers remained stable over this time. Similarly, over the past 5 years, health fields had the largest percentage growth at 13.4% (2,129), followed by science fields at 8.0% (15,255) and engineering fields at 3.9% (2,783) (table 3).
The top three fastest growing fields for doctoral students percentagewise between 2021 and 2022 were other health (9.8%, or 1,075), multidisciplinary and interdisciplinary science studies (6.4%, or 240), and clinical medicine (6.3%, or 354). Biological and biomedical sciences had the largest numeric increase (1,483, or 2.6%) and remains the largest doctoral field (59,638).
Trends in Postdoc and Doctorate-Holding Nonfaculty Researcher Employment
Overall, the number of postdocs in GSS institutions decreased by 578 (0.9%) from 2021 to 2022, which was a smaller drop than the decline of 2,353 (3.6%) between 2020 and 2021. Since 2018, postdoctoral appointments have declined by 2,033 (3.1%). Conversely, the number of doctorate-holding NFRs increased by 1,731 (5.7%) from 2021 to 2022 and by 2,995 (10.2%) since 2018 (table 4).
Employment of postdoctoral appointees and doctorate-holding nonfaculty researchers, by field: 2018–22
* = value < 0.05%.
Note(s):
For more information on the mapping of fields and codes in the Survey of Graduate Students and Postdoctorates in Science and Engineering, see technical table A-17 at https://ncses.nsf.gov/pubs/nsf24319/table/A-17.
Source(s):
National Center for Science and Engineering Statistics, Survey of Graduate Students and Postdoctorates in Science and Engineering.
Demographics of Postdocs
For the first time since 2019, the number of postdocs holding temporary visas increased from 33,537 in 2021 to 35,461 in 2022 (5.6%). At the same time, the number of postdocs who are U.S. citizens and permanent residents decreased from 29,755 to 27,289 (8.3%). Among U.S. citizens and permanent residents, the number of postdocs increased among a few racial or ethnic groups despite the overall declining trend. For example, the number of Hispanic or Latino postdocs increased by 50 (2.3%) from 2021 to 2022 and by 336 (18.1%) since 2018. The number of American Indian or Alaska Native postdocs increased by 12 (15.0%) between 2021 and 2022 (table 2).
Among postdocs who hold temporary visas, the number of female postdocs showed a larger percentage increase than did the number of male postdocs. Specifically, in 2022, 1,137 (9.1%) more female postdocs had temporary visas than in 2021, compared with a 751 (3.6%) increase among male postdocs who had temporary visas.
Field of Research
From 2021 to 2022, the number of postdocs declined by 516 (1.4%) in science, with most of the decline coming from biological and biomedical sciences (660, or 3.3%). In the science fields, agricultural and veterinary sciences postdocs increased by 110 (6.9%), and natural resources and conservation postdocs increased by 47 (5.3%). In engineering fields, the number of postdocs in aerospace, aeronautical, and astronautical engineering decreased by 33 (11.9%), whereas industrial, manufacturing, systems engineering, and operations research increased by 16 (12.6%). With the exception of mechanical engineering, postdoc counts in all other engineering fields rose or fell by more than 3%, although the overall number of postdocs in engineering only declined by 5 (0.1%) between 2021 and 2022 (table 4, table 5).
Change in the number of postdoctoral appointees, by field: 2018–22
Note(s):
For more information on the mapping of fields and codes in the Survey of Graduate Students and Postdoctorates in Science and Engineering, see technical table A-17 at https://ncses.nsf.gov/pubs/nsf24319/table/A-17. Between 2019 and 2020, veterinary biomedical and clinical sciences moved from other health to agricultural and veterinary sciences; this move caused the large change in the number of postdocs for both fields.
Source(s):
National Center for Science and Engineering Statistics, Survey of Graduate Students and Postdoctorates in Science and Engineering.
Over half of postdocs in the GSS were in the biological and biomedical sciences (19,985) or clinical medicine (15,630); these were the only two fields with more than 10,000 postdocs. Between 2018 and 2022, the number of postdocs in the biological and biomedical sciences and in clinical medicine declined by 9.0% (1,948) and 5.6% (933), respectively. Between 2021 and 2022, postdoc counts in clinical medicine were relatively stable, increasing by 0.4% (69), whereas postdoc counts in biological and biomedical sciences continued their decline, decreasing by 3.3% (660). The primary source of support for 75.7% of postdocs in biological and biomedical sciences and for 88.3% of postdocs in clinical medicine in the GSS came from NIH. Consistent with the GSS findings for these fields, NIH recently reported a 3.6% decline in the number of postdocs it supported in FY 2022 compared with FY 2018.
In 2022, the number of doctorate-holding NFRs increased from 2018 by 10.2% (2,995) and from 2021 by 5.7% (1,731). Between 2021 and 2022, industrial, manufacturing, systems engineering, and operations research experienced the largest 1-year percentage increase in the number of doctorate-holding NFRs (84.1%, or 90), rising to 197 NFRs. Additionally, clinical medicine had the largest numeric increase, rising by 600 NFRs (8.9%). Similar to findings for postdocs, biological and biomedical sciences remains the largest field for doctorate-holding NFRs, with 8,207 in 2022 (table 4).
Data Sources, Limitations, and Availability
Conducted since 1966, the GSS is an annual survey of all academic institutions in the United States that grant research-based master’s or doctoral degrees in SEH fields. The 2022 GSS collected data from 22,519 organizational units (departments, programs, affiliated research centers, and health care facilities) at 690 eligible institutions and their affiliates in the United States, Puerto Rico, and Guam. The unit response rate was 98.7%. An overview of the survey is available at https://ncses.nsf.gov/surveys/graduate-students-postdoctorates-s-e/2022.
In 2020, the GSS amended its taxonomy to align with the revised NCSES Taxonomy of Disciplines (TOD) and the 2020 National Center for Education Statistics’ Classification of Instructional Programs (CIP). The only newly ineligible CIP codes were those dropped by the 2020 CIP. As such, these changes did not lead to a large shift in overall reported GSS counts, and data remain comparable with data from 2017 to 2019. Additionally, new CIP codes, such as data science and medical clinical sciences, were added, along with other codes in GSS-eligible series; although these CIP codes are newly eligible, a review of unit names from prior years indicates that many of them were being reported before 2020. Some further adjustments to allow for additional detail in some fields were made to the GSS taxonomy based on the 2020 CIP codes reported to the GSS. Finally, broad fields were added to engineering.
At the field level, some notable changes occurred that may impact trends. First, consistent with the 2020 CIP and TOD, veterinary biomedical and clinical sciences moved from the health sciences to agricultural sciences (which was then renamed agricultural and veterinary sciences). Human development is now reported under psychology, rather than social sciences, to align with the 2020 TOD. Finally, 22 new 2020 CIP codes were added to multidisciplinary and interdisciplinary studies; the addition of these CIP codes likely moved units that were already reported (i.e., many units named data science are now reported with new CIP codes that map to the new data science and data analytics GSS code). For more information about the 2020 GSS taxonomy change, see technical tables A-17, A-18a, and A-18b (https://ncses.nsf.gov/pubs/nsf22319).
GSS health fields are collected under the advisement of NIH. These GSS fields are about a third of all health fields in the National Center for Education Statistics’ CIP taxonomy. NIH information on trends seen within these selected health fields can be found at https://report.nih.gov/nihdatabook/. In the NCSES TOD, a master’s degree in a health field is considered to be an S&E-related degree rather than an S&E degree. In the GSS, health fields are reported separately from S&E fields, although they are included in total counts of master’s students.
The full set of data tables from the 2022 survey is available at https://ncses.nsf.gov/surveys/graduate-students-postdoctorates-s-e/2022. Data are also available in NCSES’s interactive data tool (https://ncsesdata.nsf.gov/ids/gss). For more information about the survey, contact the GSS Survey Manager, Michael Yamaner.
Notes
1For more information, see the full set of data tables: table 1-5a.
2The Student and Exchange Visitor Program produces the SEVIS by the numbers reported. SEVIS reported an increase of 15.7% for master’s students and 3.2% for doctoral students between 2021 and 2022. It is important to note that not all SEVIS programs are GSS eligible, so there may be some differences between the GSS and SEVIS counts. For more information, see Immigration and Customs Enforcement (ICE). 2022. SEVIS by the Numbers: Annual Report on International Student Trends. Available at https://www.ice.gov/doclib/sevis/pdf/sevisBTN2022.pdf. Accessed 31 October 2023.
3More specifically, the Survey of Earned Doctorates (SED) reported that the percentage of new doctorate holders taking jobs in academia declined 3.5 percentage points between 2021 and 2022 (Heuer et al. 2023) and that fewer new doctorate holders took postdoctoral appointments compared with 2017 (SED data tables: table 2-3). See Heuer R, Einaudi P, Kang K; National Center for Science and Engineering Statistics (NCSES). 2023. Research Doctorate Conferrals Rebound, Leading to Record Number of U.S. Doctorate Recipients in 2022. NSF 23-353. Alexandria, VA: National Science Foundation. Available at https://ncses.nsf.gov/pubs/nsf23353/.
4For more information, see the full set of data tables: table 3-4.
5NIH reported supporting 30,997 postdocs in 2018, compared with 28,953 in 2022. The NIH postdoc support numbers are higher than the GSS numbers due to the “primary” source of support qualification in the GSS; NIH counts being cumulative over the course of the fiscal year, whereas GSS counts represent a point in time (1 October); and some NIH postdocs may work in fields or institutions that are not GSS eligible. See Lauer M. 2023. Number of Postdoctoral Researchers Supported by NIH Grant Awards FY 2017–FY 2022. NIH Extramural Nexus. Available at https://nexus.od.nih.gov/all/2023/03/02/number-of-postdoctoral-researchers-supported-by-nih-grant-awards-fy-2017-fy-2022/. Accessed 9 October 2023.
Suggested Citation
Smith B, Alldredge E-E, Arbeit CA, Yamaner MI; National Center for Science and Engineering Statistics (NCSES). 2024. Graduate Enrollment in Science, Engineering, and Health Continues to Increase among Foreign Nationals, while Postdoctoral Appointment Trends Vary across Fields. NSF 24-320. Alexandria, VA: National Science Foundation. Available at https://ncses.nsf.gov/pubs/nsf24320/.
Contact Us
NCSES
National Center for Science and Engineering Statistics
Directorate for Social, Behavioral and Economic Sciences
National Science Foundation
2415 Eisenhower Avenue, Suite W14200
Alexandria, VA 22314
Tel: (703) 292-8780
FIRS: (800) 877-8339
TDD: (800) 281-8749
E-mail: ncsesweb@nsf.gov
NSF 24-320
|March 20, 2024