 An official website of the United States government
State Government Agencies’ Expenditures for R&D Increase 11% from FY 2023 to FY 2024
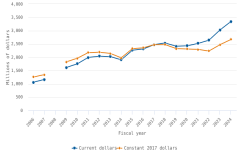
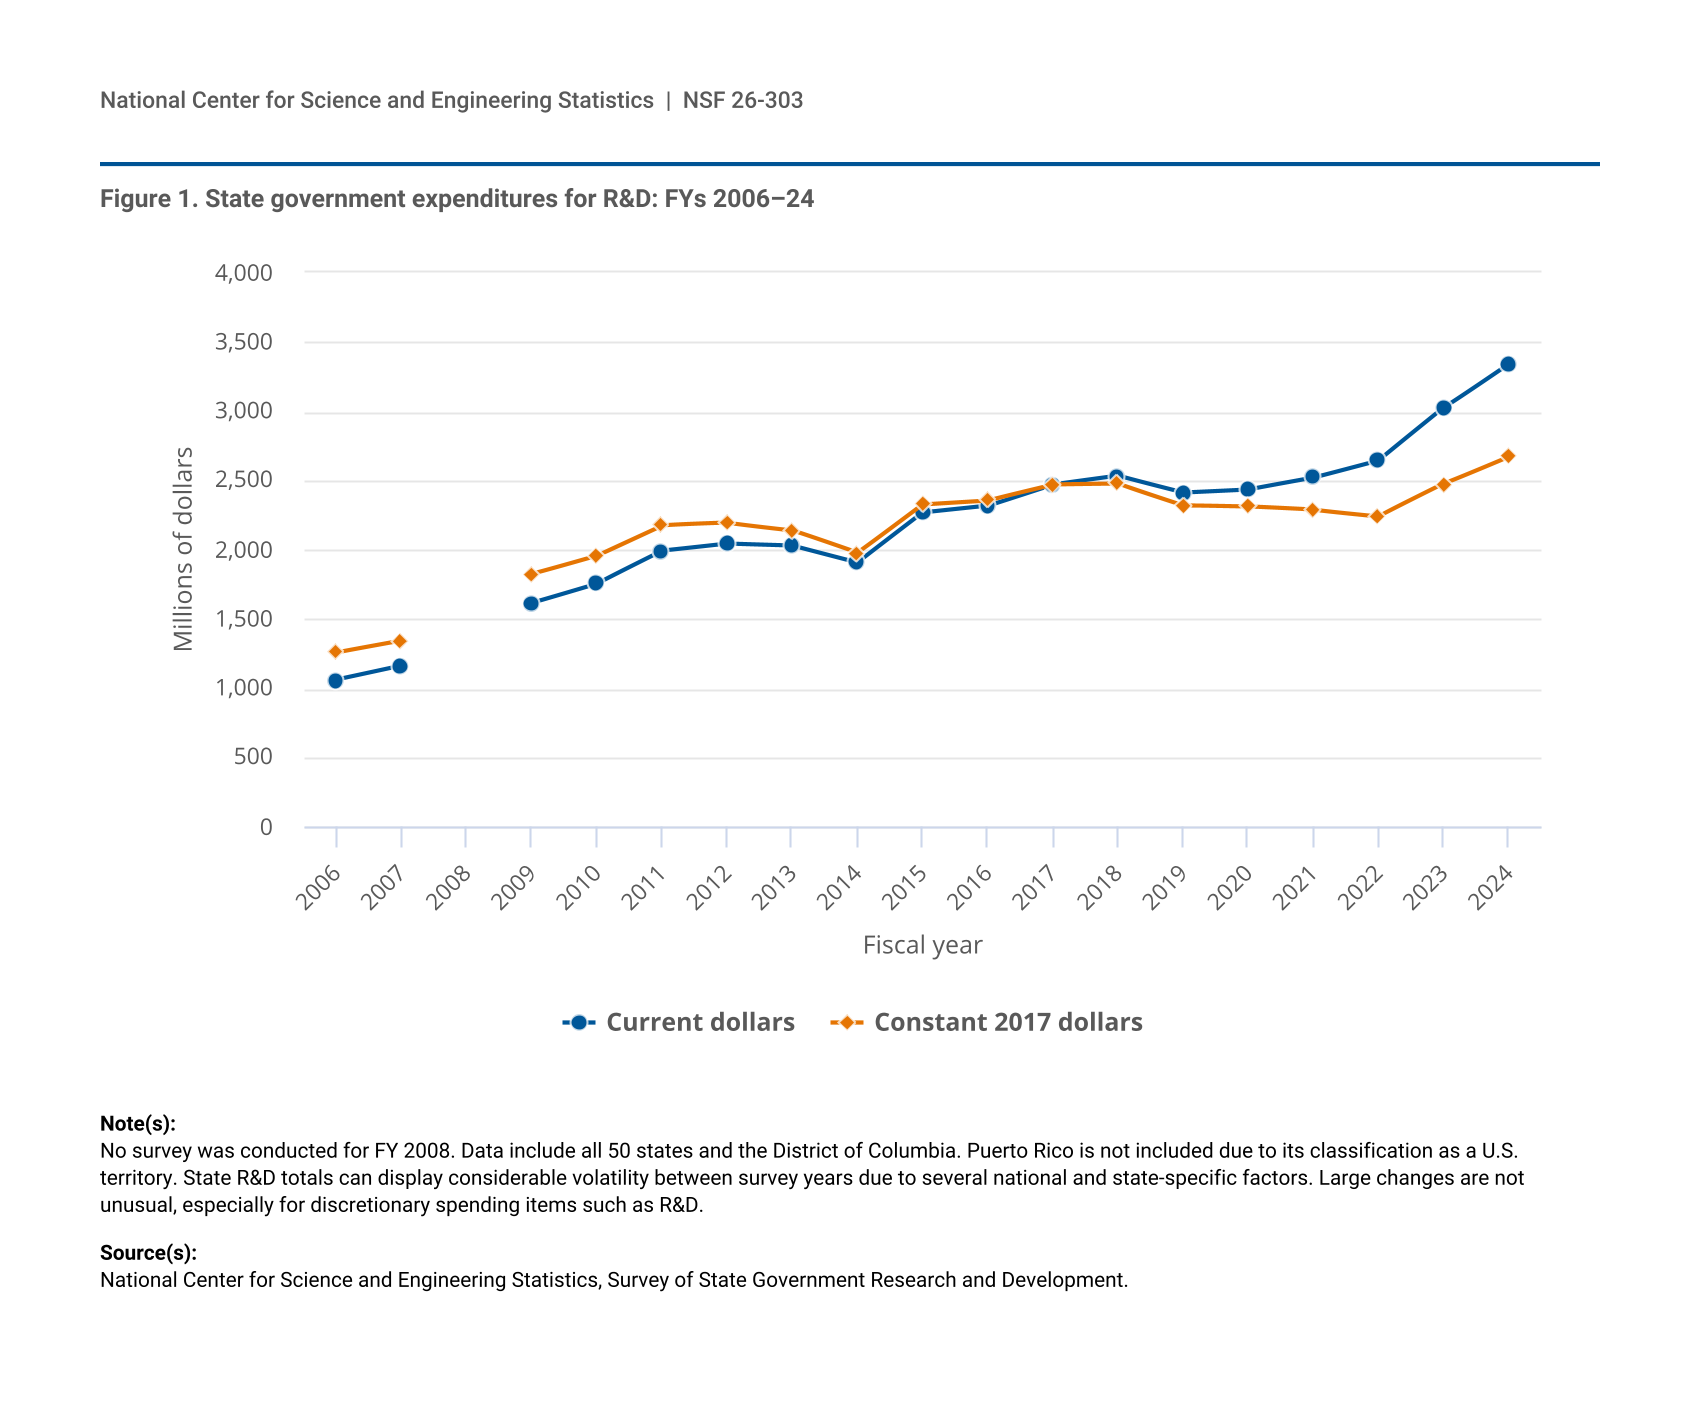
In FY 2024, state government agencies’ expenditures on research and experimental development (R&D) totaled $3.3 billion, an increase of 10.6% from the FY 2023 expenditures of $3.0 billion (figure 1). However, when adjusted for inflation, state government agency R&D expenditures totaled $2.7 billion in FY 2024, an increase of 8.0% from the FY 2023 adjusted amount of $2.5 billion.
| Fiscal year | Current dollars | Constant 2017 dollars |
|---|---|---|
| 2006 | 1,059 | 1,260 |
| 2007 | 1,161 | 1,345 |
| 2008 | NA | NA |
| 2009 | 1,616 | 1,825 |
| 2010 | 1,756 | 1,959 |
| 2011 | 1,990 | 2,176 |
| 2012 | 2,042 | 2,192 |
| 2013 | 2,028 | 2,140 |
| 2014 | 1,906 | 1,976 |
| 2015 | 2,265 | 2,328 |
| 2016 | 2,314 | 2,356 |
| 2017 | 2,468 | 2,468 |
| 2018 | 2,531 | 2,474 |
| 2019 | 2,412 | 2,320 |
| 2020 | 2,434 | 2,310 |
| 2021 | 2,519 | 2,286 |
| 2022 | 2,644 | 2,240 |
| 2023 | 3,024 | 2,473 |
| 2024 | 3,345 | 2,671 |
No survey was conducted for FY 2008. Data include all 50 states and the District of Columbia. Puerto Rico is not included due to its classification as a U.S. territory. State R&D totals can display considerable volatility between survey years due to several national and state-specific factors. Large changes are not unusual, especially for discretionary spending items such as R&D.
National Center for Science and Engineering Statistics, Survey of State Government Research and Development.
This InfoBrief presents summary statistics from the FY 2024 Survey of State Government Research and Development, sponsored by the National Center for Science and Engineering Statistics (NCSES) within the U.S. National Science Foundation. Amounts reported do not include direct appropriations from state legislatures to universities, colleges, and private organizations. Data presented in this InfoBrief are in current dollars unless otherwise noted.
Summary of State Government R&D Totals
State governments’ FY 2024 expenditures for both R&D and R&D plant totaled $3.4 billion (table 1). R&D accounted for 99% of these expenditures at $3.3 billion. R&D plant accounted for just $24 million. State governments served as the largest source of funds for agency R&D at $2.6 billion (78%), while federal funds accounted for $727 million (22%). In FY 2023, expenditures from state government funds accounted for 75% and federal funding accounted for 25% of all state R&D expenditures.
a R&D plant expenditures includes acquisition of land, facilities, major equipment, and major building renovations intended primarily for R&D use.
b Intramural performers includes a department's or agency's own employees who perform R&D and services performed by others in support of an internal R&D project.
c Nonprofit organizations includes foundations.
d Other governments includes federal government departments and agencies; other departments or agencies within the state; other state governments; and county, city, special district, or regional local governments.
e All other extramural performers includes all performers not elsewhere classified.
f Other R&D functions includes but is not limited to government functions for corrections, criminal justice, education, forensic sciences, labor, public safety, and social services functions.
Detail may not add to total due to rounding. Data include all 50 states and the District of Columbia. Puerto Rico is not included due to its classification as a U.S. territory.
National Center for Science and Engineering Statistics, Survey of State Government Research and Development, FY 2024.
Of the six functional categories of state agency R&D expenditures, health-related R&D remained the largest with nearly $1.5 billion in expenditures in FY 2024, increasing 13.6% from FY 2023. Environment and natural resources-related R&D remained the second-largest functional category with $616 million, while energy-related R&D followed with $503 million. Transportation-related R&D totaled $345 million, while agriculture-related R&D totaled $188 million. Other R&D, a combination of activities including but not limited to corrections, criminal justice, education, forensic science, labor, public safety, and social services, totaled $237 million in FY 2024.
State Government R&D Performance
Overview
State governments are both funders and performers of R&D. While all R&D performance is measured in terms of expenditures, not all expenditures are a measure of actual performance. For example, intramural performance of R&D is measured by the expenditures on the work of state employees within state owned and operated facilities. However, state government expenditures to external parties (e.g., businesses, higher education institutions, nonprofit organizations) to conduct R&D on behalf of the funding agency, usually in the form of contracts and grants, are not a measure of performance. This funding is referred to as expenditures on extramural R&D but are not actual performance of R&D by these external performers. The actual performance by these recipient sectors would be measured by their respective expenditures, which are measured on other NCSES surveys.
Intramural R&D Performance
Five states accounted for 68% of the $812 million in total expenditures for intramural R&D performed by state agencies in FY 2024: New York ($304 million), California ($107 million), Florida ($64 million), Washington ($43 million), and South Carolina ($38 million) (table 2). New York State’s own intramural R&D expenditures accounted for 37% of all state governments’ intramural R&D performance. In FY 2024, 51% ($415 million) of total state government intramural R&D expenditures came from each state’s own funds, while 42% ($340 million) was supported by federal funds. New York State accounted for 45% ($154 million) of all intramural R&D expenditures sourced from federal funds across all states.
a U.S. total reflects all 50 states and the District of Columbia. Puerto Rico is not included due to its classification as a U.S. territory.
Intramural performers includes a department's or agency's own employees who perform R&D and services performed by others in support of an internal R&D project.
National Center for Science and Engineering Statistics, Survey of State Government Research and Development, FY 2024.
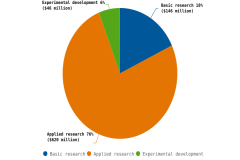
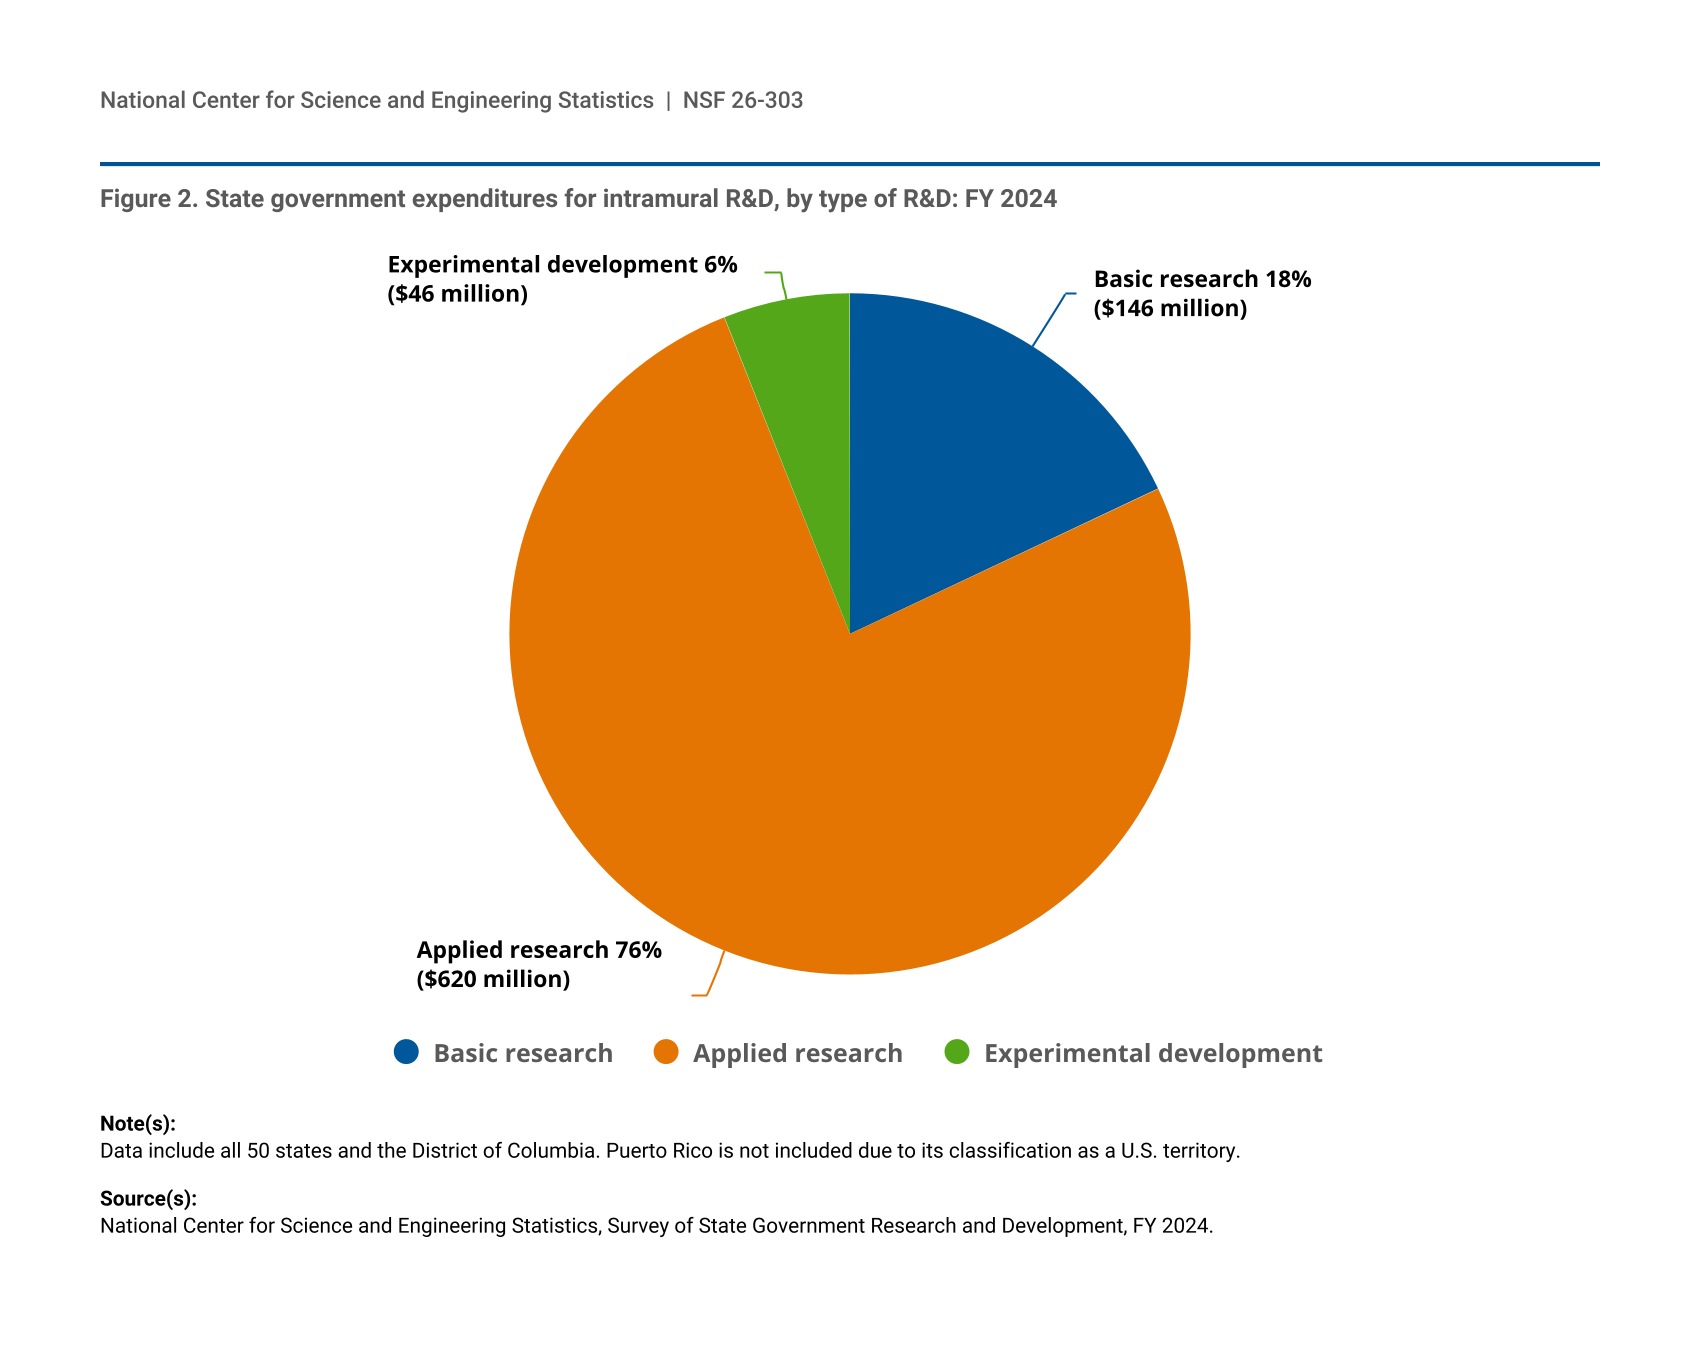
State government intramural R&D activities are measured by type of R&D, which has three distinct categories: basic research, applied research, and experimental development. In FY 2024, 76% ($620 million) of all intramural R&D expenditures were directed toward applied research, followed by basic research at 18% ($146 million) and experimental development with just 6% ($46 million) (figure 2). Applied research is defined as original investigation undertaken in order to acquire new knowledge. It is, however, directed primarily toward a specific, practical aim or objective. Given that the nature of state governments’ R&D activities are to address practical aims and solutions to problems for the benefit of their citizenry, it is expected that intramural R&D be primarily directed toward applied research.,
| Type of R&D | Percent | Millions of dollars |
|---|---|---|
| Basic research | 18 | 146 |
| Applied research | 76 | 620 |
| Experimental development | 6 | 46 |
Data include all 50 states and the District of Columbia. Puerto Rico is not included due to its classification as a U.S. territory.
National Center for Science and Engineering Statistics, Survey of State Government Research and Development, FY 2024.
Extramural R&D Performance
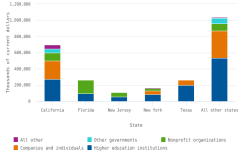
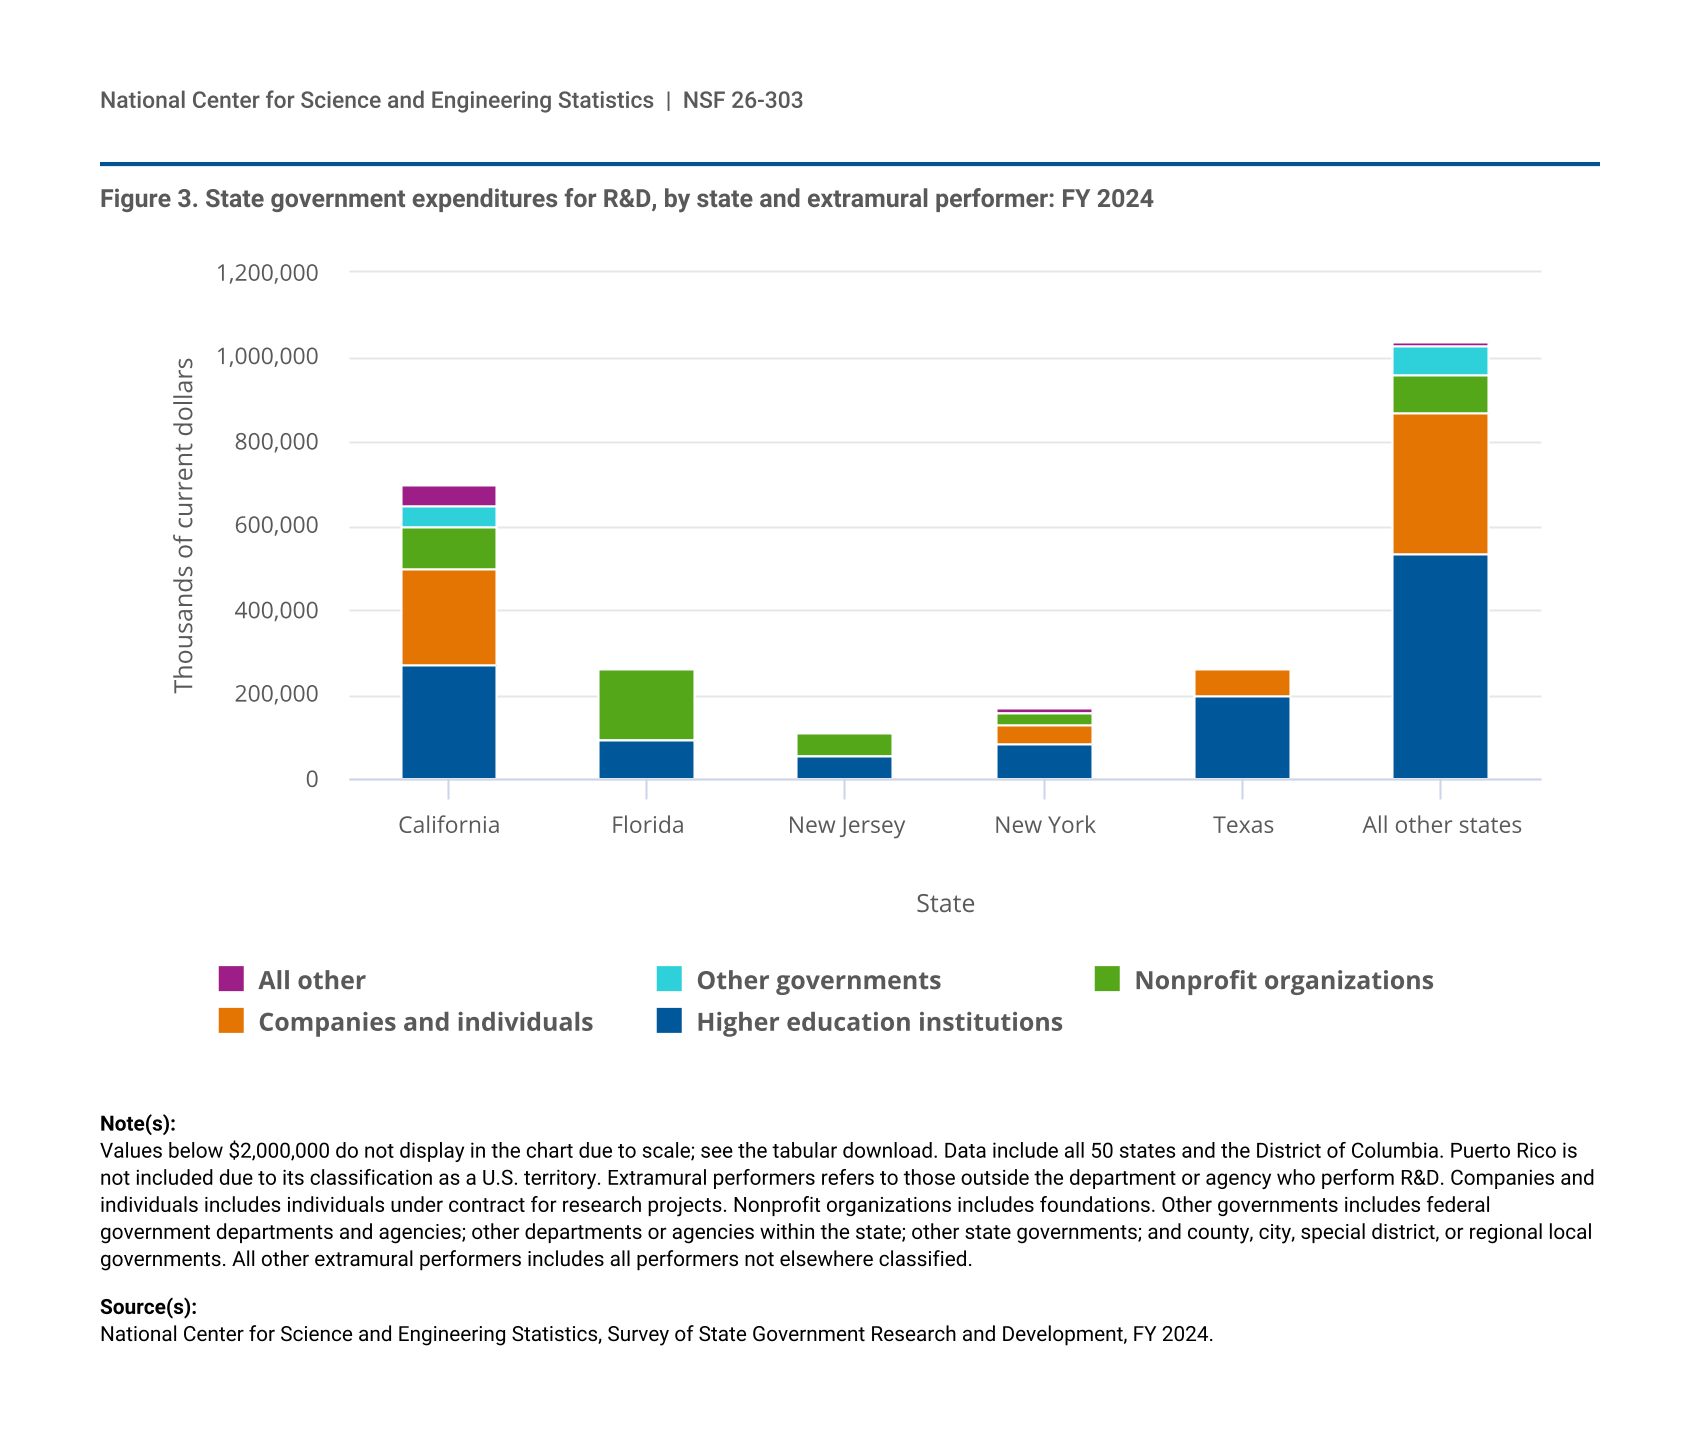
In FY 2024, all state government expenditures for extramural performance of R&D totaled $2.5 billion. The five states with the largest amount of extramural R&D expenditures were California ($694 million), Texas ($262 million), Florida ($262 million), New York ($168 million), and New Jersey ($110 million). Combined, these state governments accounted for $1.5 billion or 59% of all state governments’ extramural R&D (figure 3).
| State | Higher education institutions | Companies and individuals | Nonprofit organizations | Other governments | All other |
|---|---|---|---|---|---|
| California | 269,502 | 230,420 | 99,321 | 45,440 | 49,672 |
| Florida | 94,151 | 1,810 | 166,022 | 81 | 0 |
| New Jersey | 54,094 | 1,079 | 54,722 | 111 | 0 |
| New York | 84,120 | 44,529 | 30,247 | 638 | 8,889 |
| Texas | 196,750 | 63,779 | 590 | 1,150 | 0 |
| All other states | 535,614 | 332,394 | 89,919 | 69,552 | 8,240 |
Values below $2,000,000 do not display in the chart due to scale; see the tabular download. Data include all 50 states and the District of Columbia. Puerto Rico is not included due to its classification as a U.S. territory. Extramural performers refers to those outside the department or agency who perform R&D. Companies and individuals includes individuals under contract for research projects. Nonprofit organizations includes foundations. Other governments includes federal government departments and agencies; other departments or agencies within the state; other state governments; and county, city, special district, or regional local governments. All other extramural performers includes all performers not elsewhere classified.
National Center for Science and Engineering Statistics, Survey of State Government Research and Development, FY 2024.
However, states varied in how they distributed extramural R&D. For example, Texas state agencies directed $197 million of the state’s total $262 million extramural R&D toward higher education institutions, compared with $64 million to companies and individuals. By comparison, the majority of California’s extramural R&D funding was distributed across three sectors, with $270 million directed toward higher education institutions, $230 million toward companies and individuals, and $99 million toward nonprofit organizations.
State Government Agencies’ R&D Expenditures by Function
Overview
Whether performed by state agencies themselves or by other performers outside the agency, most states reported a broad mix of R&D related to state government functions (table 3). Health-related R&D expenditures accounted for the largest share (44%) of state agencies’ R&D. R&D expenditures related to environment and natural resources and to energy accounted for 18% and 15%, respectively, of total state government R&D expenditures in FY 2024. The share of total R&D expenditures related to transportation, agriculture, and all other functions in FY 2024 were 10%, 6%, and 7%, respectively.
a Other R&D functions includes but is not limited to corrections, criminal justice, education, forensic science, labor, public safety, and social services functions.
b U.S. total reflects all 50 states and the District of Columbia. Puerto Rico is not included due to its classification as a U.S. territory.
State agency expenditures includes funding from all sources for both intramural and extramural performers. Detail may not add to total because of rounding.
National Center for Science and Engineering Statistics, Survey of State Government Research and Development, FY 2024.
Agency-Specific R&D Details
Of the 516 state agencies that responded to the survey in FY 2024, the largest 20 state agencies, by total expenditures, accounted for 58% ($1.9 billion) of all agency R&D expenditures. Although many states invested in health-related R&D, expenditures were highly concentrated among the largest funding agencies. For example, among the 20 largest state agencies, 11 funded health-related R&D. These 11 agencies accounted for $1.2 billion (79%) of the nearly $1.5 billion total for health-related R&D, while the four largest agencies in terms of health R&D expenditures constituted 60% ($880 million) of all FY 2024 state government health-related R&D. State expenditures for energy-related R&D were even more highly concentrated: the California Energy Commission alone accounted for 49% ($246 million) of all state agencies’ energy-related R&D expenditures ($503 million).
Data Sources, Limitations, and Availability
All 50 states, the District of Columbia, and Puerto Rico participated in the FY 2024 survey; 516 of the 534 surveyed agencies responded. Puerto Rico is not included in the U.S. total due to its classification as a U.S. territory. Data for the FY 2024 survey were collected for NCSES by the Census Bureau under an interagency agreement.
For most states, the fiscal year begins on 1 July and ends the following 30 June. For example, FY 2024 begins on 1 July 2023 and ends on 30 June 2024. There are, however, five exceptions to the 30 June fiscal year end: New York (ends 31 March); Texas (ends 31 August); and Alabama, Michigan, and the District of Columbia (all end 30 September). Data presented in this InfoBrief are for each of the respective fiscal year periods as defined by the states.
Terms such as state, state government, and state agencies have equivalent meaning and are used interchangeably throughout this InfoBrief. The amounts reported here are for R&D expenditures of state government departments, agencies, public authorities, commissions, and other dependent entities that operate separately or somewhat autonomously from the central state government. State government R&D totals can display considerable volatility between survey years due to several national and state-specific factors. Large changes are not unusual, especially for discretionary spending items such as R&D. R&D plant expenditures can be highly variable year to year and will increase or decrease as capital projects begin or end.
Amounts reported do not include direct appropriations from state legislatures to universities, colleges, and private organizations. As a result, the $1.2 billion in FY 2024 expenditures reported by state agencies to support R&D performance by higher education institutions differs from the figure reported by universities and colleges in the NCSES Higher Education Research and Development (HERD) Survey for R&D expenditures funded by state and local government sources because the latter includes direct state appropriations, which are excluded from the Survey of State Government R&D, as well as local governments.
Although this survey is a census of state government agencies that fund R&D and there is no sampling error, survey data are still subject to some degree of unmeasurable nonsampling error, which may include errors in classification or measurement of certain aspects of an agency’s R&D. For additional information see the section “Survey Quality Measures” within the Technical Notes of the survey.
State- and agency-specific data not available in this InfoBrief are available in the full set of data tables from this survey at https://ncses.nsf.gov/surveys/state-government-research-development/. For more information, please contact NCSES.
NCSES has reviewed this product for unauthorized disclosure of confidential information and approved its release (NCSES-DRN25-050).
Notes
1 Percentages are calculated based on total dollar values, not the rounded dollar values presented in this InfoBrief.
2 In this report, dollars adjusted for inflation (i.e., constant dollars) are based on the gross domestic product (GDP) implicit price deflator (currently in 2017 dollars) as published by the Bureau of Economic Analysis at https://www.bea.gov/iTable/index_nipa.cfm, Table 1.1.9 Implicit Price Deflators for Gross Domestic Product, accessed on 8 August 2025. Note that GDP deflators are calculated on an economy-wide scale and do not explicitly focus on R&D.
3 Expenditures for R&D do not include expenditures for R&D plant because the two are separate funding activities.
4 State sources of funding include, but are not necessarily limited to, appropriations from the state legislature; agricultural commodity assessments (checkoffs); bond funds; general funds; restricted funds; revenue funds; tobacco settlement funds; and revenue from charges, fees, or fines.
5 NCSES sponsors several surveys that measure R&D performance for various sectors of the economy. Business sector R&D performance survey results are available from the Annual Business Survey and the Business Enterprise Research and Development Survey. Higher education sector R&D performance is measured by the Higher Education Research and Development Survey. The nonprofit sector R&D performance is measured by the Nonprofit Research Activities Survey. The federal government’s intramural performance of R&D is measured by the Federal Facilities Research and Development Survey and the FFRDC Research and Development Survey.
6 Basic research is defined as experimental or theoretical work undertaken primarily to acquire new knowledge of the underlying foundations of phenomena and observable facts, without any particular application or use in view.
7 Experimental development is defined as systematic work, drawing on knowledge gained from research and practical experience and producing additional knowledge, which is directed to producing new products or processes or to improving existing products or processes.
8 Survey Technical Notes are available at https://ncses.nsf.gov/surveys/state-government-research-development/2024#technical-notes.
Suggested Citation
National Center for Science and Engineering Statistics (NCSES). 2025. State Government Agencies’ Expenditures for R&D Increase 11% from FY 2023 to FY 2024. NSF 26-303. Alexandria, VA: U.S. National Science Foundation. Available at https://ncses.nsf.gov/pubs/nsf26303.
Contact Us
National Center for Science and Engineering Statistics
Directorate for Social, Behavioral and Economic Sciences
U.S. National Science Foundation
2415 Eisenhower Avenue, Suite W14200
Alexandria, VA 22314
Tel: (703) 292-8780
FIRS: (800) 877-8339
TDD: (800) 281-8749
E-mail: ncsesweb@nsf.gov