 An official website of the United States government
Postdoctoral Appointments Rise While Graduate Enrollment Slows
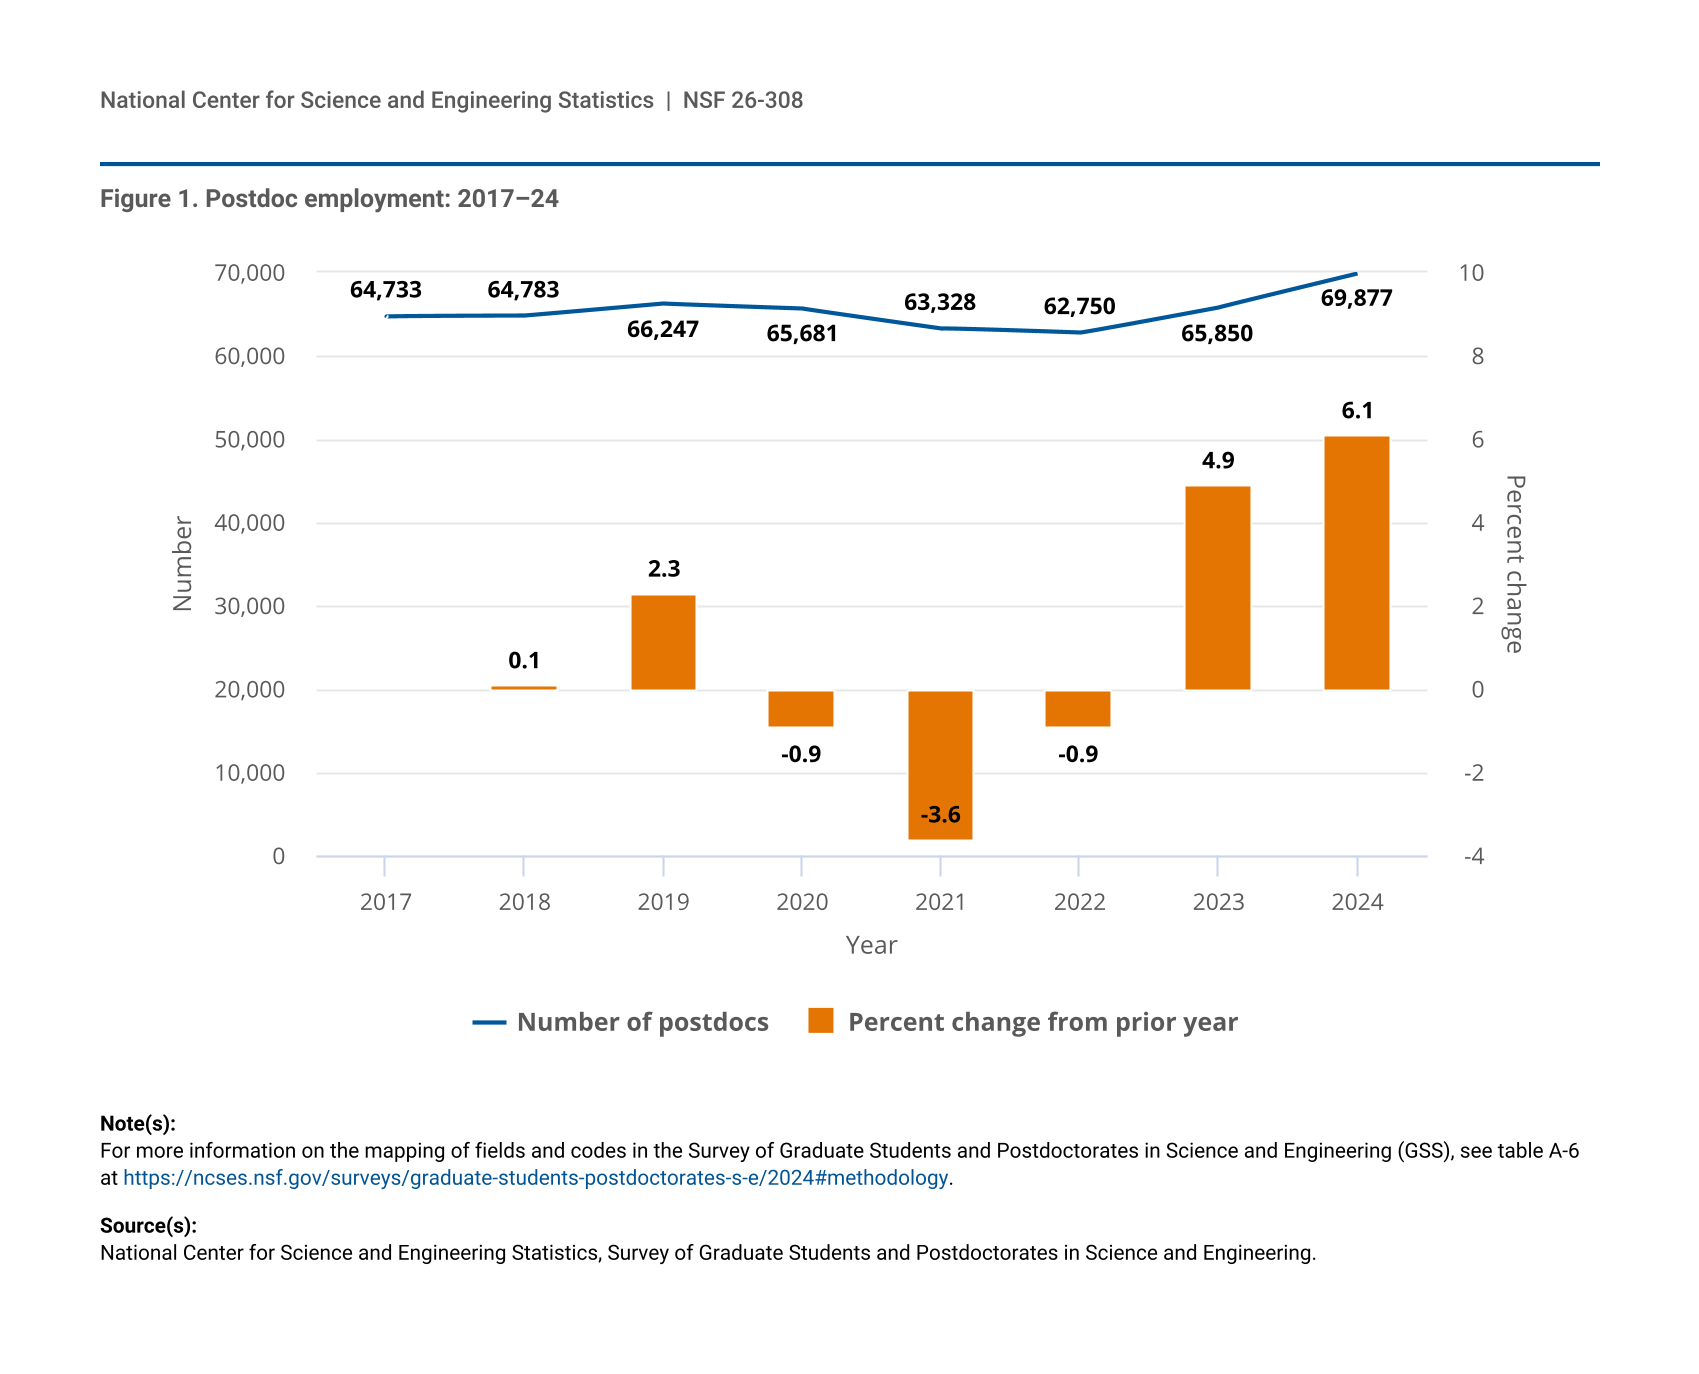
Between 2023 and 2024, the number of postdoctoral appointees (postdocs) rose by 6.1%, from 65,850 to 69,877—the highest number ever reported to the Survey of Graduate Students and Postdoctorates in Science and Engineering (GSS) (figure 1). Before 2024, the 66,247 postdocs reported in 2019 was the highest number of postdocs at GSS institutions. The number of postdocs declined from 2020 to 2022 before increasing for each of the last two survey cycles. Graduate student counts were more complex, with generally stable enrollment in the master’s science, engineering, and health (SEH) program between 2023 and 2024 and a slight increase in enrollment in doctoral SEH programs during that period (table 1).
| Year | Number of postdocs | Percent change from prior year |
|---|---|---|
| 2017 | 64,733 | - |
| 2018 | 64,783 | 0.1 |
| 2019 | 66,247 | 2.3 |
| 2020 | 65,681 | -0.9 |
| 2021 | 63,328 | -3.6 |
| 2022 | 62,750 | -0.9 |
| 2023 | 65,850 | 4.9 |
| 2024 | 69,877 | 6.1 |
For more information on the mapping of fields and codes in the Survey of Graduate Students and Postdoctorates in Science and Engineering (GSS), see table A-6 at https://ncses.nsf.gov/surveys/graduate-students-postdoctorates-s-e/2024#methodology.
National Center for Science and Engineering Statistics, Survey of Graduate Students and Postdoctorates in Science and Engineering.
The 2023adjusted column removes the data from the institutions determined to be no longer eligible for the Survey of Graduate Students and Postdoctorates in Science and Engineering (GSS) during the 2024 frame review. For more information, see the InfoBrief Impact of the 2024 GSS Institutional Eligibility Review on Counts of GSS Master’s Students at https://ncses.nsf.gov/pubs/nsf25346. For more information on the mapping of fields and codes in the GSS, see table A-6 at https://ncses.nsf.gov/surveys/graduate-students-postdoctorates-s-e/2024#methodology.
National Center for Science and Engineering Statistics, Survey of Graduate Students and Postdoctorates in Science and Engineering.
These and other findings in this InfoBrief are from the 2024 GSS. Data from the GSS provide insight into the composition of the current and future science and engineering (S&E) workforce by collecting data on graduate students, postdocs, and doctorate-holding nonfaculty researchers (NFRs) in SEH fields. This survey is funded by the National Center for Science and Engineering Statistics (NCSES) within the U.S. National Science Foundation and by the National Institutes of Health (NIH). In this InfoBrief, single-year changes in graduate enrollment have been adjusted to take the frame changes from the 2024 eligibility review into account. For more information on the eligibility review, see the section “Data Sources and Limitations” below.
Field of Study Trends for Master’s and Doctoral Students
Between 2023 and 2024, enrollment of master’s students remained stable overall, but it grew 1.2% in science, remained stable in engineering (-0.9%), and decreased 2.5% in health (table 1). Doctoral enrollment increased slightly during this period, based on increases in science (1.9%) and engineering (2.0%), which offset a small decline in health programs (1.0%).
Master’s Enrollment Trends, by Field
Master’s enrollment in SEH fields increased 22.1% between 2020 and 2024, with enrollment in biological and biomedical sciences and in multidisciplinary and interdisciplinary sciences increasing in each year. From 2020 to 2024, these two fields saw increases of 16.9% (from 39,920 to 46,661) and 140.7% (from 10,980 to 26,426), respectively (table 1). From 2023 to 2024, the largest numeric and percentage increase was in multidisciplinary and interdisciplinary sciences enrollment, with a 21.7% increase (from 21,709 to 26,426). Within multidisciplinary and interdisciplinary sciences, data science and analytics drove this growth (table 1 and data tables: table 1-2).
As in previous years, computer and information sciences was the largest broad field in the GSS, enrolling over a quarter (27.1%) of master’s students in 2024 (table 1 and data tables: table 2-7). From 2021 to 2023, computer and information sciences was consistently the fastest growing field for master’s students. In 2024, enrollment of master’s students in this field declined for the first time since 2020, from 141,116 in 2023 to 137,358 in 2024 (2.7%). Even with this 1-year decline, the overall enrollment of master’s students in computer and information sciences in 2024 was 70.2% higher than it was in 2020 (table 1).
Among engineering broad fields, only three fields increased enrollment between 2023 and 2024: biological, biomedical, and biosystems engineering (5.2%); aerospace, aeronautical, and astronautical engineering (3.4%); and metallurgical, mining, materials, and related engineering (1.7%). All the remaining engineering subfields either remained stable or declined, with the largest decline in civil, environmental, transportation, and related fields (5.8%). Enrollment in the health field continued to decline, with a 2.5% decline from 2023 to 2024, mostly due to declining enrollment in public health (see data tables: table 1-2).
Doctoral Enrollment Trends, by Field
In 2024, doctoral enrollment rose to a record high of 312,148 (table 1). From 2023 to 2024, both science and engineering grew (1.9% and 2.0%, respectively), whereas health declined slightly (1.0%). Over the past 5 years, however, health fields had the largest growth (22.8%), followed by science (10.2%) and engineering (7.2%).
Within the sciences, doctoral enrollment in 7 of the 10 broad fields grew every year between 2020 and 2024. Of the remaining 3 science fields, mathematics and statistics enrollment grew from 2022 to 2024, psychology enrollment grew unevenly from 2020 to 2024, and social sciences enrollment declined most of the years from 2020 to 2024, with a 5.7% decline in enrollment over that period, including a 1.5% decline between 2023 and 2024. Offsetting the decline in the social sciences enrollment, enrollment in multidisciplinary and interdisciplinary sciences increased by 15.9% from 2023 to 2024 and enrollment in computer and information sciences and in biological and biomedical sciences grew by 6.8% and 2.5%, respectively, during that period (table 1).
Trends in Enrollment, by Citizenship Status
In 2024, 322,037 students were enrolled full time in master’s programs, down slightly (1.0%) from the 2023 count of 325,267. Looking over the past 5 years, full-time enrollment in master’s programs was lower in 2020 than in 2019 due to the COVID-19 pandemic (data tables: table 1-9 and NSF 22-313). From 2020 to 2024, full-time enrollment in master’s programs increased 32.1%, but such enrollment decreased slightly (1.0%) between 2023 and 2024 (table 2). Full-time enrollment in doctoral programs rose by 2.3% from 2023 to 2024 (from 268,495 to 274,601), with an overall 10.9% increase from 2020 to 2024.
* = value < 0.05%.
a Race and ethnicity data are available for U.S. citizens and permanent residents only.
The 2023adjusted column removes the data from the institutions determined to be no longer eligible for the Survey of Graduate Students and Postdoctorates in Science and Engineering (GSS) during the 2024 frame review. For more information, see the InfoBrief Impact of the 2024 GSS Institutional Eligibility Review on Counts of GSS Master’s Students at https://ncses.nsf.gov/pubs/nsf25346.
National Center for Science and Engineering Statistics, Survey of Graduate Students and Postdoctorates in Science and Engineering.
From 2023 to 2024, part-time enrollment in master’s programs increased by 2.7% (4,881), and part-time enrollment in doctoral programs declined by 2.3% (865). Over the previous 5 years, from 2020 to 2024, part-time master’s enrollment increased by 7.8%, whereas part-time doctoral enrollment increased 5.2%.
Temporary Visa Holders
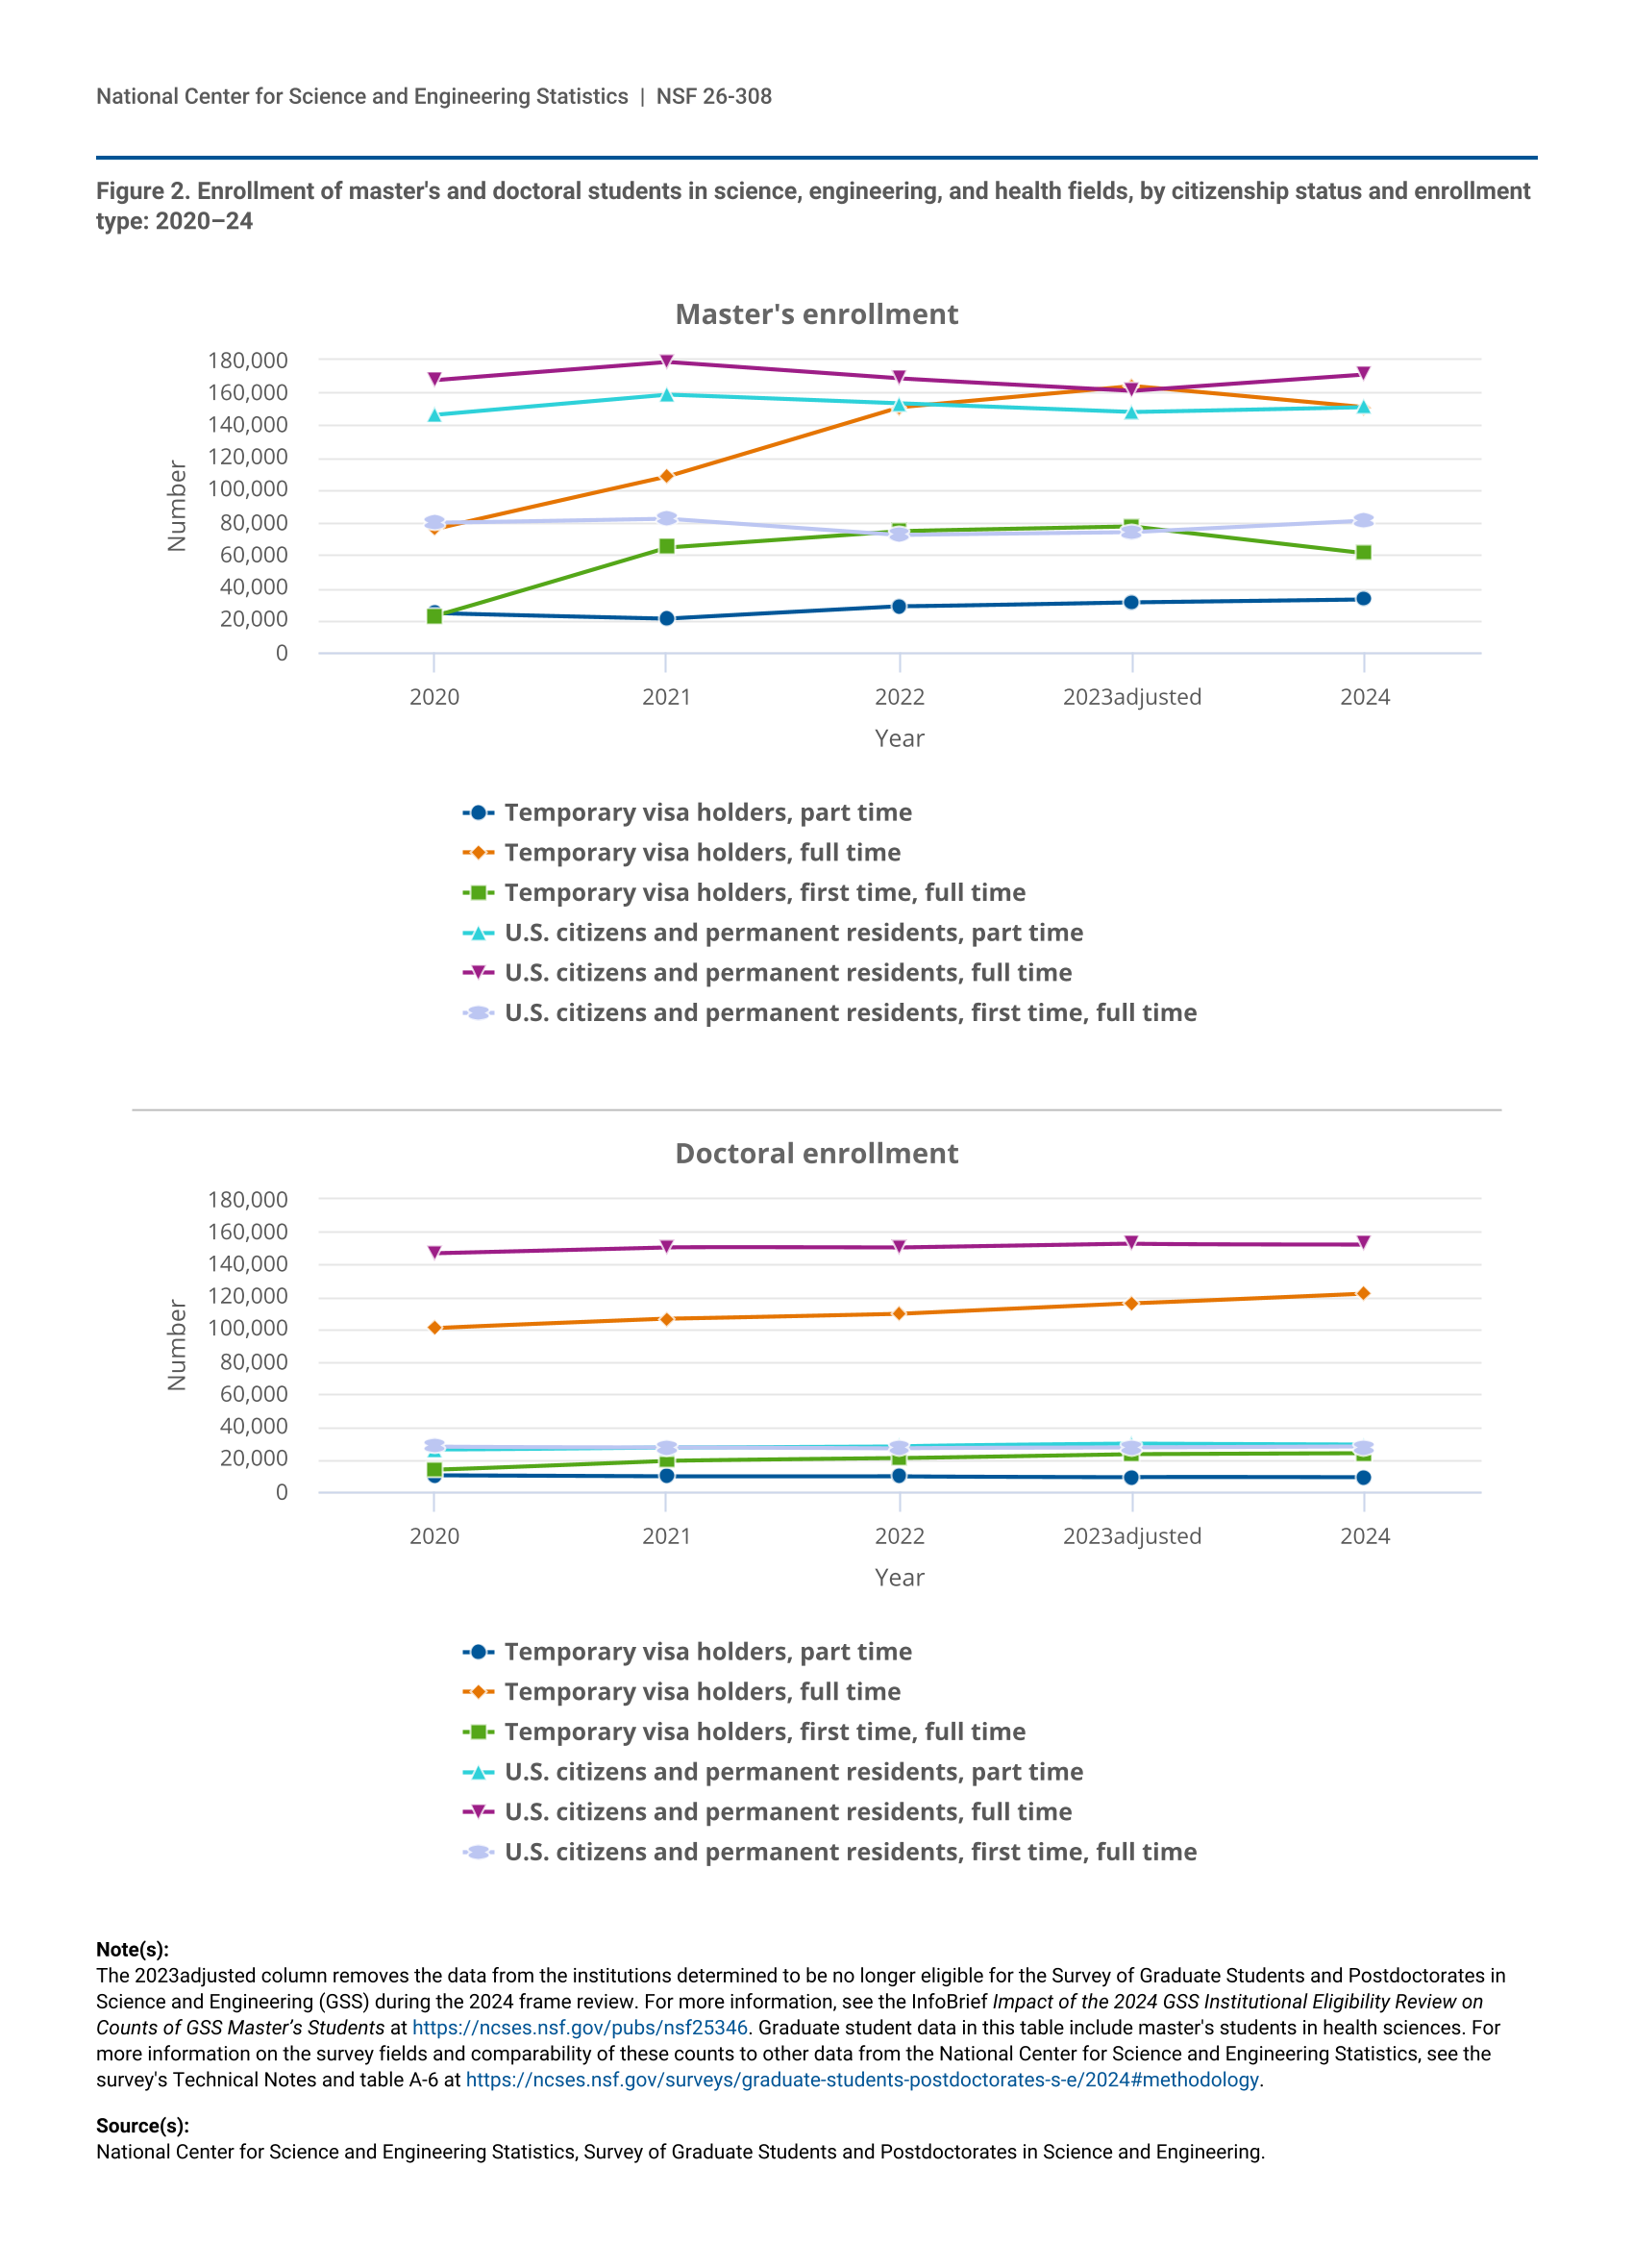
From 2021 to 2023, enrollment of temporary visa holders consistently increased in SEH master’s degree and full-time doctoral degree programs, yet between 2023 and 2024, enrollment for these groups slowed or declined, with differences across enrollment intensity and degree type (figure 2 and table 2). Among temporary visa holders enrolled in master’s degree programs, the number of part-time students increased 5.8% (from 31,049 in 2023 to 32,860 in 2024), the number of full-time students decreased by 8.0% (from 164,041 to 150,855), and the number of first-time, full-time students fell by 21.2% (from 77,702 to 61,263).
| Year | Temporary visa holders, part time | Temporary visa holders, full time | Temporary visa holders, first time, full time | U.S. citizens and permanent residents, part time | U.S. citizens and permanent residents, full time | U.S. citizens and permanent residents, first time, full time |
|---|---|---|---|---|---|---|
| 2020 | 24,080 | 76,093 | 22,381 | 146,539 | 167,766 | 79,715 |
| 2021 | 20,816 | 108,142 | 64,825 | 158,843 | 178,812 | 82,441 |
| 2022 | 28,348 | 150,958 | 74,913 | 153,345 | 168,660 | 72,404 |
| 2023adjusted | 31,049 | 164,041 | 77,702 | 147,963 | 161,226 | 74,010 |
| 2024 | 32,860 | 150,855 | 61,263 | 151,033 | 171,182 | 81,016 |
| Year | Temporary visa holders, part time | Temporary visa holders, full time | Temporary visa holders, first time, full time | U.S. citizens and permanent residents, part time | U.S. citizens and permanent residents, full time | U.S. citizens and permanent residents, first time, full time |
|---|---|---|---|---|---|---|
| 2020 | 9,861 | 100,728 | 13,429 | 25,818 | 146,928 | 27,744 |
| 2021 | 9,271 | 106,330 | 19,155 | 27,403 | 150,539 | 27,515 |
| 2022 | 9,395 | 109,534 | 20,658 | 28,145 | 150,149 | 26,758 |
| 2023adjusted | 9,017 | 115,985 | 23,199 | 29,395 | 152,510 | 27,018 |
| 2024 | 8,675 | 122,179 | 23,756 | 28,872 | 152,422 | 27,565 |
The 2023adjusted column removes the data from the institutions determined to be no longer eligible for the Survey of Graduate Students and Postdoctorates in Science and Engineering (GSS) during the 2024 frame review. For more information, see the InfoBrief Impact of the 2024 GSS Institutional Eligibility Review on Counts of GSS Master’s Students at https://ncses.nsf.gov/pubs/nsf25346. Graduate student data in this table include master's students in health sciences. For more information on the survey fields and comparability of these counts to other data from the National Center for Science and Engineering Statistics, see the survey's Technical Notes and table A-6 at https://ncses.nsf.gov/surveys/graduate-students-postdoctorates-s-e/2024#methodology.
National Center for Science and Engineering Statistics, Survey of Graduate Students and Postdoctorates in Science and Engineering.
Among temporary visa holders in doctoral degree programs, the number of part-time students declined by 3.8% (from 9,017 in 2023 to 8,675 in 2024), whereas the number full-time students increased by 5.3% (from 115,985 to 122,179). First-time, full-time enrollment of temporary visa–holding doctoral students increased 2.4% (from 23,199 in 2023 to 23,756 in 2024) (data tables: table 1-7).
Among temporary visa holders in SEH, graduate enrollment for men and women from 2023 to 2024 followed the overall trends described above, increasing for part-time master’s students and for full-time doctoral students and decreasing for full-time master’s students and part-time doctoral students. Among full-time master’s students who were temporary visa holders, the percentage decline of female student counts was smaller than that for male students. Conversely, the percentage increase in the number of female students was slightly larger than the increase for male students. Specifically, part-time master’s enrollment for temporary visa holders from 2023 to 2024 increased by 7.1% for women and 5.1%, for men (table 2). However, full-time master’s enrollment for temporary visa holders from 2023 to 2024 decreased by 6.6% for women and 9.0% for men. Between 2023 and 2024, part-time doctoral enrollment for temporary visa holders decreased by 4.4% for women and 3.4% for men; however, full-time doctoral enrollment for temporary visa holders increased by 6.6% for women and 4.6% for men.
U.S. Citizens and Permanent Residents
For the first time since 2021, the enrollment of U.S. citizens and permanent residents in SEH master’s programs in 2024 increased over the past year. Specifically, part-time enrollment increased by 2.1% from 2023 to 2024 (from 147,693 to 151,033), and full-time enrollment for this group increased by 6.2% (from 161,226 to 171,182) (table 2). Since 2020, part-time and full-time enrollment in master’s programs rose by 3.1% and 2.0%, respectively. Additionally, first-time, full-time master’s enrollment increased by 9.5% (from 74,010 to 81,016) from 2023 to 2024.
The trends among doctoral students differed. Among U.S. citizens or permanent residents in doctoral programs, part-time enrollment decreased by 1.8% (from 29,395 in 2023 to 28,872 in 2024), and full-time enrollment remained relatively stable with a modest decrease of 88 students. Yet, first-time, full-time enrollment in doctoral programs for U.S. citizens or permanent residents grew 2.0% (from 27,018 to 27,565) from 2023 to 2024.
Demographic Trends in Enrollment
With regards to the race and ethnicity of U.S. citizens and permanent residents, the number of master’s students reported as unknown race and ethnicity increased by 12.0% (from 15,322 in 2023 to 17,160 in 2024) (table 2). This change reflects an increase of 18.6% in first-time, full-time master’s students reported as unknown race and ethnicity (from 3,250 in 2023 to 3,855 in 2024). For first-time, full-time doctoral students, the 1-year change in the percentage of unknown race and ethnicity was 30.0% (from 1,147 in 2023 to 1,491 in 2024). Because doctoral programs take longer to complete than master’s programs, the impact of this upsurge of persons with unknown race and ethnicity attending first time, full time had a greater impact on the percentage increase of full-time doctoral students than on that of full-time master’s students (12.1% vs. 5.2% increase from 2023 to 2024). However, data users should note that counts by group may not be comparable year to year because the reporting of unknown race and ethnicity may not be random across racial and ethnic groups.
Among full-time master’s students who were U.S. citizens or permanent residents, enrollment increased by 4.7% for women (from 98,646 in 2023 to 103,238 in 2024) and by 8.6% for men (from 62,580 to 67,944) (table 2). For U.S. citizens or permanent residents enrolled first time, full time in master’s programs, the number of men increased by 11.4% (from 29,742 to 33,136) and the number of women increased by 8.2% (from 44,268 to 47,880) during the same period.
Overall, U.S. citizen and permanent resident enrollment in full-time doctoral programs remained stable, with a minor shift between the enrollment in the number of men (decreased by 1.1%, from 72,952 to 72,167) and women (increased by 0.9%, from 79,558 to 80,255). First-time, full-time enrollment for doctoral programs increased for men by 1.3% (from 12,452 to 12,608), whereas the count for women increased by 2.7% (from 14,566 to 14,957).
Trends in Postdoc and Nonfaculty Researcher Employment
Overall, postdoc employment increased to a record high of 69,877 in 2024 (a 6.1% increase from 2023) (figure 1, table 3, and data tables: table 1-15). The number of NFRs reported to the GSS also rose between 2023 and 2024 (table 3). NFR employment counts have increased by 18.5% since 2020 and by 2.3% over the most recent year, from 34,342 in 2023 to 35,142 in 2024.
For more information on the mapping of fields and codes in the Survey of Graduate Students and Postdoctorates in Science and Engineering, see table A-6 at https://ncses.nsf.gov/surveys/graduate-students-postdoctorates-s-e/2024#methodology.
National Center for Science and Engineering Statistics, Survey of Graduate Students and Postdoctorates in Science and Engineering.
Field of Research
From 2023 to 2024, postdoctoral appointments increased by 4.6% in science, 5.5% in engineering, and 9.6% in health (table 3). In 2024, the two fields with the most postdocs were biological and biomedical sciences (20,234) and clinical medicine (17,919). These are the only two fields employing more than 10,000 postdocs; together, they accounted for 54.6% of all postdoctoral employment.
Several broad fields had notable 1-year changes in the number of postdocs from 2023 to 2024. In the science fields, agricultural and veterinary sciences increased by 9.2%, multidisciplinary and interdisciplinary sciences increased by 7.4%, social sciences increased by 6.6%, and geosciences, atmospheric, and ocean sciences increased by 6.5%. In engineering fields, mechanical engineering increased by 10.8% and civil, environmental, transportation, and related engineering fields increased by 9.0%. In the health fields, both clinical medicine (9.3%) and other health (11.8%) increased. All other subfields rose as well, with the exception of aerospace, aeronautical, and astronautical engineering (-3.1%) and industrial, manufacturing, systems engineering, and operations research (-4.7%).
From 2020 to 2024, NFR employment increased by 18.5%, and between 2023 and 2024, it rose by 2.3% (from 34,342 to 35,142), which is the most NFRs ever reported to the GSS (table 3 and data tables: table 1-1). The overall growth in NFRs was due to a 10.6% increase in the health fields. Specifically, clinical medicine grew by 820 NFRs. Similar to postdoc appointments, biological and biomedical sciences and clinical medicine were the two largest fields, employing about half (49.6%) of NFRs reported in the GSS (data tables: data table 2-1). The number of postdocs and NFRs in the social sciences increased in every year from 2020 to 2024, even as doctoral enrollment declined (table 2 and table 3).
Demographics of Postdocs
Between 2023 and 2024, the number of postdocs increased or remained stable in all racial and ethnic subgroups except for Native Hawaiians and Other Pacific Islanders (table 4). In 2024, 58.3% of postdocs were temporary visa holders, similar to the 57.9% in 2023 (data tables: table 1-7). Temporary visa–holding postdocs increased 6.8% (from 38,149 to 40,746) from 2023 to 2024, with similar count increases for both male and female postdocs (1,303 and 1,294, respectively). Female postdocs who held temporary visas increased by 8.6% from 2023 to 2024 and 24.2% from 2020 to 2024, with male postdocs on temporary visas experiencing smaller percentage growth in these two periods (5.7% and 7.9%, respectively).
a Race and ethnicity data are available for U.S. citizens and permanent residents only.
National Center for Science and Engineering Statistics, Survey of Graduate Students and Postdoctorates in Science and Engineering.
The number of U.S. citizen and permanent resident postdocs increased by 5.2% (from 27,701 to 29,131) between 2023 to 2024, although overall counts declined by 2.5% since 2020 (table 4). Among U.S. citizen and permanent resident postdocs, the number of women grew by 7.2% and the number of men increased by 3.3%. Among U.S. citizens and permanent residents, the number of female postdocs was similar in 2024 and 2020, whereas the number of male postdocs declined by 5.1% to 14,790 during this period.
Data Sources and Limitations
Conducted since 1966, the GSS is an annual survey of all academic institutions in the United States that grant research-based master’s or doctoral degrees in SEH fields. The 2024 GSS collected data from 23,121 organizational units (departments, programs, affiliated research centers, and health care facilities) at 635 eligible institutions and their affiliates in the United States, Puerto Rico, and Guam. The unit response rate was 97.8%, and the 2024 GSS institutional response rate was 93.7%; an overview of the survey is available at https://ncses.nsf.gov/surveys/graduate-students-postdoctorates-s-e.
In summer 2024, the GSS conducted a comprehensive eligibility review of institutions with six or fewer organizational units in the 2023 GSS. As a result of the eligibility review, 53 institutions were identified as no longer offering research-based master’s or doctoral programs in GSS fields and thus no longer GSS eligible. In 2023, these institutions reported 0.8% of graduate students, including 1.3% of master’s students, under 0.1% of doctoral students, postdoctoral appointees, and doctorate-holding NFRs. Thus, the tables in this InfoBrief show both the published (2023) and adjusted (2023adjusted) GSS counts, whereas the discussion focuses on the 2023 adjusted values only. This adjustment allows for more accurate comparisons between 2023 and 2024 data and prevents attributing changes in trends due to the eligibility review to 2024. For more information on the eligibility review and the impact on the GSS, see the 2024 survey’s Technical Notes and the publication Impact of the 2024 GSS Institutional Eligibility Review on Counts of GSS Master’s Students.
In 2020, the GSS amended its taxonomy to align with a revised NCSES Taxonomy of Disciplines (TOD) and 2020 National Center for Education Statistics (NCES) Classification of Instructional Programs (CIP). As such, these changes did not lead to a large shift in overall reported GSS counts, and data remain comparable to data from 2017 to 2019. New CIP codes, such as data science and medical clinical sciences were added, along with other CIP codes in the GSS-eligible series; although these CIP codes are newly eligible, a review of unit names from prior years indicates that many of them were being reported prior to 2020. Some additional adjustments in the GSS reporting taxonomy allow for additional detail in some fields based on the 2020 CIP codes reported to GSS. Finally, similar to the structure for science and health in the GSS taxonomy, engineering was reorganized to report broad fields. For more information about the 2020 GSS taxonomy change, see the 2020 data tables: table A-17, table A-18a, and table A-18b.
GSS health fields are collected under the advisement of NIH. These GSS fields are about a third of all health fields in the Department of Education’s CIP taxonomy. NIH information on trends seen within these selected health fields can be found at https://report.nih.gov/nihdatabook/.
The full set of data tables from the 2024 survey is available at https://ncses.nsf.gov/surveys/graduate-students-postdoctorates-s-e. Data are also available in NCSES’s interactive data tool (https://ncsesdata.nsf.gov/builder/gss). For more information about the survey, contact NCSES.
Notes
1 National Center for Science and Engineering Statistics (NCSES). 2021. Universities Report Growth in U.S. Citizen and Permanent Resident Enrollment Along with Declines in Enrollment of Temporary Visa Holders at Master’s and Doctoral Levels Due to the COVID-19 Pandemic. NSF 22-313. Alexandria, VA: U.S. National Science Foundation. Available at https://ncses.nsf.gov/pubs/nsf22313.
2 National Center for Science and Engineering Statistics (NCSES). 2025. Impact of the 2024 GSS Institutional Eligibility Review on Counts of GSS Master’s Students. NSF 25-346. Alexandria, VA: U.S. National Science Foundation. Available at https://ncses.nsf.gov/pubs/nsf25346.
3 National Center for Science and Engineering Statistics (NCSES). 2022. Survey of Graduate Students and Postdoctorates in Science and Engineering. NSF 22-319. Alexandria, VA: U.S. National Science Foundation. Available at https://ncses.nsf.gov/pubs/nsf22319.
Suggested Citation
National Center for Science and Engineering Statistics (NCSES). 2026. Postdoctoral Appointments Rise While Graduate Enrollment Slows. NSF 26-308. Alexandria, VA: U.S. National Science Foundation. Available at https://ncses.nsf.gov/pubs/nsf26308.
Contact Us
National Center for Science and Engineering Statistics
Directorate for Social, Behavioral and Economic Sciences
U.S. National Science Foundation
Alexandria, VA 22314
Tel: (703) 292-8780
FIRS: (800) 877-8339
TDD: (800) 281-8749
E-mail: ncsesweb@nsf.gov