An official website of the United States government


First-Time, Full-Time Enrollment in Master’s and Doctoral Programs Declined in Science, Engineering, and Health Fields in 2025
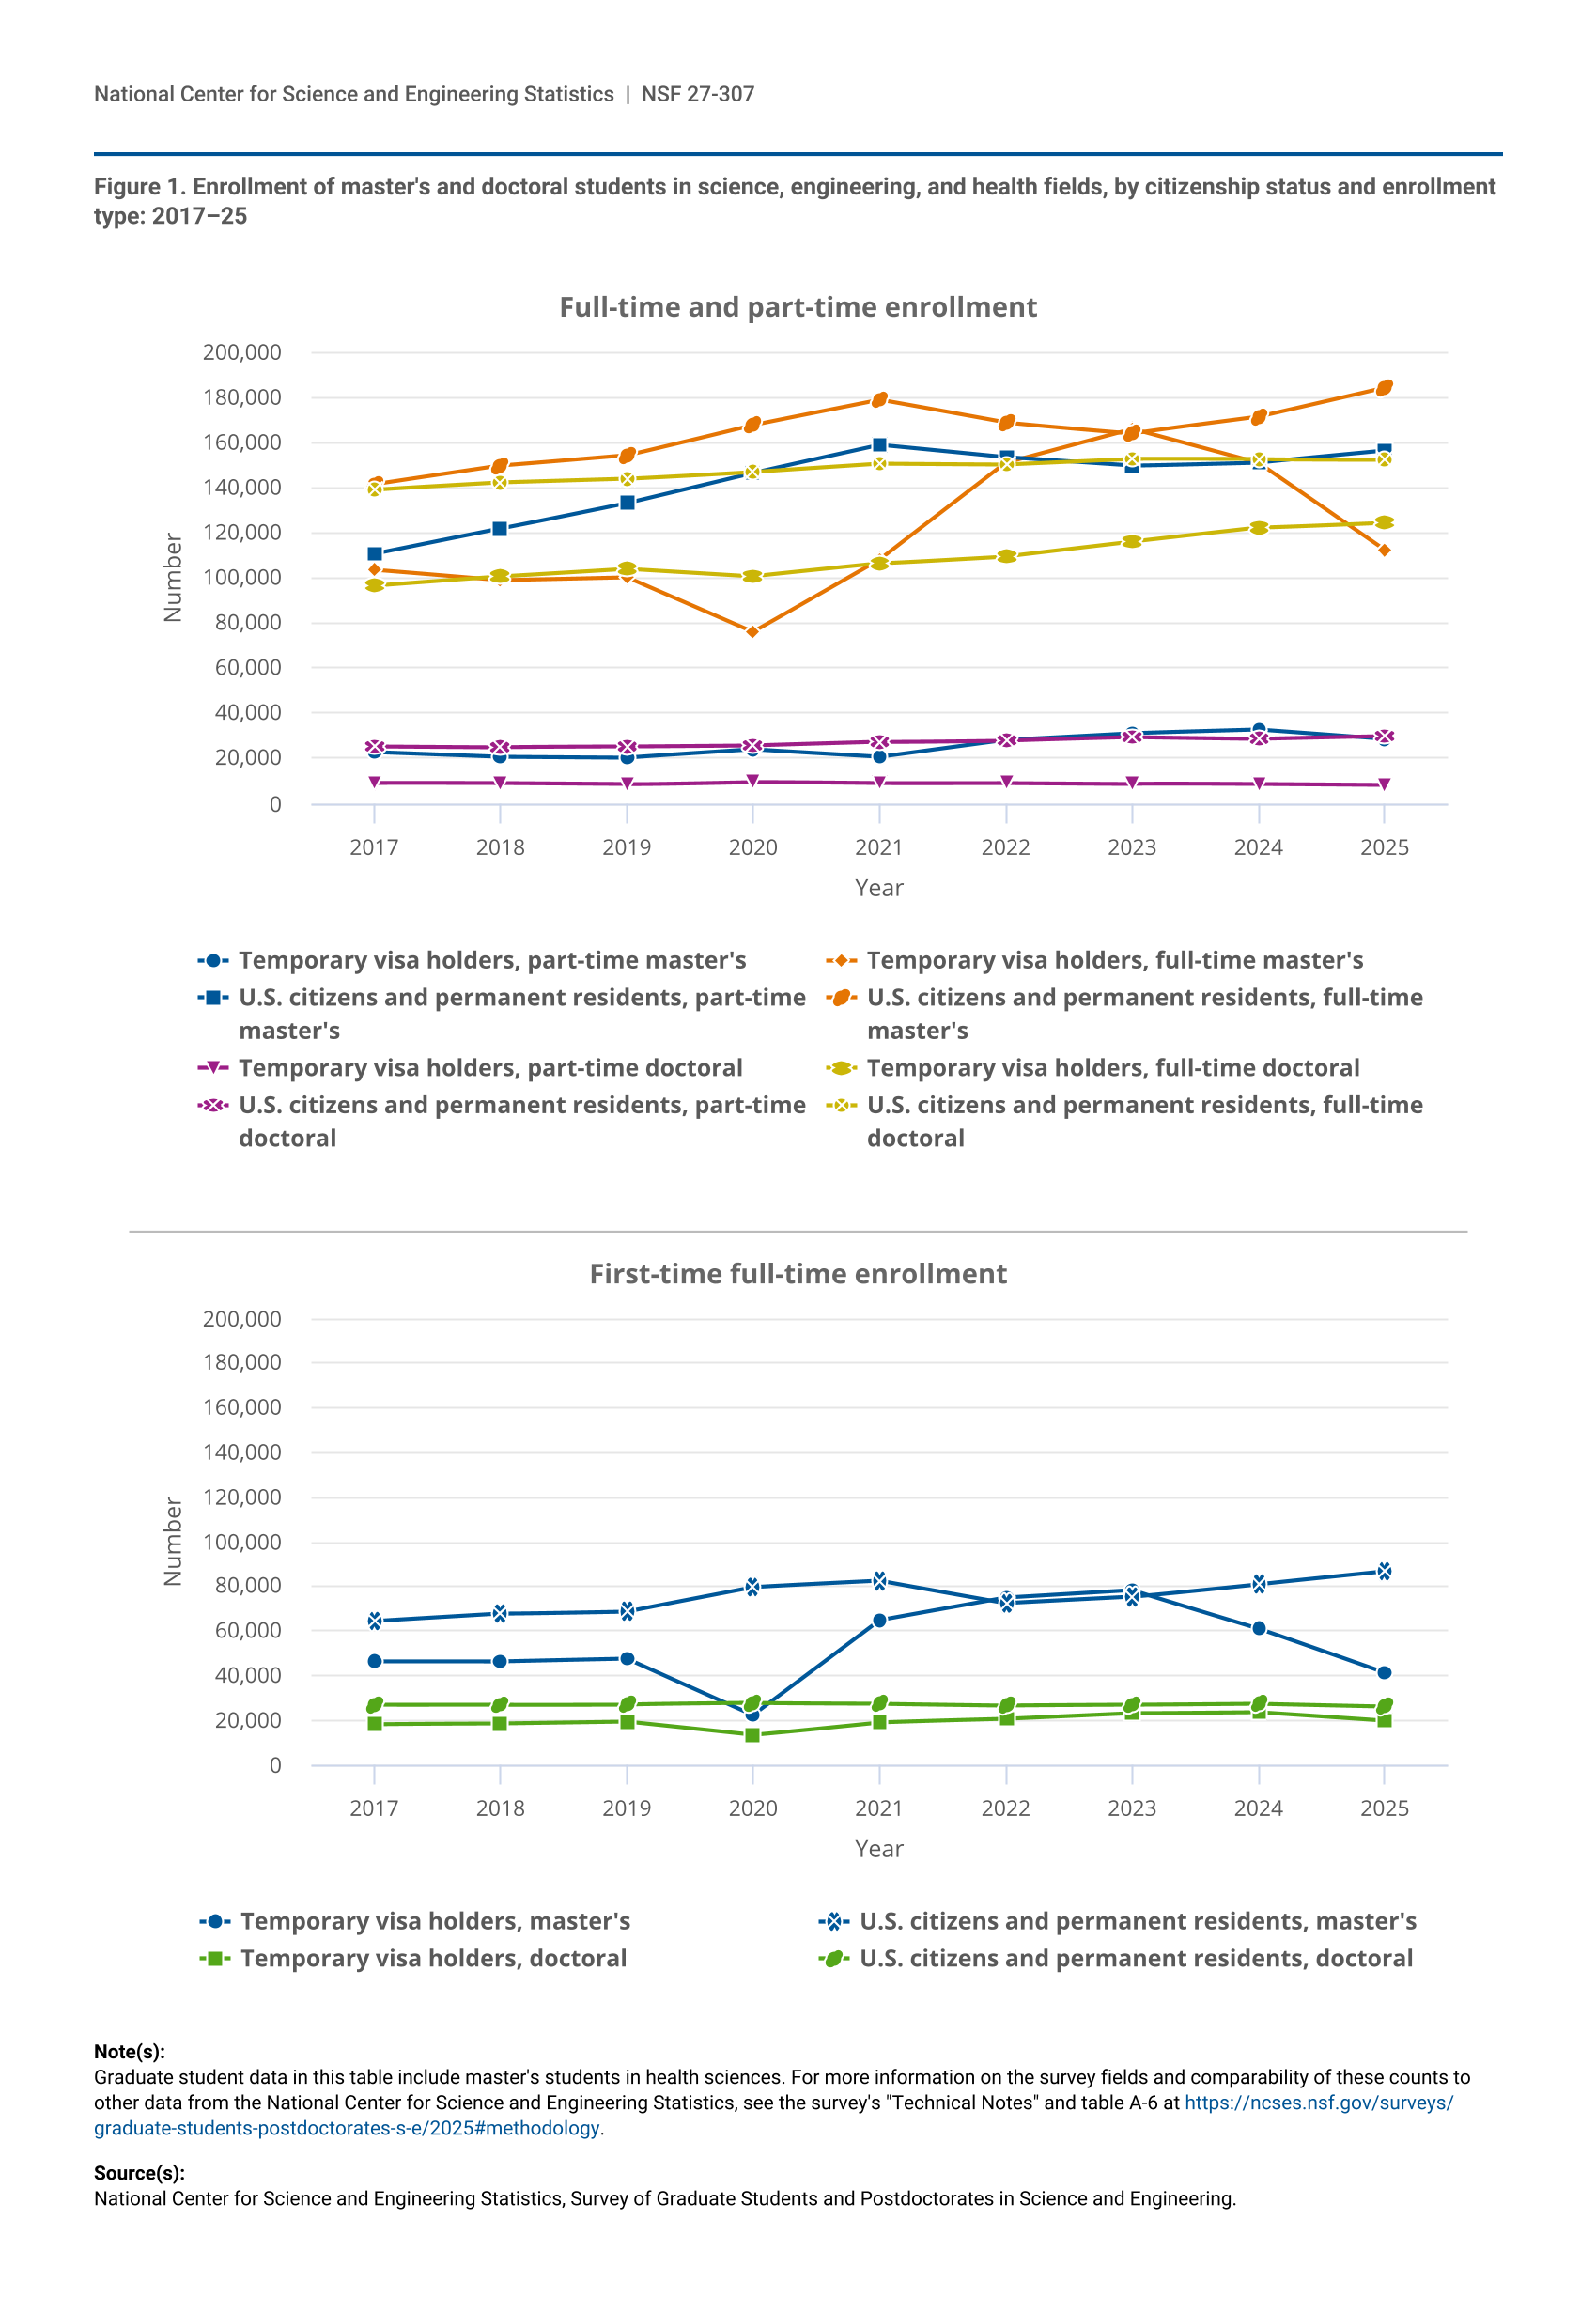
From 2024 to 2025, the overall number of graduate students in science, engineering, and health (SEH) fields decreased by 2.7%, from 818,078 to 796,304 (figure 1). This decline was largely driven by decreases in the number of master’s degree students, particularly in the number of first-time, full-time temporary visa holders. The overall number of master’s degree students decreased by 4.9%, from 505,930 in 2024 to 481,206 in 2025, with a 10.0% decline in first-time, full-time master’s degree students (table 1). Similarly, first-time, full-time doctoral enrollment declined by 9.9% during this time, although overall and full-time doctoral enrollment was stable, increasing 0.9% and 0.8%, respectively.
| Year | Temporary visa holders, part-time master's | Temporary visa holders, full-time master's | U.S. citizens and permanent residents, part-time master's | U.S. citizens and permanent residents, full-time master's | Temporary visa holders, part-time doctoral | Temporary visa holders, full-time doctoral | U.S. citizens and permanent residents, part-time doctoral | U.S. citizens and permanent residents, full-time doctoral |
|---|---|---|---|---|---|---|---|---|
| 2017 | 23,002 | 103,689 | 110,575 | 141,321 | 9,239 | 96,701 | 25,508 | 139,077 |
| 2018 | 20,902 | 99,019 | 121,757 | 149,533 | 9,066 | 100,739 | 25,133 | 142,158 |
| 2019 | 20,516 | 100,342 | 133,180 | 154,190 | 8,652 | 104,103 | 25,327 | 143,807 |
| 2020 | 24,080 | 76,093 | 146,539 | 167,766 | 9,861 | 100,728 | 25,818 | 146,928 |
| 2021 | 20,816 | 108,142 | 158,843 | 178,812 | 9,271 | 106,330 | 27,403 | 150,539 |
| 2022 | 28,348 | 150,958 | 153,345 | 168,660 | 9,395 | 109,534 | 28,145 | 150,149 |
| 2023 | 31,305 | 165,952 | 149,590 | 164,019 | 9,023 | 116,007 | 29,589 | 152,610 |
| 2024 | 32,860 | 150,855 | 151,033 | 171,182 | 8,675 | 122,179 | 28,872 | 152,422 |
| 2025 | 28,673 | 112,205 | 156,232 | 184,096 | 8,241 | 124,524 | 30,020 | 152,313 |
| Year | Temporary visa holders, master's | U.S. citizens and permanent residents, master's | Temporary visa holders, doctoral | U.S. citizens and permanent residents, doctoral |
|---|---|---|---|---|
| 2017 | 46,467 | 64,513 | 18,275 | 26,902 |
| 2018 | 46,393 | 67,821 | 18,501 | 27,009 |
| 2019 | 47,610 | 68,897 | 19,348 | 27,177 |
| 2020 | 22,381 | 79,715 | 13,429 | 27,744 |
| 2021 | 64,825 | 82,441 | 19,155 | 27,515 |
| 2022 | 74,913 | 72,404 | 20,658 | 26,758 |
| 2023 | 78,309 | 75,236 | 23,204 | 27,049 |
| 2024 | 61,263 | 81,016 | 23,756 | 27,565 |
| 2025 | 41,360 | 86,733 | 19,915 | 26,349 |
Graduate student data in this table include master's students in health sciences. For more information on the survey fields and comparability of these counts to other data from the National Center for Science and Engineering Statistics, see the survey's "Technical Notes" and table A-6 at https://ncses.nsf.gov/surveys/graduate-students-postdoctorates-s-e/2025#methodology.
National Center for Science and Engineering Statistics, Survey of Graduate Students and Postdoctorates in Science and Engineering.
a Race and ethnicity data are available for U.S. citizens and permanent residents only. Hispanic or Latino may be any race; race categories exclude Hispanic origin.
National Center for Science and Engineering Statistics, Survey of Graduate Students and Postdoctorates in Science and Engineering.
In 2025, doctoral enrollment reached 315,098, the most ever reported to the Survey of Graduate Students and Postdoctorates in Science and Engineering (GSS). Declines in the number of graduate students enrolled in SEH programs were larger for temporary visa holders than for U.S. citizens and permanent residents. From 2024 to 2025, 19,903 fewer temporary visa holders began full-time master’s degree programs (decrease of 32.5%) and 3,841 fewer temporary visa holders began full-time doctoral programs (down 16.2%) in SEH (table 1 and figure 1).
These and other findings in this InfoBrief are from the 2025 GSS. Data from the GSS provide insight into the composition of the current and future science and engineering workforce by collecting data on graduate students, postdoctoral appointees (postdocs), and doctorate-holding nonfaculty researchers (NFRs) in SEH fields. This survey is funded by the National Center for Science and Engineering Statistics (NCSES) within the U.S. National Science Foundation and by the National Institutes of Health (NIH).
Trends in Graduate Enrollment, by Enrollment Intensity and Citizenship Status
In 2025, 296,301 students were enrolled in full-time master’s programs, down 8.0% from the 322,037 enrolled in 2024 (table 1). First-time, full-time master’s enrollment declined for the second year in a row, with fewer students beginning training in SEH, or a smaller pipeline of future SEH workers. The 10.0% decline in first-time, full-time students from 2024 to 2025, from 142,279 to 128,093 students, follows a drop of 7.3% from 2023 to 2024, from 153,545 to 142,279. Even with declining enrollment for the last 2 years, full-time master’s degree enrollment increased by 3.3% from 2021 to 2025, with a peak of 329,971 students in 2023. In contrast to full-time enrollment, part-time master’s degree enrollment remained stable, increasing by a modest 0.6% from 2024 to 2025 to 184,905 students and increasing by 2.9% from 2021 to 2025. Part-time doctoral enrollment increased by 1.9% from 2024 to 2025, from 37,547 to 38,261, whereas full-time doctoral enrollment remained stable during this period, increasing by a modest 0.8%, from 274,601 to 276,837.
Although full-time master’s degree enrollment declined from 2024 to 2025, full-time doctoral degree enrollment remained stable in 2025 after several years of growth. From 2021 to 2025, overall, doctoral enrollment increased 7.3% to 315,098 students, the highest number ever reported to the GSS (table 1; figure 1). Yet first-time, full-time doctoral enrollment declined by 9.9% from 2024 to 2025 to 46,264 students. From 2021 to 2024, about 18% to 19% of full-time doctoral students were first-time students, but in 2025, this declined to 16.7% of doctoral students. Part-time doctoral enrollment increased by 1.9% from 2024 to 2025, from 37,547 to 38,261, and full-time doctoral enrollment remained stable during this time, increasing by 0.8% to 276,837 students.
Temporary Visa Holders
Continuing the trend that started in 2023, enrollment in SEH programs by temporary visa holders declined from 2024 to 2025, with differences across enrollment intensity and degree type—particularly, first-time, full-time enrollment (table 1). Among first-time, full-time SEH master’s degree students, 19,903 (32.5%) fewer temporary visa holders started in 2025 than in 2024. In SEH doctoral degree programs, first-time, full-time students holding temporary visas decreased 16.2% during this period (from 23,756 to 19,915).
Across degree enrollment and enrollment intensity, declines in first-time, full-time enrollment impacted overall counts in different ways. From 2024 to 2025, among temporary visa holders enrolled in master’s degree programs, the number enrolled full time decreased by 38,650 students, or 25.6%, and the number enrolled part time decreased by 4,187 students, or 12.7%. Turning to temporary visa holders in doctoral degree programs, part-time student enrollment declined by 5.0% (434 students) from 2024 to 2025, and full-time student enrollment increased by 1.9% (2,345 students). From 2021 to 2025, temporary visa holders enrolled full time in SEH doctoral programs increased 17.1% to 124,524 students.
Among temporary visa holders in SEH programs, the overall graduate enrollment trends between 2024 and 2025 described above apply for both female and male students. In full-time master’s degree programs, female enrollment declined by 24.0% (14,300 students) and male enrollment declined by 26.7% (24,350 students). Among part-time master’s degree students with temporary visas, female enrollment declined by 13.1% and male enrollment declined by 12.5%. Full-time doctoral enrollment of temporary visa holders increased by 2.8% for women and 1.4% for men, with women making up 39.1% of this group. Turning to part-time doctoral students with temporary visas, female enrollment declined by 1.4% and male enrollment declined by 7.1%.
U.S. Citizens and Permanent Residents
In contrast to the overall trend, enrollment of U.S. citizens and permanent residents in SEH master’s programs increased in 2025. First-time, full-time master’s enrollment of this group increased by 7.1% from 2024 to 2025, from 81,016 to 86,733 students, with overall full-time enrollment increasing by 7.5% to 184,096 students. Part-time enrollment in master’s programs for this group increased by 3.4% during this period to 156,232 students (table 1). These increases in these three groups of master’s students (12,914, 5,717, and 5,199, respectively) only partially offset the decline in students with a temporary visa.
The trends among doctoral students differed. The number of U.S. citizens and permanent residents enrolled full-time in SEH doctoral programs remained relatively stable, declining by 109 students, although first-time, full-time enrollment for this group declined by 4.4%, or 1,216 students. Conversely, part-time doctoral enrollment among U.S. citizens and permanent residents increased by 4.0%, or 1,148 students, during this time.
Demographic Trends in Enrollment
Between 2024 and 2025, enrollment patterns by sex varied by degree level and enrollment intensity among U.S. citizens and permanent residents. In master’s programs, male enrollment grew more than female enrollment among U.S. citizens and permanent residents, with an increase for males of 8.9% in full-time enrollment from 2024 to 2025, 8.5% in first-time, full-time enrollment, and 4.1% in part-time enrollment, compared with 6.7%, 6.0%, and 2.7%, respectively, for women. The pattern was reversed for doctoral enrollment among U.S. citizens and permanent residents. Full-time doctoral enrollment for men decreased by 1.3%, and female enrollment increased by 1.0%. However, first-time, full-time enrollment in doctoral programs decreased by 5.5% for men and by 3.5% for women. Part-time enrollment grew for men and women by 1.9% and 5.8%, respectively.
Continuing the trend that started in 2023, GSS institutions reported larger numbers and higher percentages of graduate students as race and ethnicity unknown. This presents a challenge for data users because counts by race and ethnicity may not be comparable year to year because the nonreporting of race and ethnicity to institutions may not be random across racial and ethnic groups. The number of full-time master’s degree students with unknown race and ethnicity increased by 22.3% (1,788 students) between 2024 and 2025 and by 29.4% (2,228 students) since 2021, with a 1-year change of 16.4% (632 students) and a 5-year change of 39.0% (1,258 students) for first-time, full-time students. For part-time master’s degree students, the increase in the number of students reporting race or ethnicity unknown was 12.8% (1,167 students) from 2024 to 2025 and 17.2% (1,511 students) from 2021 to 2025 (table 1). For full-time doctoral students, the number with unknown race or ethnicity increased by 15.8% (1,134 students) since 2024 and by 27.6% (1,801 students) from 2021 to 2025. Although the overall number of first-time, full-time U.S. citizen and permanent resident doctoral students declined, the number of students reported as race or ethnicity unknown increased by 4.3% (64 students). Part-time doctoral students’ 1-year percentage change in the number of students reporting unknown race and ethnicity was 30.0% (555 students), and it was 64.5% (942 students) over the 5-year period.
Field of Study Trends for Master’s and Doctoral Students
Although overall counts of students in SEH fields of study decreased by 24,724 in master’s degree programs and remained stable for doctoral degree programs from 2024 to 2025, this trend varied across fields. Master’s degree enrollment decreased in science fields by 5.7%, in engineering fields by 4.3%, and in health fields by 1.1% during this period (table 2). Doctoral enrollment increased slightly in science (1.3%) and remained stable in engineering and health, rising 0.2% and 0.6%, respectively.
For more information on the mapping of fields and codes in the Survey of Graduate Students and Postdoctorates in Science and Engineering, see table A-6 at https://ncses.nsf.gov/surveys/graduate-students-postdoctorates-s-e/2025#technical-tables.
National Center for Science and Engineering Statistics, Survey of Graduate Students and Postdoctorates in Science and Engineering (GSS).
Master’s Enrollment Trends by Field
As in previous years, computer and information sciences remains the largest broad field in the GSS, with 24.1% of master’s degree students in 2025 (table 2; see survey data tables: table 2-7). From 2021 to 2023, computer and information sciences grew 40.4%. In 2024, however, master’s degree enrollments in computer and information sciences declined for the first time since 2021, and this trend continued through 2025. Enrollment in this field decreased by 21,466 students, or 15.6%, from 2024 to 2025.
From 2021 to 2025, master’s degree enrollment in a few fields—such as biological and biomedical sciences and aerospace, aeronautical, and astronautical engineering, with total increases of 11.8% and 17.7%, respectively—grew consistently each year (table 2). During this 5-year period, the largest numeric and percentage increase was in multidisciplinary and interdisciplinary sciences enrollment, with a 119.1% increase (from 11,994 to 26,282 students). Within multidisciplinary and interdisciplinary sciences, data science and analytics drove this growth (table 2; also see survey data tables: table 1-2).
Among engineering broad fields, only three fields increased enrollment for master’s degrees from 2024 to 2025: aerospace, aeronautical, and astronautical engineering (7.2%); biological, biomedical, and biosystems engineering (4.0%); and metallurgical, mining, materials, and related engineering (3.8%). All the remaining engineering subfields either remained stable or declined, with industrial, manufacturing, systems engineering, and operations research having the largest percentage decline (7.3%) and electrical, electronics, communications, and computer engineering having the largest numeric decline (2,095 students). Health enrollment continued to decline, with a 1.1% decline between 2024 and 2025, mostly due to declining enrollments in clinical medicine and public health (5.5%).
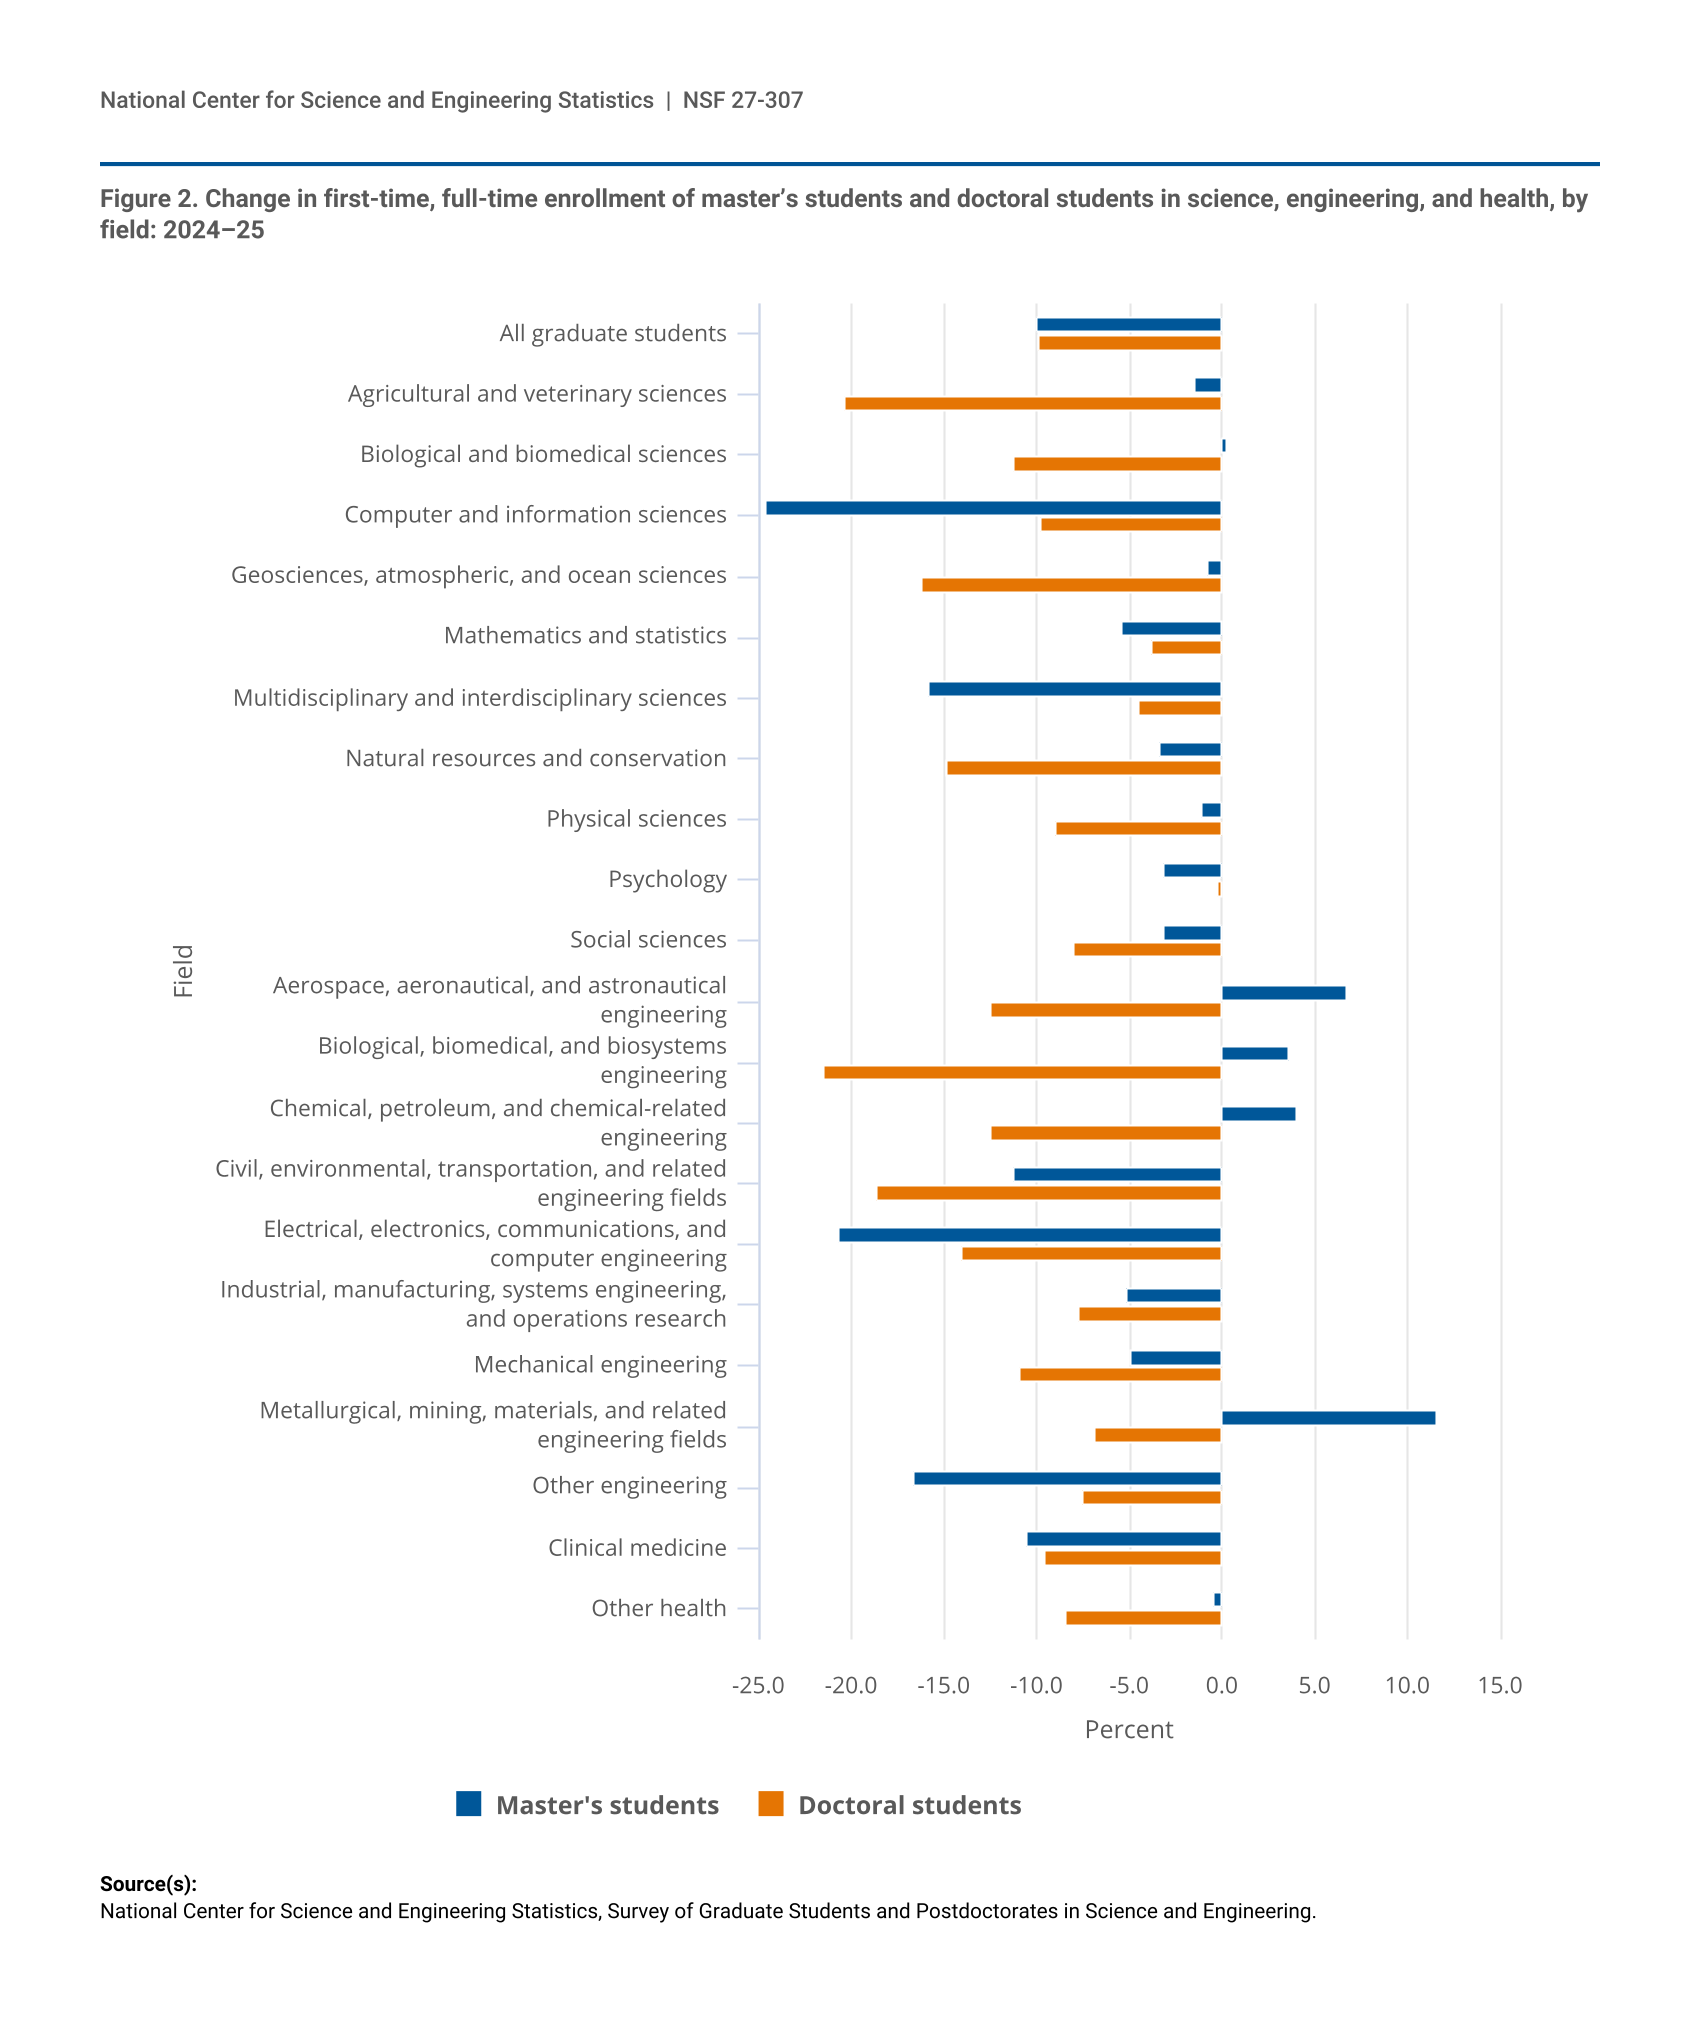
First-time, full-time master’s enrollment declined across most fields, with 14,186 fewer students enrolled in 2025 than in 2024 (table 1 and table 2). First-time, full-time master’s enrollment in computer and information sciences had the largest decline in the number of students (24.6%), followed by electrical, electronics, communications, and computer engineering (20.7%) (figure 2). Counter to the overall trend, master’s first-time, full-time enrollment increased across four smaller engineering fields from 2024 to 2025: aerospace, aeronautical, and astronautical engineering (6.7%); biological, biomedical, and biosystems engineering (3.6%); chemical, petroleum, and chemical-related engineering (4.1%); and metallurgical, mining, materials, and related engineering fields (11.6%).
| Field | Master's students | Doctoral students |
|---|---|---|
| All graduate students | -10.0 | -9.9 |
| Agricultural and veterinary sciences | -1.5 | -20.3 |
| Biological and biomedical sciences | 0.2 | -11.2 |
| Computer and information sciences | -24.6 | -9.8 |
| Geosciences, atmospheric, and ocean sciences | -0.8 | -16.2 |
| Mathematics and statistics | -5.4 | -3.8 |
| Multidisciplinary and interdisciplinary sciences | -15.8 | -4.5 |
| Natural resources and conservation | -3.4 | -14.8 |
| Physical sciences | -1.1 | -9.0 |
| Psychology | -3.2 | -0.2 |
| Social sciences | -3.1 | -8.0 |
| Aerospace, aeronautical, and astronautical engineering | 6.7 | -12.5 |
| Biological, biomedical, and biosystems engineering | 3.6 | -21.5 |
| Chemical, petroleum, and chemical-related engineering | 4.1 | -12.5 |
| Civil, environmental, transportation, and related engineering fields | -11.2 | -18.6 |
| Electrical, electronics, communications, and computer engineering | -20.7 | -14.1 |
| Industrial, manufacturing, systems engineering, and operations research | -5.2 | -7.7 |
| Mechanical engineering | -5.0 | -10.9 |
| Metallurgical, mining, materials, and related engineering fields | 11.6 | -6.9 |
| Other engineering | -16.6 | -7.5 |
| Clinical medicine | -10.6 | -9.6 |
| Other health | -0.4 | -8.4 |
National Center for Science and Engineering Statistics, Survey of Graduate Students and Postdoctorates in Science and Engineering.
Doctoral Enrollment Trends by Field
In 2025, doctoral enrollment remained relatively stable, with a total count of 315,098 students across all fields (table 2). Consistent with this, 9 of 21 broad fields had stable counts between 2024 and 2025. From 2024 to 2025, enrollment in science grew by 1.3% (from 216,898 to 219,611) and was stable in engineering (76,556 doctorate students in 2025) and health (18,931 doctorate students in 2025) fields, rising a modest 0.2% and 0.6%, respectively. Over the past 5 years, however, health fields had the largest growth (13.8%), followed by science (7.7%) and engineering (5.0%).
Within science, doctoral enrollment in 8 of the 10 broad fields grew or remained stable every year between 2021 and 2025. Of the remaining science fields, psychology enrollments grew unevenly, dropping 3.9% in 2024 to 23,408 students but rebounding 6.8% in 2025 to 25,002 students. Only social sciences counts declined all years from 2021 to 2025, with an 8.3% decline in enrollment over that period, including a 2.3% decline from 2024 to 2025 (735 students). Biological and biomedical sciences enrollment remained stable (-0.1%) from 2024 to 2025 after 4 years of consistent year-over-year growth. Conversely, multidisciplinary and interdisciplinary sciences enrollment increased by 6.7% (351 students), and computer and information sciences doctoral degree enrollments grew by 4.9% (1,183 students) (table 2).
From 2024 to 2025, first-time, full-time doctoral enrollment declined in every field (figure 2; also see survey data tables: table 2-7). The largest percentage decline in the number of first-time, full-time doctoral students was in biological, biomedical, and biosystems engineering (21.5%), followed by agricultural and veterinary sciences (20.3%). Although overall doctoral enrollment did not decline between 2024 and 2025, total doctoral enrollment reported to the GSS may decline in 2026 unless first-time, full-time doctoral enrollment rebounds.
Trends in Postdoc and Nonfaculty Researcher Employment
After reaching a record high of 69,877 in 2024, the number of SEH postdocs decreased by 2.2% to 68,324 in 2025 (table 3 and table 4). However, the number of NFRs rose by 2.5% in 2025, continuing a 5-year trend of growth (table 4). NFR employment counts increased by 17.9% over the past 5 years, from 30,548 in 2021 to 36,021 in 2025, partially due to improved reporting.
a Race and ethnicity data are available for U.S. citizens and permanent residents only. Hispanic or Latino may be any race; race categories exclude Hispanic origin.
National Center for Science and Engineering Statistics, Survey of Graduate Students and Postdoctorates in Science and Engineering.
For more information on the mapping of fields and codes in the Survey of Graduate Students and Postdoctorates in Science and Engineering, see table A-6 at https://ncses.nsf.gov/surveys/graduate-students-postdoctorates-s-e/2025#technical-tables.
National Center for Science and Engineering Statistics, Survey of Graduate Students and Postdoctorates in Science and Engineering.
Demographics of Postdocs
From 2024 to 2025, the number of U.S. citizen and permanent resident postdocs increased by 1.3% (366 postdocs), and postdocs with unknown race or ethnicity grew 8.9% (328 postdocs). Postdocs in all subgroups except for Hispanic or Latino and Black or African American increased or remained stable (table 3). Among U.S. citizens and permanent residents, the number of female postdocs grew by 2.2% (313 postdocs), and the count of male postdocs remained stable, rising 0.4% (53 postdocs). As a result of the increase in the number of female postdocs, almost half (49.7%) of all U.S. citizen and permanent resident postdocs in 2025 were women.
In 2025, the number of postdocs with temporary visas declined 4.7% (1,919 postdocs), with similar percentage decreases for female and male postdocs (4.1%, or 664 female postdocs; 5.1%, or 1,255 male postdocs).
Field of Research
From 2024 to 2025, postdoctoral appointments decreased by 1.2% (469 postdocs) in science and by 5.0% (1,028 postdocs) in health, and they remained stable in engineering (table 4). In 2025, biological and biomedical sciences (20,467 postdocs) and clinical medicine (16,874 postdocs) were the only two fields employing more than 10,000 postdocs; together, they accounted for 54.7% of all postdoctoral appointments in SEH. The largest numeric change in postdocs from 2024 to 2025 was the decline of 1,045 postdocs in clinical medicine (5.8%).
In addition to clinical medicine, several broad fields had notable 1-year changes from 2024 to 2025. In science fields, the number of postdocs in psychology decreased by 14.9% (208 postdocs), in social sciences, by 6.6% (131 postdocs); in agricultural and veterinary sciences, by 5.1% (110 postdocs); and in multidisciplinary and interdisciplinary sciences, by 4.1% (43 postdocs). Each of these declines reversed a multiyear period of growth in postdoc appointments for their respective fields. In engineering fields, no field had a numeric change of more than 70 postdocs, although some fields had large percentage changes. The number of postdocs in other health also remained stable (up 0.6%).
Unlike postdoctoral appointments, NFR employment rose by 2.5% between 2024 and 2025, from 35,142 to 36,021, which is the highest number of NFRs ever reported to the GSS (table 4; see also survey data tables: table 1-1). From 2021 to 2025, the number of NFRs reported to the GSS increased by 17.9% (5,473 NFRs). Despite the overall growth in NFRs, some broad fields declined from 2024 to 2025. From 2024 to 2025, there were 73 fewer NFRs (11.2%) employed in computer and information sciences, 52 fewer NFRs (7.4%) in electrical, electronics, communications, and computer engineering, with similar count declines in psychology (decrease of 56 NFRs, or 6.3%) and social sciences (decrease of 79 NFRs, or 4.1%). Similar to postdoc appointments, biological and biomedical sciences and clinical medicine were the two largest fields, employing about half (51.0%) of NFRs in the GSS. These two fields also had the largest numeric increases in the number of NFRs reported to the GSS, with an additional 631 NFRs, or 7.3%, reported in clinical medicine, and 337 NFRs, or 3.8%, in biological and biomedical sciences (table 4).
Data Sources and Limitations
Conducted since 1966, the GSS is an annual survey of all academic institutions in the United States that grant research-based master’s or doctoral degrees in SEH fields. The 2025 GSS collected data from 23,279 organizational units (departments, programs, affiliated research centers, and healthcare facilities) at 635 eligible institutions and their affiliates in the United States, Puerto Rico, and Guam. The institution response rate was 93.1%, and the 2025 GSS unit response rate was 97.8%; an overview of the survey including definitions of key terms is available at https://ncses.nsf.gov/surveys/graduate-students-postdoctorates-s-e/2025#methodology.
In summer 2024, the GSS conducted a comprehensive eligibility review of institutions with six or fewer organizational units in the 2023 GSS. As a result of the eligibility review, 53 institutions were identified as no longer offering research-based master’s or doctoral programs in GSS fields and thus were no longer GSS eligible. In 2023, these institutions reported 0.8% of graduate students, including 1.3% of master’s students and under 0.1% of doctoral students, postdoctoral appointees, and NFRs. For more information on the eligibility review and the impact on the GSS, see the 2024 survey “Technical Notes” and the publication Impact of the 2024 GSS Institutional Eligibility Review on Counts of GSS Master’s Students.
GSS health fields are collected under the advisement of NIH. These GSS fields are about a third of all health fields in the Department of Education’s Classification of Instructional Programs taxonomy. NIH information on trends seen within these selected health fields can be found at https://report.nih.gov/nihdatabook/.
The full set of data tables from the 2025 survey is available at https://ncses.nsf.gov/surveys/graduate-students-postdoctorates-s-e/2025#data. Data are also available in NCSES’s interactive data tool (https://ncsesdata.nsf.gov/builder/gss). For more information about the survey, contact NCSES.
NCSES has reviewed this product for unauthorized disclosure of confidential information and approved its release (NCSES-DRN26-047).
Suggested Citation
National Center for Science and Engineering Statistics (NCSES). 2026. First-Time, Full-Time Enrollment in Master’s and Doctoral Programs Declined in Science, Engineering, and Health Fields in 2025. NSF 27-307. Alexandria, VA: U.S. National Science Foundation. Available at https://ncses.nsf.gov/pubs/nsf27307/.
Contact Us
National Center for Science and Engineering Statistics
Directorate for Social, Behavioral and Economic Sciences
U.S. National Science Foundation
Tel: (703) 292-8780
FIRS: (800) 877-8339
TDD: (800) 281-8749
Email: ncsesweb@nsf.gov