 An official website of the United States government

An Occupational Approach to Analyzing Regional Invention
Disclaimers
Working papers are intended to report exploratory results of research and analysis undertaken by the National Center for Science and Engineering Statistics. Any opinions, findings, conclusions, or recommendations expressed in this working paper do not necessarily reflect the views of the National Science Foundation. This working paper has been released to inform interested parties of ongoing research or activities and to encourage further discussion of the topic.
Any views, findings, or opinions expressed in this paper are solely those of the authors. They do not reflect any official position of the Food and Drug Administration or the Department of Health and Human Services.
Abstract
The purpose of this working paper is to refine and evaluate the occupation-driven approach for analyzing regional invention suggested by Wojan, Dotzel, and Low (2015), who argue that patenting rates should be computed on the subset of workers that might plausibly contribute to patenting. We introduce several modifications to their original analysis, including use of a special tabulation of more detailed occupation data and added controls for regional characteristics that could confound identification of the inventive class—the group of occupations most associated with patent production. We then critically evaluate the findings by implementing a simultaneous equations model of the interrelationship between the composition and productivity of the inventive class. Substitutions of alternative subpopulations of knowledge workers such as the college-educated population for the inventive class allow us to assess the value added of the updated inventive class construct. Simultaneous equations results confirm the existence of an interrelationship between patent production and membership in the inventive class in rural regions and highlight an apparent disarticulation of inventive employment and patent-intensive manufacturing employment in urban areas.
Introduction
Though not escaping criticism, patents per capita has endured as the default metric for regional inventive capacity for the past 30 years, a dependence that can largely be credited to the absence of a compelling alternative (Galindo-Rueda 2013; Usai 2011; Krammer 2009; Organisation for Economic Co-operation and Development [OECD] 2009, 2010; Carlino, Chatterjee, and Hunt 2007; Griliches 1990). As the inventive capacity of regions becomes more central to understanding the innovation economy, a metric of convenience may impose significant costs. In the past decade, patenting productivity in the United States, measured as number of patents granted to American inventors per capita, has reached levels rivaling those seen during the Industrial Revolution and post–Civil War era (Rothwell et al. 2013). Continued reliance on patents per capita will erroneously discount the patenting productivity of regions highly amenable to less-patentable ventures, such as tourism and the arts, while unquestionably exalting the patenting prowess of high-technology clusters with workforces dominated by inventive workers.
If patenting is largely reliant on occupation-specific human capital, then a valid analysis of the phenomenon should incorporate this fundamental input. In a 2015 publication, Wojan, Dotzel, and Low draw a parallel between demography and the economics of invention to illuminate this argument. Just as a fertility rate is calculated on a denominator of women of child-bearing age, a regional patenting rate should be computed on the subset of the population that might plausibly contribute to patenting. Identifying that subset—an inventive class—is done empirically using an iterative regression technique to uncover the occupations strongly associated with patent production. This parallel to demography extends to traditional standardization and decomposition techniques that distinguish between scale- and productivity-based differences in patent production across regions.
In this study, we introduce several modifications to Wojan, Dotzel, and Low’s (2015) original analysis, including use of a special tabulation of more detailed occupation data from the Census Bureau and added controls for regional characteristics that might influence local patenting productivity. We additionally limit the universe of candidate occupations for the inventive class to those for which engagement in the development, design, or creation of novel ideas by workers is sufficiently important. These changes allow for a more precise identification of the impact of occupational employment on patent production and serve to remove occupations represented in the original inventive class with no obvious connection to patenting. We further extend Wojan, Dotzel, and Low’s analysis by implementing a simultaneous equations model of the interrelationship between the composition and productivity of the updated inventive class. Substitutions of alternative subpopulations of potential inventors and contributors to the inventive process (i.e., denominators) for the inventive class allow us to further assess the value added of the updated construct.
This paper is organized as follows. The next section provides a brief review of the relevant literature on regional invention. This is followed by a redefinition of Wojan, Dotzel, and Low’s (2015) inventive class using more detailed occupation data. The updated inventive class is then used to standardize and decompose traditional population-denominated patenting rates. Analysis of the interrelationship between the composition and productivity of the inventive class and other subpopulations of knowledge workers provides an empirical evaluation of alternative regional patent indicators. Robustness checks and limitations of the analysis are addressed before concluding with a discussion of the broader implications of this research for regional invention indicators.
Summary of the Literature on Regional Invention
With the transformation from an industrial economy to an innovation economy there is increasing interest in the innovative capacity of economically lagging regions (Rodríguez-Pose and Wilkie 2019; Stephens, Partridge, and Faggian 2013; Usai 2011). Patents per capita have been used to investigate the heterogeneity of the innovation process across regions to assess the viability of extending innovation policy—possibly customized to different regional types—to all areas (Apa et al. 2018). Establishing the construct validity of variables used to measure innovative capacity would appear to be a requisite first step in advancing this policy debate.
Most of the criticism regarding patents per capita as a metric for innovative capacity, defined by Furman, Porter, and Stern at the national level as “the ability of a country to produce and commercialize a flow of innovative technology over the long term” (2002:889), has been directed at the numerator—that is, patents. Carlino and Kerr (2014) argue that patents may be a poor measure of innovative activity because they represent only an initial step toward innovation and are not necessarily exploited in the region they are produced (Feldman and Kogler 2010; Feldman 1994). Furthermore, most patents have little economic impact (Carlino and Kerr 2014), and not all innovation is patentable (Griliches 1990), such as innovation in services and marketing (OECD 2009). Even in the most highly patented industry of manufacturing, trade secrets and lead-time advantages are more frequently used to protect intellectual property (Cohen, Nelson, and Walsh 2000; Shackelford and Jankowski 2021).
In contrast to the numerator, few studies directly challenge the use of population as a denominator for calculating patenting rates. Morel et al. argue that patents per capita “underestimates the innovative capacity of developing countries, because it fails to detect the productivity of highly capable centers of excellence within countries with large populations” (2005:401). The illogicality of including individuals that have no likelihood of participating in a patent application in the patenting rate denominator also holds for developed countries, whose populations include many children, physical laborers, workers in service-providing industries, and retirees that are highly unlikely to patent. Predictions from the spatial division of labor—that is, of low demand for high-skilled workers in rural compared to urban areas—are borne out empirically even within highly patentable sectors (Gibbs, Kusmin, and Cromartie 2005; Wojan 1999; Massey 1995). This further diminishes the value of the patents per capita measure as a means of comparing patenting productivity across regions.
Although Carlino, Chatterjee, and Hunt acknowledge the reasonableness of an inventiveness metric based on occupations traditionally associated with patenting, they argue against this in practice because “it is not obvious what the appropriate set of occupations should be” (2007:404). Rodríguez-Pose and Wilkie (2019) acknowledge the potential problem of per capita normalization in their examination of patenting in lagging regions but find that their population-denominated results are robust to limiting the denominator to the labor force. The select studies that propose or use alternative occupational-derived denominators in place of population when computing patenting rates—such as research and development employees (Fritsch and Slavtchev 2010; Scherer 1965) and scientists and engineers (Furman, Porter, and Stern 2002; Meliciani 2000)—run the risk of being too selective in defining the inventive class and contributing to the potentially misleading result that formal R&D resources are most productive where they are rare. In line with Wojan, Dotzel, and Low’s (2015) study, our goal is to identify a denominator that better captures the variability of local inventive capacity across space.
The inductive technique aims to strike a balance between restricting the patenting rate denominator to a few select occupations with the highest propensity to patent and inundating the denominator with individuals who are highly unlikely to participate in a patent application. We focus on regional inventive capacity, acknowledging Carlino and Kerr’s (2014) argument that patent production is a poor metric for regional innovation in general. Despite their ability to represent merely one facet of the wider innovation economy, patents remain a powerful predictor of regional productivity growth, low unemployment rates, and the formation of publicly traded firms (Rothwell et al. 2013). Our main hypothesis is that a refined, inductively identified denominator will better capture the geographical variability of local inventive capacity, compared to the more traditional per capita measure, and draw a more accurate picture of invention across space.
Redefining the Inventive Class Using Detailed Occupation Data
Data and methodology
To identify the detailed Census occupations strongly related to patent production, we modify Wojan, Dotzel, and Low’s “hybrid rational/inductive approach” (2015:539), regressing the aggregate number of patents produced in commuting zone (CZ) z during the period 2000–05 (patents) on the share of the workforce employed in a selection of detailed Census occupations (equation 1). The hybrid approach allows us to exploit a shared understanding of core occupations in the inventive class, defined by the National Science Foundation’s (NSF)’s classification of science, engineering, and technical (SET) occupations (referred to as “scientists, engineers and technicians” by NSF) (Morrison and Green 2005) without excluding occupations demonstrating a strong association with patenting. The model is estimated at the commuting zone level to minimize discrepancies between place of work and place of residence when assigning patenting activity to regions, and rural and urban commuting zones are analyzed separately.
Equation 1

We include share of the workforce in SET occupations in each regression (SETSh) and, ultimately, all 48 SET occupations as part of our inventive class due to these occupations’ strong a priori relationship with invention. We randomly select an additional 19 non-SET occupation shares (OccSh) to include in each of 10,000 separate regressions. We select from only those non-SET occupations for which engagement in the development, design, or creation of novel ideas by workers is sufficiently important, as described below.
Descriptions of variables included in equation 1, excluding the occupation shares, with associated summary statistics, are provided in table 1. Absent from Wojan, Dotzel, and Low’s (2015) analysis but included in our regressions are 1975–1980 patent stock (PatStock), share of working-age population with a bachelor’s degree or higher (HKSh), population density (PopDens), wage-rental ratio (WageRentR), and the Department of Agriculture’s (USDA’s) Economic Research Service (ERS) natural amenity rank (NatAmen). These variables are intended to control for conditions affecting knowledge sharing and quality of life in each commuting zone that may influence patenting productivity.
Description of variables in inventive class regressions, excluding occupation shares
Note(s):
Equation 1 additionally includes categorical controls for Census region and ERS Rural-Urban Continuum Code of the commuting zone's most urban county.
Source(s):
U.S. Patent and Trademark Office; Census Bureau, 2000 Census of Population and Housing, Summary File 1 and Summary File 4; Department of Agriculture Economic Research Service, 1999.
Our hypothesis is that commuting zones with a history of patenting, as measured by patent stock, are more likely to have institutions in place and an inventive culture that supports patent production. Past discoveries in a given region provide a direct measure of the local knowledge stock that may inform and promulgate later inventions (Furman, Porter, and Stern 2002). By controlling for workforce education, we account for the human capital endowment of commuting zones, which is not necessarily interchangeable with occupational employment. A skilled workforce improves the ability of firms in a region to absorb and develop new knowledge (Cohen and Levinthal 1990). Population density serves as a proxy for agglomeration economies which may promote cooperative invention (Knudsen et al. 2008). Additionally, a number of studies find that in-person interactions play a key role in facilitating the flow of knowledge between collaborators (e.g., McCann and Simonen [ 2005 ]; Storper and Venables [ 2004 ]). Natural amenities could increase the productivity of inventive workers by driving the location choices of higher-quality workers (Guimarães, Munn, and Woodward 2015). Less speculatively, enhancement of individual creativity due to exposure to natural beauty is now supported by several statistical studies (Pasanen, Neuvonen, and Korpela 2018; Plambech and Konijnendijk van den Bosch 2015). Amenity-rich areas may also facilitate creative thought processes that are essential to finding the nonobvious solutions that characterize invention. At face value, wage-rental ratio captures cost of living in a commuting zone, but it can also be viewed as a negative proxy for amenities, both natural and man-made (Roback 1982, 1988).
Two sets of categorical variables capturing the Rural-Urban Continuum Code (RUCC) of the commuting zone’s most urban county and U.S. Census region, respectively, are additionally included in equation 1 (represented by Geo). Table 2 summarizes the land area, population, and regional distribution of the sample’s 309 urban commuting zones and 378 rural commuting zones by assigned RUCC.
Summary of commuting zones in inventive class regressions, by assigned Rural-Urban Continuum Code
Note(s):
Each commuting zone (CZ) has been assigned the Economic Research Service (ERS) RUCC (defined at the county level) associated with the CZ’s most urban county. All Hawaii and Alaskan CZs (including the Alaskan portion of CZ 171), as well as CZs 654, 646, 680, and 685, are excluded from this analysis due to missing values for one or more variables in equation 1.
Source(s):
Census Bureau, 2000 Census of Population and Housing.
To define the two patenting measures, we rely on a cross-section of an annual data set of all utility patents granted by the U.S. Patent and Trademark Office (USPTO), which geolocates inventors to their county of residence at the time of application. Although these USPTO data are available annually for years 1975–2010, reliance on a special Equal Employment Opportunity (EEO) tabulation of Census 2000 occupational data to define the occupational measures precludes a multiyear analysis. We aggregate patent data for 6 years to generate Patents and PatStock to minimize cases of nonexistent and low patent production in commuting zones. For each commuting zone, Patents represents the aggregate of utility patents awarded in years 2000–05, and PatStock represents the aggregate of utility patents awarded in years 1975–80. Employing a 6-year aggregate for our dependent variable also accounts for the time lag between patent application and granting—which is, on average, 2 years (Hall, Jaffe, and Trajtenberg 2001).
Remaining variables in equation 1 are generated based on data from the Department of Agriculture’s (USDA’s) ERS and the Census Bureau. All occupation share measures are based on a special EEO county-level tabulation of Census 2000 occupational data. Following Furman, Porter, and Stern (2002), the use of occupation data in our analysis allows us to correct for distortions caused by variability in the size of dependent population across regions. Because occupation data for subsequent years are not available to us, the analysis is cross-sectional in nature. In a departure from Wojan, Dotzel, and Low’s (2015) study, the analysis is additionally restricted to the contiguous United States because ERS does not provide natural amenity metrics for Alaska and Hawaii.
At the most detailed level, the Census 2000 Occupational Classification System provides county-level data on the number of employees in 509 occupations (Fronczek and Johnson 2003). Our analysis excludes the four military-specific Census occupations as well as legislators, postmasters and mail superintendents, and judges, magistrates, and other judicial workers because data were not provided by Census for these occupations. Of the remaining 502 occupations, 454 do not belong to the group of SET occupations used by NSF to track advancements in the innovative and inventive economy (defined as the non-SET occupations). Differing from Wojan, Dotzel, and Low (2015), only those non-SET occupations with Occupational Information Network (O*NET) Thinking Creatively (TC) “Importance” and “Level” ratings that exceed the minimum ratings across SET occupations—1.2 and 1, respectively, both for “agricultural food science technicians”—are included in the random selection procedure.
The O*NET database, sponsored by the Department of Labor’s Employment and Training Administration, is the product of nationwide survey of workers from a broad set of occupations. Each occupation in the O*NET database is associated with a set of descriptors that “defines the key features of [the] occupation as a standardized, measurable set of variables” (O*NET Resource Center 2017). O*NET provides data on 227 descriptors across six domains, including “work activities,” and, within this domain, “mental processes.” O*NET’s TC value describes one such mental process and is attributed to occupations that require workers to “develop…, design…, or creat[e] new applications, ideas, relationships, systems, or products, including artistic contributions” as part of their work activities (O*NET OnLine 2017b). Because O*NET uses the Standard Occupational Classification (SOC) System to classify occupations, it was necessary to match each three-digit Census occupation to its six-digit SOC equivalent occupation before assigning TC values. A detailed description of our Census-SOC matching methodology is available upon request.
After completing the match of the Census occupations to the SOC occupations, each Census occupations was then matched to its TC value based on archived data from O*NET OnLine, beginning with the 3.0 database, published in August 2000. If a match was not made using the 3.0 database (7% of cases), Census occupations were then matched to the 3.1 database values. Unmatched occupations were subsequently matched to TC values from the O*NET databases in chronological order, ending with database 20.3, published in April 2016.
Based on our criteria that considered non-SET occupations should have TC Importance and Level ratings at least as great as minimum ratings across SET occupations, 300 of the 454 non-SET occupations remain in the pool of selected occupations in the analysis. Following each regression, we update a collection of count variables, which record instances of inclusion for each occupation share as well as whether each occupation share coefficient is positive and significant at the 5% significance level. These measures allow us to calculate the percentage of time that an occupation share effect is positive and significant in the iterative regression analysis for rural and urban samples. To mitigate omitted variable bias, share of the workforce employed in a considered non-SET occupation for which an individual occupation share is not included is captured by the ExclSh variable in each run of the model.
Our inventive subset inclusion criteria for the non-SET occupations follow from Wojan et al.’s study (2015): those occupations associated with coefficients that are positive and significant in at least 75% of their regressions in the metro or nonmetro analysis are characterized as inventive.
Discussion of results
Of the 300 non-SET occupations included in the analysis, 11 are identified as inventive, that is, consistently associated with positive, significant coefficients (see table 3). Occupations that are strongly associated with patenting in both urban and rural commuting zones include the collection of SET occupations and also marketing managers. The coefficient estimate for engineering managers was significant in 60% of the rural equations in which it appeared and in 100% of urban equations. Occupations with a strong association to patenting in urban commuting zones include market and survey researchers, designers and technical writers, and electronics assemblers—a production occupation. Occupations with a strong association to patenting in rural commuting zones include all the remaining production occupations.
Inventive occupations
CZ = commuting zone.
Note(s):
Summaries of coefficients for the iterative regression analysis are available in Dotzel (2017:165–70).
Source(s):
Dotzel K, 2017, Three Essays on Human Capital and Innovation in the United States, PhD dissertation, Graduate School of The Ohio State University.
Several occupations found by Wojan et al. (2015) to be consistently associated with patenting in nonmetro commuting zones are not represented in our results. A number of these exclusions (e.g., “entertainers and performers,” “postsecondary teachers”) are likely due to our added controls for Census region and human capital stock: “actors” and “producers and directors,” suboccupations of “entertainers and performers,” are highly concentrated in the West Census region, while “postsecondary teachers” are concentrated in commuting zones with a high percentage of workers with bachelor’s degrees. “Printing workers” and “customer service representatives,” occupations not traditionally associated with patent production, are additionally absent from the updated inventive class. “Marketing and sales managers,” “market and survey researchers,” and “technical writers” represent new additions compared to the 2015 study. In general, it seems that the modifications made to the previous analysis are effective in removing spurious occupations with no discernible connection to patenting.
Table 4 compares patenting rates across commuting zones containing a global city; these zones are characterized by their “availability of advanced producer services essential for the global coordination of activities by multinational corporations” (Wojan et al. 2015:549). Average absolute value of the difference in patents per inventive class member rank and patents per capita rank for global city commuting zones is larger for the updated inventive class (2.3) compared to Wojan et al. (2015) (1.4). In line with the trend recognized by Wojan and colleagues (2015), commuting zones specializing in media or finance or containing high-amenity cities typically regarded as tourist and/or retirement destinations—including the cities of Los Angeles, Miami, New York, and Orlando—perform better when commuting zones are ranked by patents per inventive class member than when ranked by patents per capita. These cities additionally fall within the bottom five cities when ranked by inventive class employment share, suggesting that they are particularly disadvantaged by their small inventive class populations.
Patenting statistics for commuting zones containing global cities
a See Wojan TR, Dotzel KR, Low SA, 2015, Decomposing Regional Patenting Rates: How the Composition Factor Confounds the Rate Factor, Regional Studies, Regional Science 2(1):535–51.
Note(s):
Following Wojan, Dotzel, and Low (2015), the Aleutians West Census Area, AK, is omitted from the Seattle, WA, commuting zone. Difference in ranks column denotes the change in rank, when global city commuting zones are ranked by patents per inventive class member, between Wojan, Dotzel, and Low's (2015) study and our updated analysis.
Source(s):
U.S. Patent and Trademark Office; Census Bureau, special tabulations (2015) of the 2000 Census.
Standardization and Decomposition Analysis Using Newly Defined Inventive Class
A still underrecognized weakness of existing studies of regional invention is their general lack of acknowledgement of differences in the composition of inventive populations across space. In the field of demography, it would be unprecedented to base conclusions regarding regional fertility on a rate (e.g., number of live births divided by total population) that does not consider the size of the region’s childbearing population. As shown by Wojan et al. (2015), tools of standardization and decomposition, summarized by Das Gupta (1993) and traditionally applied in demography and other social science disciplines, can be extended to the topic of invention using our newly defined inventive class. Patents per capita for each region can be decomposed as the product of share of total population in the inventive class, known as the compositional factor, and patents produced per inventive class member, known as the rate factor (RF). This decomposition allows for standardization across compositional and RFs, that is, what observed patenting rates would look like if compositional factors—or alternatively, RFs—were identical across regions. In addition, the decomposition answers to what extent we can attribute differences in observed patenting rates across regions to variation in each of these factors.
Following Wojan et al. (2015), we first investigate how variation in population growth rates impacts the two factors’ contribution to differences in observed patenting rates. We do this by separating commuting zones that contain a global city into two groups: those ranked in the top 50% of commuting zones based on their population growth rate between 1975 and 2000, and those ranked in the bottom 50%. We then apply Das Gupta’s (1993) standardization and decomposition methodology for the two-factor, two-population case.
Results calculated using the updated inventive class in table 5, defined using the detailed Census occupations in table 3, mirror those based on the 2015 inventive class, with slight differences in magnitude of rates and percent distribution of effects. The standardization of factors calculates the per capita patenting rate that would have been observed if either the inventive class rate or inventive class composition were expressed as the average across both high-growth and low-growth cities. For example, the RF standardization demonstrates that if both groups had the same average patenting rate among inventive class members, low-growth global cities would have higher per capita patenting rates than high-growth global cities (0.0031 vs. 0.0029). Differences in the magnitudes of factors across studies suggest a smaller and more productive inventive class for global cities in the updated analysis.
The observed, population-denominated patenting rate (i.e., patents per capita) for commuting zones containing high-growth global cities is 31% higher than the rate for commuting zones with low-growth global cities. Results of the decomposition analysis tell us that 126% of the difference in patents per capita rates across the defined populations is driven by disparities in inventive class patenting productivity across regions, a smaller percentage than indicated by Wojan et al.’s (2015) results. While the observed patenting rate for high-growth global city commuting zones is highest, if inventive class productivity were consistent between the two populations, the patenting rate of low-growth global cities would dominate. The decomposition results also tell us that the high-growth population suffers based on its inventive class composition. If share of population in the inventive class were identical across groups, the gap between the groups’ patenting rates would increase. Nonetheless, the compositional disadvantage of high-growth global city commuting zones is more than offset by their productivity advantage.
Comparison of standardization and decomposition of patenting rates for global city commuting zones based on population growth rate
a See Wojan TR, Dotzel KR, Low SA, 2015, Decomposing Regional Patenting Rates: How the Composition Factor Confounds the Rate Factor, Regional Studies, Regional Science 2(1):535–51.
Note(s):
RF is patents per inventive class member, and CF is inventive class as a share of total commuting zone population. Following Wojan, Dotzel, and Low (2015), Aleutians West Census Area, AK, is omitted from the Seattle, WA, commuting zone.
Source(s):
U.S. Patent and Trademark Office; Census Bureau, special tabulations (2015) of the 2000 Census.
Next, we examine how patenting rates differ between populations defined based on level of urbanization. Following Wojan et al. (2015), we divide commuting zones into three groups—rural; urban, without a global city (UWGC); and urban, containing a global city (UCGC). For this step in the analysis, we apply Das Gupta’s two-factor, three-population standardization and decomposition methodology, which ensures that there is “only one standardized rate for a population when standardization is done with respect to the same factor” (1993:97) and that effects are internally consistent.
The results for our two-factor, three-population case based on level of urbanization are presented in table 6a and table 6b. Our results indicate that for each region-type pair, differences in the composition of inventive populations across regions are responsible for 50%–55%—that is, the majority—of the difference in population-denominated patenting rates. This contrasts with the decomposition results of Wojan et al. (2015), which identify productivity differences as the main driver of differences in observed population-denominated patenting rates for each region-type pair. While observed patents per capita rates indicate that global cities are approximately six times more productive than rural areas in producing patents, when inventive class population share is held constant across the two populations, global cities are only twice as productive. This provides compelling evidence that the composition of inventive populations across regions must be considered by researchers if meaningful conclusions are to be made concerning the inventive capacity of rural and urban regions.
Standardization of patenting rates for commuting zones based on level of urbanization
a See Wojan TR, Dotzel KR, Low SA, 2015, Decomposing Regional Patenting Rates: How the Composition Factor Confounds the Rate Factor, Regional Studies, Regional Science 2(1):535–51.
Note(s):
RF is patents per inventive class member, and CF is inventive class as a share of total commuting zone population. In a departure from Wojan, Dotzel, and Low (2015), all Hawaiian and Alaskan commuting zones (including Aleutians West Census Area, AK, part of the Seattle, WA, commuting zone) are omitted. This change results in slight discrepancies in observed patenting rates across studies.
Source(s):
U.S. Patent and Trademark Office; Census Bureau, special tabulations (2015) of the 2000 Census.
Decomposition of patenting rates for commuting zones based on level of urbanization
CF = compositional factor; RF = rate factor; UCGC = urban, containing a global city; UWGC = urban, without a global city.
a See Wojan TR, Dotzel KR, Low SA, 2015, Decomposing Regional Patenting Rates: How the Composition Factor Confounds the Rate Factor, Regional Studies, Regional Science 2(1):535–51.
Note(s):
RF is patents per inventive class member, and CF is inventive class as a share of total commuting zone population. In a departure from Wojan, Dotzel, and Low (2015), all Hawaiian and Alaskan commuting zones (including Aleutians West Census Area, AK, part of the Seattle, WA, commuting zone) are omitted. This change results in slight discrepancies in observed patenting rates across studies.
Source(s):
U.S. Patent and Trademark Office; Census Bureau, special tabulations (2015) of the 2000 Census.
Empirical Evaluation of Newly Defined Inventive Class
Two-factor decomposition of the per capita patenting rate makes it clear that continued reliance on the measure will confound our understanding of the true contributors to inventive capacity. In the extreme case, a regional policy to eliminate the social safety net plausibly could be associated with an increase in the per capita patenting rate. However, the two-factor decomposition would correctly identify the cause as an increase in the share of the population in the inventive class as the disadvantaged population is decimated. This hypothetical example calls into question the value of any finding that fails to model both the rate and compositional factors.
Data and methodology
In this exercise, we evaluate the correlates of inventive production in commuting zones and membership in our inductively defined inventive class. Contributors to the inventive process may be drawn to regions with existing inventive populations—and, likewise, support regional inventive productivity through own-invention or the dissemination of knowledge to other inventors in their region (Agrawal, Kapur, and McHale 2008; Thompson and Fox-Kean 2005; Jaffe, Trajtenberg, and Henderson 1993). Since the direction of causality between these two processes is not obvious, a simultaneous equations model is adopted. Generally, each equation in a simultaneous equations system is referred to as a structural equation. All dependent variables are assumed to be endogenous to the system, while all other variables are treated as exogenous and are taken to be instruments for the endogenous variables. Following Faggian and McCann (2009) in their study of interregional human capital flows in Great Britain, our simultaneous equations model is estimated using three-stage least squares (3SLS).
To estimate cross-sectional simultaneous equation models, limited or full information methods are available (Greene 2012). The limited information two-stage least squares (2SLS) method is most commonly used but provides inefficient parameter estimates when error terms are correlated across equations, a possibility that we have no theoretical reason to refute a priori in this case. The full-information 3SLS method, developed by Zellner and Thiel (1962), combines the traditional 2SLS procedure with seemingly unrelated regressions. Under 3SLS, the variance-covariance matrix of cross-equation error terms is estimated in the second stage and used to correct coefficient estimates; this represents the deviation from 2SLS. The 3SLS and 2SLS methods produce equivalent results when error terms are uncorrelated across equations.
Data from the Census Bureau, USDA’s ERS, Patent and Trademark Office, and Department of Justice’s (DOJ’s) Uniform Crime Reporting Statistics (DOJ 2006) are used to generate variables used in the analysis. Choice of variables mirrors those selected by Faggian and McCann (2009), with a few modifications motivated by differences in data availability and study relevance, as described below. Table 7 includes descriptions of and summary statistics for all considered variables, while pairwise correlation coefficients for these variables are presented in table 8.
Description of variables in simultaneous equations model—rural and urban commuting zones
Note(s):
Equations 2 and 3 additionally include categorical controls for Census region and ERS Rural-Urban Continuum Code of the commuting zone's most urban county.
Source(s):
U.S. Patent and Trade Organization; Census Bureau, Special Tabulation (2000), Census of Population and Housing, Summary File 1 and Summary File 4, and Shapefile; Integrated Postsecondary Education Data System, 2000; Department of Justice, 2000; Department of Agriculture Economic Research Service, 1999, 2000; Bureau of Labor Statistics, Quarterly Census of Employment and Wages, 1998; Florida R, 2002, The Rise of the Creative Class: And How It’s Transforming Work, Leisure, Community, and Everyday Life, New York: Basic Books; McGranahan D, Wojan T, 2007, Recasting the Creative Class to Examine Growth Processes in Rural and Urban Counties. Regional Studies 41(2):197–216.
Association among variables in simultaneous equations model—rural and urban commuting zones
Source(s):
U.S. Patent and Trade Organization; Census Bureau, Special Tabulation (2000), Census of Population and Housing, Summary File 1 and Summary File 4, and Shapefile; Integrated Postsecondary Education Data System, 2000; Department of Justice, 2000; Department of Agriculture, Economic Research Service, 1999, 2000; Bureau of Labor Statistics, Quarterly Census of Employment and Wages, 1998.
The first structural equation (equation 2) estimates the aggregate number of patents produced in commuting zone z during the period 2000–05 (Patents) as a function of inventive class population (IC), aggregate 1975–80 patent stock (PatStock), population density (PopDens), wage-rental ratio (WageRentR), ERS natural amenity rank (NatAmen), university R&D expenditures (UniResExp), and a location quotient for patent-intensive industries (LQPatInd). As is the case for the iterative regression analysis (equation 1), use of an aggregate patenting measure serves to minimize cases of nonexistent and low patent production in commuting zones and accounts for the time lag between patent application and granting. A commuting zone geography is also similarly adopted to minimize discrepancies between place of work and place of residence when assigning patenting activity to regions.
In the second structural equation (equation 3), commuting zone inventive class population is related to Patents, unemployment rate (UR), WageRentR, NatAmen, crime rate (Crime), proximity to an urban center (ProxUrbCen), and LQPatInd. Each structural equation additionally includes controls for ERS RUCC and Census region (in 𝑮𝒆𝒐).
Equation 2

Equation 3

The definition of our location quotient (LQ)—the ratio of the commuting zone’s share of employment to the nation’s share of employment in patent-intensive industries, as determined by the Economics and Statistics Administration and the USPTO (Department of Commerce 2012)—represents a departure from Faggian and McCann (2009), whose location quotient is defined based on employment in the wider manufacturing industry. We include LQPatInd in both structural equations because the agglomeration of workers in occupations highly amenable to patenting could concurrently affect the inventive productivity and size of the considered subpopulations. Our addition of historic patent stock to the structural equation for patents follows from equation 1.
The inclusion of a natural amenity measure in both structural equations signifies a second deviation from Faggian and McCann’s (2009) analysis. Initial consideration of favorable climate as a determinant of location choice can be traced to early studies by Graves (1979, 1980) and Carlino and Mills (1987). More recent works explore how natural amenities factor into the location choices of high-skilled workers specifically (Fiore et al. 2015; Whisler et al. 2008; Gottlieb and Joseph 2006). In addition to affecting the composition of the considered subpopulations, natural amenities may promote patent production from these workers by stimulating the creative thought processes essential to invention, as argued for equation 1 in section 3.1 (Pasanen, Neuvonen, and Korpela 2018; Plambech and Konijnendijk van den Bosch 2015). The interpretation of wage-rental ratio as a negative proxy for amenities (Roback 1982, 1988) similarly justifies its addition to equation 2.
The use of university R&D expenditures (UnivResExp) in place of the composite university, government, and private R&D expenditure measure used in McCann and Faggian (2009) is a third deviation. Data limitations in the United States relative to the European Union necessitate this choice, but UnivRevExp may be the critical component of the composite for examining rural patenting as land grant research universities in rural commuting zones may have a large impact on differential patenting rates. Studies of rural innovation (Aryal et al. 2018) and high technology manufacturing location (Woodward, Figueiredo, and Guimarães 2006) provide empirical support for this conjecture. The absence of private R&D is more of a concern in the urban commuting zone equations, where this type of expenditure is concentrated.
Although our primary motivation for this modeling exercise is to identify the correlates of regional inventive capacity, we also intend to assess the value-added of the inventive class construct by substituting three other subpopulations of knowledge workers as dependent variables in equation 3 who may potentially contribute to the patenting process for our inventive class: (1) SET workers, which Furman, Porter, and Stern (2002) include (as “scientists and engineers”) in their model of international innovative capacity; (2) Richard Florida’s (2002) creative class (CC), as recast by McGranahan and Wojan (2007); and (3) workers possessing a bachelor’s degree or higher (BA). Notably, a strong correlation between each subpopulation pair is visible in table 8, with CC and BA showing the strongest correlation in both rural and urban regions. We exclude measures of regional university quality and student density from equation 3 to isolate the impact of human capital on invention to the considered subpopulations of knowledge workers.
Based on the summary statistics in table 7, rural commuting zones produced approximately 35 patents during the period 2000–05, on average, compared to the 1,867 patents produced by each urban commuting zone. Mean populations of the considered groups of knowledge workers for urban commuting zones measured in year 2000 likewise significantly exceed those for rural commuting zones (by factors of 27, 30, 21, and 20 for inventive class, SET employment, CC, and human capital stock, respectively).
Discussion of results
Results for rural commuting zones for each structural equation, are provided in table 9, while results for urban commuting zones are provided in table 10.
Results for simultaneous equations model—rural commuting zones
* p < 0.10; ** p < 0.05; *** p < 0.01.
Note(s):
Structural equation estimates are based on 358 observations. Controls for Census region and Rural-Urban Continuum Code are included in each regression.
Source(s):
Dotzel K, 2017, Three Essays on Human Capital and Innovation in the United States, PhD Dissertation, Graduate School of The Ohio State University, p. 108.
Results for simultaneous equations model—urban commuting zones
* p < 0.10; ** p < 0.05; *** p < 0.01.
Note(s):
Structural equation estimates are based on 301 observations. Controls for Census region and Rural-Urban Continuum Code are included in each regression.
Source(s):
Dotzel K, 2017, Three Essays on Human Capital and Innovation in the United States, PhD Dissertation, Graduate School of The Ohio State University, p. 112.
For rural commuting zones, results for the first structural equation indicate that membership in each of the four considered classes of knowledge workers positively impacts patent production. Size of the SET workforce has the largest estimated effect on invention: for every 11 additional SET workers to a rural commuting zone, one patent is produced during the 6-year period of interest. Each additional SET worker’s contribution to patenting is approximately twice that of an additional worker in the inventive class: one patent is produced for every 20 additional IC workers. From a precision perspective, the IC measure in the rural patents equation is statistically more powerful than the SET measure; the p-value for the SET point estimate is approximately three times that of the IC point estimate (p-values 0.000806 and 0.000238, not shown). Workers employed in the creative class and workers possessing a bachelor’s degree have the smallest estimated impact on patent production: 50 and 63 additional creative class members and educated workers, respectively, are associated with the production of one patent. The much higher p-values for coefficients on both CC and BA in their respective regressions, compared to those for IC and SET, confirm that both measures include a good deal of information that is not relevant to patent production.
Although size of the SET workforce appears to dominate as a predictor of invention in rural regions, results for the second structural equation indicate that inventive output may have a significant role to play in supporting other groups of knowledge workers that a sole focus on SET workers obscures. For the rural sample, the production of an additional patent increases estimated employment in SET occupations by 9, inventive class membership by 13, creative class membership by 40, and educated workforce size by 60. Our results seem to confirm the existence of an interrelationship between patent production and membership in our updated inventive class.
Wage-rental ratio, which can be interpreted as a negative proxy for amenities (Roback 1982, 1988), is positively associated with patenting when the creative class or workers with a bachelor’s degree are the population of interest. Estimated effects for LQPatInd across specifications may provide insight into these results. The constructed location quotient for patent-intensive industries is associated with a significant coefficient in the BA patents specification, suggesting that the WageRentR variable may be picking up a tendency for manufacturing industries—and, more specifically, inventive industries—to concentrate in low-amenity commuting zones. The coefficient on LQPatInd is similarly positive (and relatively large in magnitude) in the creative class patents equation, though not precisely estimated. Other explanatory variables associated with significant effects in the first structural equation include PatStock and UniResExp for the inventive class specification. Insignificance of UniResExp estimates in the SET, CC, and BA patents results is notable given the policy interest in public R&D funding.
Based on the rural results for the second structural equation, WageRentR negatively impacts size of all considered populations of knowledge workers. This could be reflective of a willingness of these workers to accept lower wages or higher rents in exchange for access to amenities (e.g., dining, shopping, entertainment). The apparent ability of the inventive class to better account for the contribution of rural workers in patent-intensive industries, as evidenced by the positive and significant coefficient on LQPatInd in the second structural equation, compared to the alternative subpopulations of knowledge workers highlights its potential value to studies of rural invention. Analysis of urban commuting zones (table 10) discussed below points to regional variation in the inventive process and suggest the value of examining contributions from a wider spectrum of knowledge workers to get a complete picture of patent production.
As is the case for rural commuting zones, the subset of workers employed in SET occupations has the greatest impact on successful invention in urban commuting zones. However, the associated coefficient on SET in table 10 is only 25% larger than the coefficient on IC when the inventive class is substituted for SET workers as the population of interest (compared to the approximate 1:2 relationship that exists in rural commuting zones). In contrast to the rural results, the SET effect is more precisely estimated than the IC effect in the urban case. The magnitude of effects associated with workers employed in the creative class and workers possessing a bachelor’s degree are approximately one-third and one-fourth, respectively, of those for the inventive class and SET workforce. However, the estimated impact of creative class membership on patent production in urban regions is not precisely estimated. It is estimated that additions of 14, 11, and 48 workers to the inventive class, SET workforce, and educated workforce, respectively (and individually), contribute to the production of one patent in urban commuting zones for the period of interest.
Based on the estimated coefficients from the second structural equation, the production of an additional patent is associated with the addition of 10 workers employed in SET occupations, 14 inventive class members, 45 creative class members, and 63 educated workers to an urban commuting zone. A positive association between ERS natural amenity rank and patent production is observed in the IC and SET results, while the estimated impact of LQPatInd in the first structural equation is large and consistently positive for all considered subpopulations of knowledge workers in the urban case.
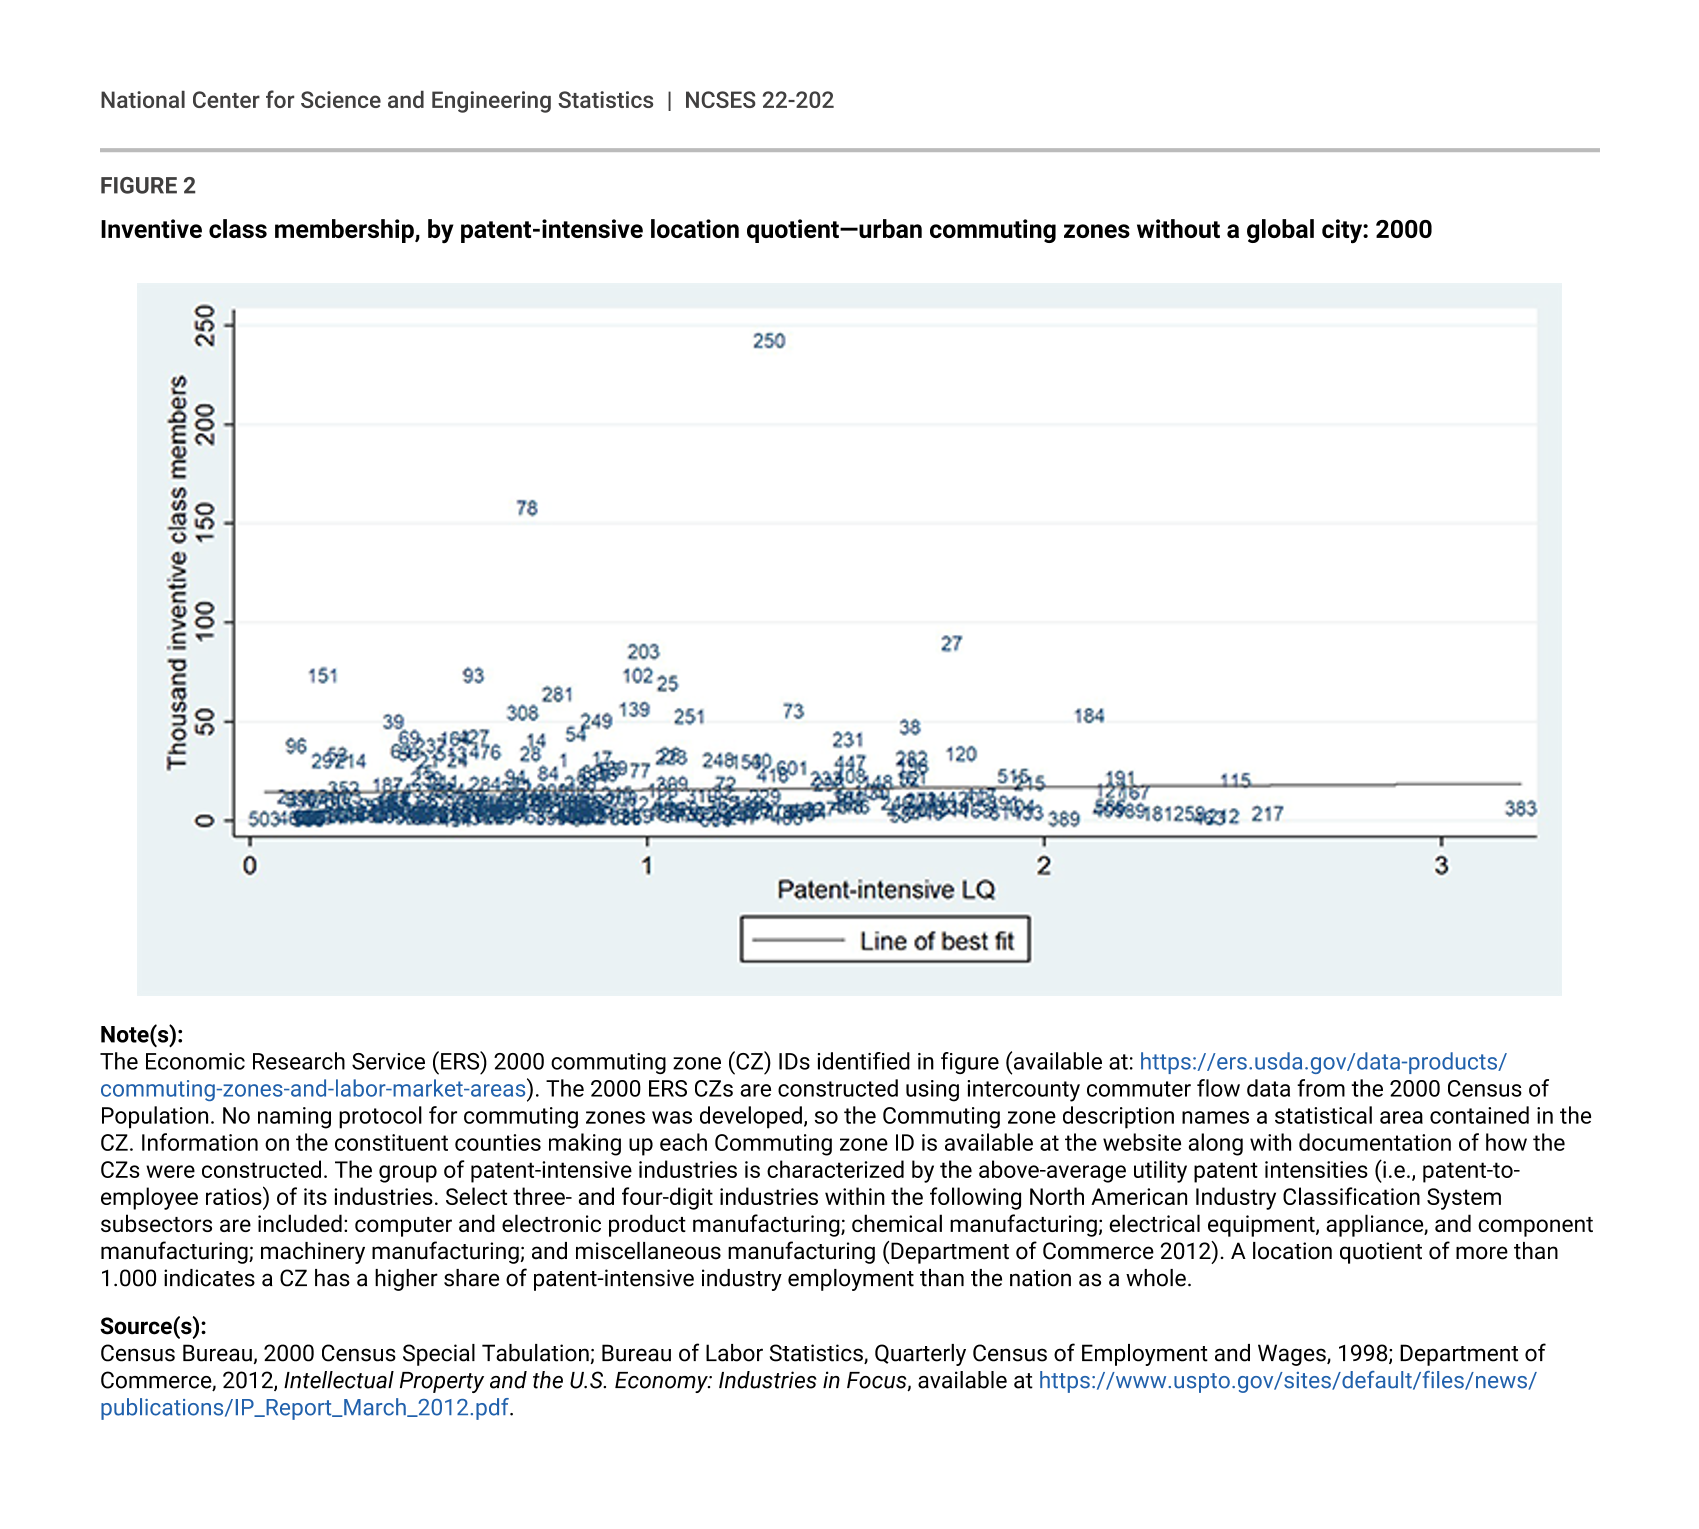
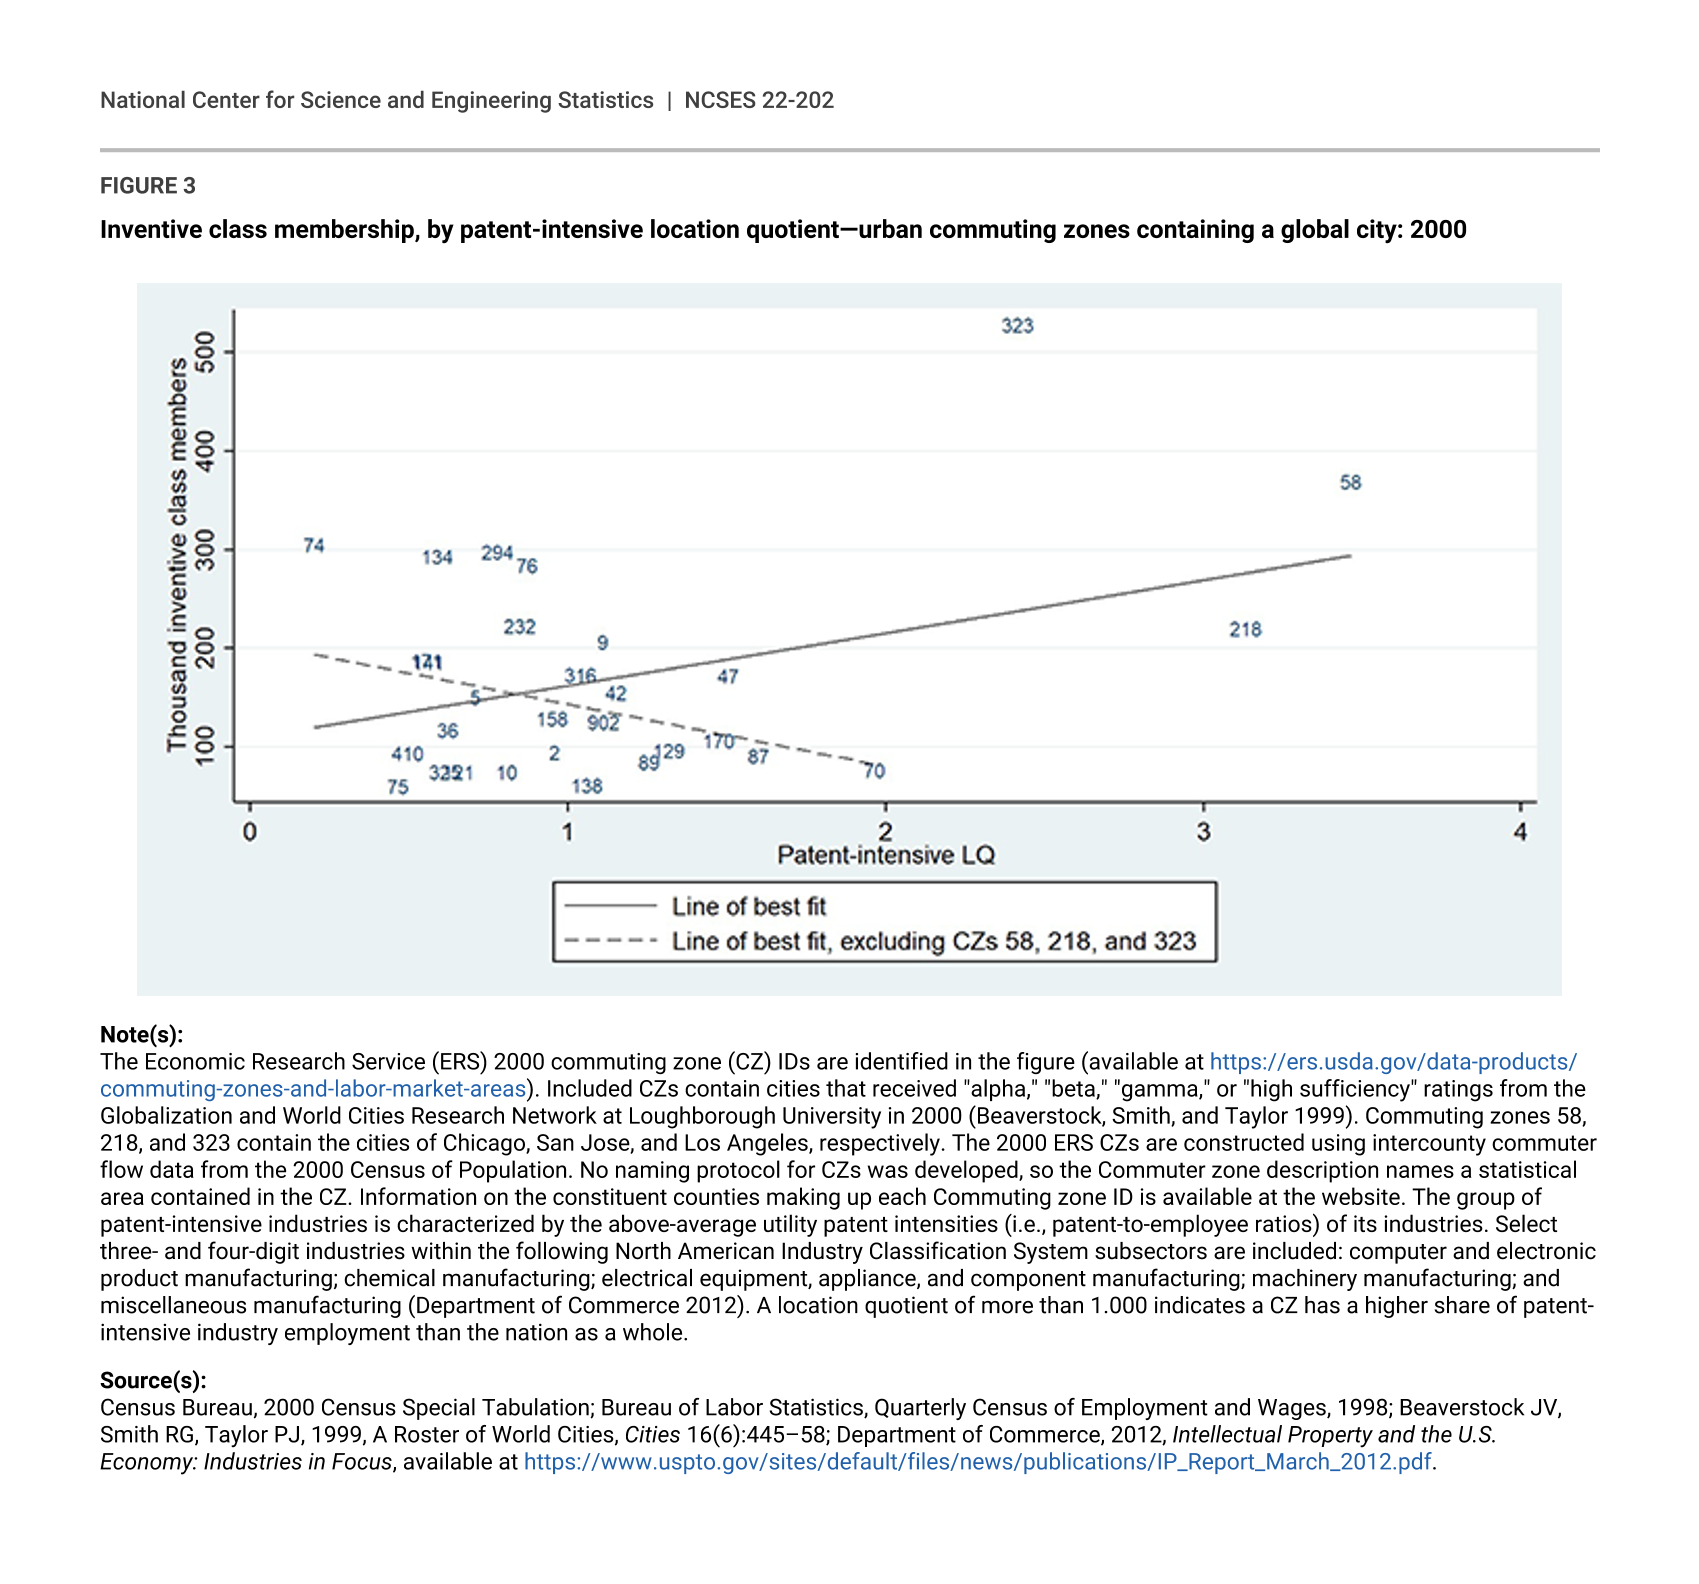
The large, negative coefficients on LQPatInd across specifications in the second structural equation are initially perplexing. Correlation between LQPatInd and IC is notably low in urban regions (0.17) relative to rural regions (0.34). When the urban sample is further divided into commuting zones that contain and do not contain a global city, associated correlation coefficients are 0.37 for UCGC commuting zones and 0.04 for UWGC commuting zones. Scatter plots of inventive class membership by patent-intensive LQ are displayed as figure 1, figure 2, and figure 3 for rural, UWGC, and UCGC commuting zones, respectively. In each figure, communing zone IDs from year 2000 are used in lieu of traditional scatter plot markers. Based on figure 3, the positive trend observed for urban commuting zones containing a global city appears to be driven by the commuting zones containing Chicago, IL (identified by commuting zone ID 58), San Jose, CA (218), and Los Angeles, CA (323). When these commuting zones are excluded from the group of UCGCs, correlation between LQPatInd and IC falls to -0.33.
Inventive class membership, by patent-intensive location quotient—rural commuting zones: 2000
Note(s):
The Economic Research Service (ERS) 2000 commuting zone (CZ) IDs identified in figure (available at https://ers.usda.gov/data-products/commuting-zones-and-labor-market-areas). The 2000 ERS CZs are constructed using intercounty commuter flow data from the 2000 Census of Population. No naming protocol for CZs was developed, so the Commuting zone description names a statistical area contained in the CZ. Information on the constituent counties making up each Commuting zone ID is available at the website along with documentation of how the CZs were constructed. The group of patent-intensive industries is characterized by the above-average utility patent intensities (i.e., patent-to-employee ratios) of its industries. Select three- and four-digit industries within the following North American Industry Classification System subsectors are included: computer and electronic product manufacturing; chemical manufacturing; electrical equipment, appliance, and component manufacturing; machinery manufacturing; and miscellaneous manufacturing (Department of Commerce 2012). A location quotient of more than 1.000 indicates a CZ has a higher share of patent-intensive industry employment than the nation as a whole.Source(s):
Census Bureau, 2000 Census Special Tabulation; Bureau of Labor Statistics, Quarterly Census of Employment and Wages, 1998; Department of Commerce, 2012, Intellectual Property and the U.S. Economy: Industries in Focus, available at https://www.uspto.gov/sites/default/files/news/publications/IP_Report_March_2012.pdf.
Inventive class membership, by patent-intensive location quotient—urban commuting zones without a global city: 2000
Note(s):
The Economic Research Service (ERS) 2000 commuting zone (CZ) IDs identified in figure (available at: https://ers.usda.gov/data-products/commuting-zones-and-labor-market-areas). The 2000 ERS CZs are constructed using intercounty commuter flow data from the 2000 Census of Population. No naming protocol for commuting zones was developed, so the Commuting zone description names a statistical area contained in the CZ. Information on the constituent counties making up each Commuting zone ID is available at the website along with documentation of how the CZs were constructed. The group of patent-intensive industries is characterized by the above-average utility patent intensities (i.e., patent-to-employee ratios) of its industries. Select three- and four-digit industries within the following North American Industry Classification System subsectors are included: computer and electronic product manufacturing; chemical manufacturing; electrical equipment, appliance, and component manufacturing; machinery manufacturing; and miscellaneous manufacturing (Department of Commerce 2012). A location quotient of more than 1.000 indicates a CZ has a higher share of patent-intensive industry employment than the nation as a whole.
Source(s):
Census Bureau, 2000 Census Special Tabulation; Bureau of Labor Statistics, Quarterly Census of Employment and Wages, 1998; Department of Commerce, 2012, Intellectual Property and the U.S. Economy: Industries in Focus, available at https://www.uspto.gov/sites/default/files/news/publications/IP_Report_March_2012.pdf.
Inventive class membership, by patent-intensive location quotient—urban commuting zones containing a global city: 2000
Note(s):
The Economic Research Service (ERS) 2000 commuting zone (CZ) IDs are identified in the figure (available at https://ers.usda.gov/data-products/commuting-zones-and-labor-market-areas). Included CZs contain cities that received "alpha," "beta," "gamma," or "high sufficiency" ratings from the Globalization and World Cities Research Network at Loughborough University in 2000 (Beaverstock, Smith, and Taylor 1999). Commuting zones 58, 218, and 323 contain the cities of Chicago, San Jose, and Los Angeles, respectively. The 2000 ERS CZs are constructed using intercounty commuter flow data from the 2000 Census of Population. No naming protocol for CZs was developed, so the Commuter zone description names a statistical area contained in the CZ. Information on the constituent counties making up each Commuting zone ID is available at the website. The group of patent-intensive industries is characterized by the above-average utility patent intensities (i.e., patent-to-employee ratios) of its industries. Select three- and four-digit industries within the following North American Industry Classification System subsectors are included: computer and electronic product manufacturing; chemical manufacturing; electrical equipment, appliance, and component manufacturing; machinery manufacturing; and miscellaneous manufacturing (Department of Commerce 2012). A location quotient of more than 1.000 indicates a CZ has a higher share of patent-intensive industry employment than the nation as a whole.
Source(s):
Census Bureau, 2000 Census Special Tabulation; Bureau of Labor Statistics, Quarterly Census of Employment and Wages, 1998; Beaverstock JV, Smith RG, Taylor PJ, 1999, A Roster of World Cities, Cities 16(6):445–58; Department of Commerce, 2012, Intellectual Property and the U.S. Economy: Industries in Focus, available at https://www.uspto.gov/sites/default/files/news/publications/IP_Report_March_2012.pdf.
The weak positive correlation between LQPatInd and IC observed for the UWGC sample and the negative correlation observed for the UCGC sample when Chicago, San Jose, and Los Angeles are excluded could reflect a greater propensity of workers in urban commuting zones to patent in industries not traditionally thought of as patentable (i.e., industries outside of manufacturing) compared to those in rural commuting zones. The results of the iterative regression analysis in section 3 for urban commuting zones suggest an urban manufacturing industry that is concentrated in production of high-technology goods (“electrical, electronics, and electromechanical assemblers” is the only production occupation with a consistent association with invention based on the urban analysis) and an inventive economy that includes a more diverse mix of industries. In years following our study period, the largest subcategory of patents for metropolitan statistical areas (MSAs) have included the usual suspects of computer hardware and peripherals (San Jose, Austin, Portland, Raleigh), biotechnology (San Francisco, Boston, and Philadelphia), and transportation (Detroit). However, less expectedly, the largest percentage of patents granted during the period 2007–11 in the MSAs containing New York, San Diego, Dallas, Atlanta, and Washington, DC (as well as Los Angeles and Chicago), were to inventors in the communications industry, which has experienced substantial growth in inventive output since the 1980s.
It appears that universities also play a significant role in shaping the diverse landscape of invention in urban commuting zones. Rothwell et al. (2013) connect patenting productivity in urban regions to the co-location of research universities—and, more specifically, to the availability of graduate programs in science disciplines. They determine that residents of the 48 MSAs with highly ranked doctoral programs in the sciences were responsible for 62% of all patents produced between 2007 and 2011, despite containing only 46% of the total metropolitan population. While research universities are likely to be a driving force for innovation in large urban commuting zones, such as Harvard University in Boston and University of Pennsylvania in Philadelphia, in urban regions with smaller populations, large research universities are also likely to dominate the local labor market, diluting regional concentration in patent-intensive industries. A stronger relationship between universities and the inventive economy in UWGC commuting zones seems plausible based on the data. Correlation coefficients for student density (students per square mile) and the variables IC and Patents in UWGC commuting zones are 0.65 and 0.52, respectively, compared to 0.42 and 0.32 for rural commuting zones and 0.33 and 0.04 for urban commuting zones containing a global city. Top urban commuting zones without a global city when ranked by inventive class include the commuting zones containing Yale University and the University of Michigan, which are associated with relatively low patent-intensive location quotients of 0.70 and 0.51, respectively. However, notable exceptions exist. For example, the commuting zone containing Rochester, NY (LQPatInd = 2.11), has a large manufacturing presence despite being home to several research universities.
Another factor that must be considered is the spatial division of inventive labor and production workers by multi-unit firms in rural and urban regions. Tecu observes that “firms…face a trade-off between locating R&D in research hubs to take advantage of external knowledge spillovers and locating R&D close to production to improve internal communication” (2013:2). The traditional notion of patent-intensive manufacturing industries which invent and produce in the same locations appears strongest for rural commuting zones based on the larger positive correlation between rural LQPatInd and IC. A notable exception to this is the urban commuting zone containing San Jose, the most inventive commuting zone by any metric, which has a large manufacturing base as well as a large inventive population. In her empirical analysis of the relationship between inventive output and the co-location of production and R&D in the chemicals and allied products industry, Tecu (2013) finds that a 10% increase in the size of a firm’s production workforce in a given MSA is associated with a 10% increase in the number of patents produced by the firm in the same MSA. If Tecu’s analysis could be narrowed to the rural case, it would provide additional insights into the co-location of production and R&D workers in rural commuting zones.
Robustness Checks and Limitations of the Analysis
To test the robustness of the results presented in the preceding section, several variations of the baseline simultaneous equations model are implemented for the rural and urban samples. In vector Geo of equation 2 and equation 3, categorical variables capturing geographic region and degree of urbanization/population of each commuting zone are included in the baseline specification to control for unobserved regional characteristics that may contribute to patent production and size of the considered population subsets. A likely byproduct of this choice is the dilution of results for the regressors with a variability closely linked to these spatial factors. To evaluate how the inclusion of Census region and RUCC controls impacts our results, the baseline model is first recalculated with these variables omitted. The associated results for rural and urban commuting zones are presented in appendix table A-1 and appendix table A-2 in the appendix.
As expected, deviations from the baseline results are visible in appendix table A-1 and appendix table A-2. Notably, significant coefficients on natural amenity rank—positive in the patents regression and negative in the population subset regression—are now observable for additional specifications in the rural and urban analyses. Collectively, these results may be indicative of an indirect process in which natural amenities support invention by positively impacting patenting productivity, which in turn contributes to the agglomeration of knowledge workers. In the rural case, the patents equation results may be picking up the higher patenting propensity of commuting zones in the West Census region compared to those in the Northeast Census region, ceteris paribus; commuting zones in the West Census region have the highest natural amenity ranks on average. Negative coefficients on ProxUrbCen in the rural population subset equations are more precisely estimated when geographic controls are excluded (though still insignificant). Positive impacts of unemployment rate and crime rate are also now visible in results for the rural SET regression; each of these variables is positively associated with degree of urbanization in the rural sample.
In results for the rural patents equations in appendix table A-1, coefficients on WageRentR are larger in magnitude compared to the baseline case, and the pattern of significance across specifications has been reversed; estimated effects from the IC and SET regressions are now significant (at the 5% level), while those from the CC and BA regressions are no longer significant. Changes in significance of point estimates are also visible for PatStock, UniResExp, and LQPatInd in the patents equation for inventive class and LQPatInd in the patents equation for educated workforce. As shown in appendix table A-2, following the omission of geographic controls, positive impacts of UniResExp on patent production are estimated for the urban IC, SET, and CC specifications.
For rural commuting zones, point estimates for the primary variables interest—the population subsets and patents—are larger in magnitude when the geographic controls are omitted. However, impacts of the individual population subsets on patenting are less precisely estimated in these results; p-values for CC and BA suggest that creative class and educated workforce size, respectively, are not robust predictors of patent production in rural commuting zones. The associated coefficients for IC and SET remain significant at the 1% and 5% levels, respectively, providing further validation of an important role for these workers in the rural patenting process. In contrast, urban results in appendix table A-2 reveal smaller estimated impacts of the considered population subsets on patent production, with the coefficients on IC and BA no longer significantly estimated.
It is admittedly difficult to make an ironclad case for causality based on the cross-sectional models used in this study. Unfortunately, this is an unavoidable limitation, as detailed occupation data were issued for one calendar year only. Excluding natural amenity rank, location quotient, and historic patent stock, the remaining independent variables included in the simultaneous equations models are defined using data from the year 2000. Year 2000 data are used to define these variables to maximize the number of commuting zones represented in the analysis; prior to the implementation of the American Community Survey in 2005, usable county-level data are scarcer for intervening decennial Census years. However, an obvious drawback to this approach is that it opens the door for reverse causality between the independent year 2000 measures and the dependent occupational employment measures. Therefore, in a second and third set of robustness checks, the independent variables from the 3SLS analysis defined using year 2000 data are substituted with corresponding lags from 1998 and 1990, respectively. The associated results are presented in appendix table A-3, appendix table A-4, appendix table A-5, and appendix table A-6.
Results for the rural sample employing 1998 and 1990 lags—including those for IC, SET, CC, and BA in patents equations and Patents in population subset equations—are generally consistent with the baseline rural results, with slight deviations in magnitude and significance of estimated effects. A notable exception is the estimated effect of 1990 university research expenditures, which now shows a positive association with patent production for all population subset specifications, with an average point estimate of 1.2. This likely highlights the protracted nature of the inventive process, where breakthroughs can occur years after a project is launched. The 1990 crime rate additionally demonstrates a negative association with IC, SET, and CC population sizes in rural regions that is not visible in the baseline results. However, it is notable that this measure displays a high degree of variability over time. Between 1990 and 2000, 72% percent of rural commuting zones saw decreased crime rates, with observed percentage changes ranging from -89% to 919%.
The urban lagged results, provided in appendix table A-4 and appendix table A-6 in the appendix, cast further doubt on the robustness of estimated impacts of the population subsets on patent production in the baseline urban analysis. When the urban model is re-estimated with 1998 and 1990 lags, the coefficients on SET, IC, and BA become insignificant compared to the baseline case. As is the case for the rural sample, a strong positive association is observed between 1990 UniResExp and patent production, with point estimates ranging from 13.0 to 14.2. However, positive relationships are observed between the 1990 crime rate and the considered population subsets, in contrast the negative relationships observed in rural IC, SET, and CC specifications. Remaining differences between the lagged and baseline results for rural and urban commuting zones may be attributable to differences in sample composition across specifications.
Although mean variance inflation factors (VIFs) for the structural equations in the baseline rural and urban analyses do not exceed 3.7—well below Gujarati’s “rule of thumb” threshold of 10 for high collinearity (2003:362)—it is notable that strong pairwise correlations exist between the considered populations of knowledge workers and UniResExp and PatStock, respectively, in the urban sample (as seen in table 8). Although both variables have strong a priori associations with patenting, the multicollinearity introduced into the model by their inclusion could result in a loss of statistical power for the populations of interest in equation 2. However, when both PatStock and UniResExp are excluded in the structural equation for patents in the urban baseline model (results available upon request), each of the population subsets is associated with an insignificant effect in the corresponding regression, suggesting that this result—also visible in the above-mentioned robustness checks—is not an artifact of multicollinearity.
In contrast to the strong positive correlations observed for the individual populations of knowledge workers and university research expenditures and patent stock, respectively, in the urban sample, the corresponding rural correlation coefficients are surprisingly low, ranging from 0.33 to 0.41 across the considered groups of knowledge workers for UniResExp and from 0.30 to 0.38 for PatStock. This further points to major differences between the inventive economies of rural and urban regions and cautions that what is gained in simplicity by adopting identical models of rural and urban invention can be lost to model misspecification in one case.
The empirical strategy also cannot account for characteristics of workers within each considered subpopulation of knowledge workers and how these unobserved characteristics may impact regional innovation systems. For example, it may be the case that inventive regions inherently attract the workers from each subpopulation with the greatest inventive potential.
Conclusions
The aim of this paper is to refine and assess an occupation-specific human capital approach to the regional analysis of patenting first suggested by Wojan, Dotzel, and Low (2015). Drawing conclusions about the inventive capacity of regions based on patents per capita fails to consider regional differences in the distribution of workers who might plausibly contribute to patenting and the much larger nonpatenting and dependent populations of children and the elderly.
We introduce several modifications to Wojan et al.’s (2015) original analysis, including use of a special tabulation of more-detailed occupation data and added controls for regional characteristics that might confound the selection of patenting occupations. In another departure from Wojan et al. (2015), we limit the universe of candidate occupations for the inventive class to those whose workers engage in the development, design, or creation of novel ideas at a sufficient level. We then critically evaluate the updated construct by implementing a simultaneous equations model of the interrelationship between inventive class composition and productivity in terms of patent production. Alternative subpopulations of knowledge workers (i.e., denominators) are substituted for the inventive class in this portion of the analysis to assess the value-added of the updated metric. The modifications made to the Wojan et al.’s (2015) analysis are effective in removing spurious occupations represented in the original inventive class that lack a discernible connection to patenting, including customer service representatives and entertainers and performers.
Results of the standardization and decomposition analysis suggest that the newly defined inventive class, though smaller, is more productive than the inventive class defined by Wojan et al. (2015). While observed patents per capita rates indicate that global cities are approximately six times more productive than rural areas in producing patents, when inventive class population share is held constant across the two populations, global cities are only twice as productive. In a departure from Wojan et al.’s finding, this result suggests that differences in compositional factors across regions are the main driver of differences in observed population-denominated patenting rates across rural and urban areas.
Going forward, the decomposition of population-based regional patenting rates into a rate factor and a compositional factor raises empirical questions regarding the salience of explaining differences in patenting productivity based on individual variables. For example, if variables such as human capital endowments or the creative class employment share in the local economy are more strongly associated with the compositional factor than the rate factor, then a purported boost to regional inventiveness from either could be more of an artifact of shifting population than an explanation for increased patenting productivity (Qian 2013; Boschma and Fritsch 2009). In a similar fashion, using patents per capita as an independent variable to proxy for innovation may confound the compositional and productivity contributions to constructs such as regional inequality (Lee and Rodríguez-Pose 2013). Future research attempting to identify the true drivers of regional inventiveness, or the implications of regional inventiveness on other phenomena of interest, should recognize the poor construct validity of the patents per capita measure and use a measure denominated by a subpopulation that more plausibly contributes to patenting.
Simultaneous equation results confirm the existence of an interrelationship between patent production and membership in our updated inventive class in rural regions and indicate that the inventive class more effectively picks up the contribution of rural workers in patent-intensive industries compared to three alternative populations of knowledge workers, a significant finding. Although the SET workforce may more effectively predict patent production in urban regions, excluding the additional occupations identified to be associated with invention (specifically, the production occupations) from the patenting rate denominator will serve to bias the estimate of patenting productivity in rural regions. By isolating the occupation-specific human capital most strongly associated with patenting, the analysis also identifies a seeming disarticulation of the inventive class from patent-intensive manufacturing employees in urban areas and the continued integration of these two classes of workers in rural regions.
References
Agrawal A, Kapur D, McHale J. 2008. How Do Spatial and Social Proximity Influence Knowledge Flows? Evidence from Patent Data. Journal of Urban Economics 64(2):258–69. doi:10.1016/j.jue.2008.01.003.
Apa R, De Noni I, Orsi L, Sedita SR. 2018. Knowledge Space Oddity: How to Increase the Intensity and Relevance of the Technological Progress of European Regions. Research Policy 47:1700–12.
Aryal G, Mann J, Loveridge S, Joshi S. 2018. Exploring Innovation Creation across Rural and Urban Firms: Analysis of the National Survey of Business Competitiveness. Journal of Entrepreneurship and Public Policy 7(4):357–76. doi:10.1108/JEPPD-18-00026.
Beaverstock JV, Smith RG, Taylor PJ. 1999. A Roster of World Cities. Cities 16(6):445–58. doi:10.1016/S0264-2751(99)00042-6.
Boschma RA, Fritsch M. 2009. Creative Class and Regional Growth: Empirical Evidence from seven European Countries. Economic Geography 85(4):391–423. doi:10.1111/j.1944-8287.2009.01048.x.
Carlino GA, Chatterjee S, Hunt RM. 2007. Urban Density and the Rate of Invention. Journal of Urban Economics 61(3):389–419. doi:10.1016/j.jue.2006.08.003.
Carlino G, Kerr WR. 2014. Agglomeration and Innovation. NBER Working Paper No. 20367. Cambridge, MA: National Bureau of Economic Research. doi:10.3386/w20367.
Carlino GA, Mills ES. 1987. The Determinants of County Growth. Journal of Regional Science 27(1):39–54. doi:10.1111/j.1467-9787.1987.tb01143.x.
Cohen WM, Levinthal DA. 1990. Absorptive Capacity: A New Perspective on Learning and Innovation. Administrative Science Quarterly 35(1):128–52. doi:10.2307/2393553.
Cohen WM, Nelson RR, Walsh JP. 2000. Protecting Their Intellectual Assets: Appropriability Conditions and Why US Manufacturing Firms Patent (or Not). NBER Working Paper No. 7552. Cambridge, MA: National Bureau of Economic Research. doi:10.3386/w7552.
Das Gupta P. 1993. Standardization and Decomposition of Rates: A User’s Manual. Current Population Reports No. P23-186. U.S. Department of Commerce, Economics and Statistics Administration, Bureau of the Census. https://www2.census.gov/library/publications/1993/demographics/p23-186.pdf. Accessed 10 August 2020.
Department of Commerce. 2012. Intellectual Property and the U.S. Economy: Industries in Focus. https://www.uspto.gov/sites/default/files/news/publications/IP_Report_March_2012.pdf. Accessed 10 August 2020.
Department of Justice (DOJ), Federal Bureau of Investigation. 2006. Uniform Crime Reporting Program Data [United States]: County-Level Detailed Arrest and Offense Data, 2000 (version 4) [data file and codebook]. Ann Arbor, MI: Inter-university Consortium for Political and Social Research. doi:10.3886/ICPSR03451.v4.
Dotzel KR. 2017. Three Essays on Human Capital and Innovation in the United States. PhD Dissertation, Graduate School of The Ohio State University. Available at: https://etd.ohiolink.edu/apexprod/rws_etd/send_file/send?accession=osu1499284768818425&disposition=inline.
Faggian A, McCann P. 2009. Human Capital, Graduate Migration and Innovation in British Regions. Cambridge Journal of Economics 33(2):317–33. doi:10.1093/cje/ben042.
Feldman M. 1994. The Geography of Innovation. Boston: Kluwer Academic.
Feldman M, Kogler DF. 2010. Stylized Facts in the Geography of Innovation. In Hall BH, Rosenberg N, editors, Handbook of the Economics Innovation, Vol. 1, pp. 381–410. Amsterdam: Elsevier.
Fiore AM, Niehm LS, Hurst JL, Son J, Sadachar A, Russell DW, Swenson D, Seeger C. 2015. Will They Stay or Will They Go? Community Features Important in Migration Decisions of Recent University Graduates. Economic Development Quarterly 29(1):23–37. doi:10.1177/0891242414559070.
Florida R. 2002. The Rise of the Creative Class: And How It’s Transforming Work, Leisure, Community, and Everyday Life. New York: Basic Books.
Fritsch M, Slavtchev V. 2010. How Does Industry Specialization Affect the Efficiency of Regional Innovation Systems? Annals of Regional Science 45(1):87–108. doi:10.1007/s00168-009-0292-9.
Fronczek P, Johnson P. 2003. Occupations: 2000 (2000 Census Brief). U.S. Census Bureau. https://www2.census.gov/library/publications/decennial/2000/briefs/c2kbr-25.pdf Accessed September 6, 2021.
Furman JL, Porter ME, Stern S. 2002. The Determinants of National Innovative Capacity. Research Policy 31(6):899–933. doi:10.1016/S0048-7333(01)00152-4.
Galindo-Rueda F. 2013. The OECD Measurement Agenda for Innovation. In Gault F, editor, Handbook of Innovation Indicators and Measurement, pp. 217–46. Northampton, MA: Edward Elgar Publishing.
Gibbs R, Kusmin L, Cromartie J. 2005. Low-Skill Employment and the Changing Economy of Rural America. Economic Research Report Number 10. Washington, DC: U.S. Department of Agriculture, Economic Research Service.
Gottlieb PD, Joseph G. 2006. College-to-Work Migration of Technology Graduates and Holders of Doctorates within the United States. Journal of Regional Science 46(4):627–59. doi:10.1111/j.1467-9787.2006.00471.x.
Graves PE. 1979. A life-cycle empirical analysis of migration and climate, by race. Journal of Urban Economics 6(2):135–47. doi:10.1016/0094-1190(79)90001-9.
Graves PE. 1980. Migration and Climate. Journal of Regional Science 20(2):227–37. doi:10.1111/j.1467-9787.1980.tb00641.x.
Greene WH. 2012. Econometric Analysis, 7th ed. Upper Saddle River, NJ: Pearson Education.
Griliches Z. 1990. Patent Statistics as Economic Indicators: A Survey. Journal of Economic Literature 28(4):1661–1707.
Guimarães P, Munn J, Woodward D. 2015. Creative Clustering: The Location of Independent Inventors. Papers in Regional Science 94(1):45–65. doi:10.1111/pirs.12052.
Gujarati DN. 2003. Multicollinearity: What Happens if the Regressors Are Correlated? In Sutton L, Bright A, editors, Basic Econometrics, 4th ed., pp 335–86. West Point, NY: McGraw-Hill Higher Education.
Hall BH, Jaffe AB, Trajtenberg M. 2001. The NBER Patent Citation Data File: Lessons, Insights and Methodological Tools. NBER Working Paper No. 8498. Cambridge, MA: National Bureau of Economic Research. doi:10.3386/w8498.
Jaffe AB, Trajtenberg M, Henderson R. 1993. Geographic Localization of Knowledge Spillovers as Evidenced by Patent Citations. Quarterly Journal of Economics 108(3):577–98. doi:10.2307/2118401.
Knudsen B, Florida R, Stolarick K, Gates G. 2008. Density and Creativity in U.S. Regions. Annals of the Association of American Geographers 98(2):461–78.
Krammer SMS. 2009. Drivers of National Innovation in Transition: Evidence from a Panel of Eastern European Countries. Research Policy 38(5):845–60. doi:10.1016/j.respol.2009.01.022.
Lee N, Rodríguez-Pose A. 2013. Innovation and Spatial Inequality in Europe and USA. Journal of Economic Geography 13:1–12. doi:10.1093/jeg/lbs022.
Li J. 2017. Rate Decomposition for Aggregate Data Using Das Gupta’s Method. Stata Journal 17(2):490–502.
Massey D. 1995. Spatial Divisions of Labour: Social Structures and the Geography of Production. London: MacMillan Press Ltd.
McCann P, Simonen J. 2005. Innovation, Knowledge Spillovers and Local Labour Markets. Papers in Regional Science 84(3):465–85. doi:10.1111/j.1435-5957.2005.00036.x.
McGranahan D, Wojan T. 2007. Recasting the Creative Class to Examine Growth Processes in Rural and Urban Counties. Regional Studies 41(2):197–216. doi:10.1080/00343400600928285.
Meliciani V. 2000. The Relationship between R&D, Investment and Patents: A Panel Data Analysis. Applied Economics 32(11):1429–37. doi:10.1080/00036840050151502.
Morel CM, Acharya T, Broun D, Dangi A, Elias C, Ganguly NK, Gardner CA, Gupta RK, Haycock J, Heher AD, Hotez PJ, Kettler HE, Keusch GT, Krattiger AF, Kreutz FT, Lall S, Lee K, Mahoney R, Martinez-Palomo A, Mashelkar RA, Matlin SA, Mzimba M, Oehler J, Ridley RG, Senanayake P, Singer P, Yun M. 2005. Health Innovation Networks to Help Developing Countries Address Neglected Diseases. Science 309(5733):401–04. doi:10.1126/science.1115538.
Morrison RE, Green MM. 2005. Scientists, Engineers, and Technicians in the United States: 2001. NSF 05-313. Arlington, VA: National Science Foundation, Division of Science Resources Statistics. Available at https://wayback.archive-it.org/5902/20150629120257/http://www.nsf.gov/statistics/nsf05313/pdf/nsf05313.pdf.
O*NET OnLine, Employment and Training Administration, U.S. Department of Labor. 2017a. Scales, Ratings, and Standardized Scores. https://www.onetonline.org/help/online/scales. Accessed 25 June 2017.
O*NET OnLine, Employment and Training Administration, U.S. Department of Labor. 2017b. Work Activities—Thinking Creatively. https://www.onetonline.org/find/descriptor/result/4.A.2.b.2. Accessed 25 June 2017.
O*NET Resource Center, Employment and Training Administration, U.S. Department of Labor. 2017. About O*NET. https://www.onetcenter.org/overview.html. Accessed 25 June 2017.
Organisation for Economic Co-operation and Development (OECD). 2009. OECD Patent Statistics Manual. Paris: OECD Publications.
Organisation for Economic Co-operation and Development (OECD). 2010. Territorial Reviews: Venice, Italy. Paris: OECD Publications. doi:10.1787/9789264083523-en.
Pasanen TP, Neuvonen M, Korpela KM. 2018. The Psychology of Recent Nature Visits: (How) Are Motives and Attentional Focus Related to Post-Visit Restorative Experiences, Creativity, and Emotional Well-Being? Environment and Behavior 50(8):913–44. doi:10.1177/0013916517720261.
Plambech T, Konijnendijk van den Bosch CC. 2015. The Impact of Nature on Creativity—A Study Among Danish Creative Professionals. Urban Forestry and Urban Greening 14(2):255–63. doi:10.1016/j.ufug.2015.02.006.
Qian H. 2013. Diversity versus Tolerance: The Social Drivers of Innovation and Entrepreneurship in US Cities. Urban Studies 50(13):2718–35. doi:10.1177/0042098013477703.
Roback J. 1982. Wages, Rents, and the Quality of Life. Journal Political Economy 90(6):1257–78. doi:10.1086/261120.
Roback J. 1988. Wages, Rents, and Amenities: Differences among Workers and Regions. Economic Inquiry 26(1):23–41. doi:10.1111/j.1465-7295.1988.tb01667.x.
Rodríguez-Pose A, Wilkie C. 2019. Innovating in Less Developed Regions: What Drives Patenting in the Lagging Regions of Europe and North America. Growth and Change 50(1):4–37. doi.org/10.1111/grow.12280.
Rothwell J, Lobo J, Strumsky D, Muro M. 2013. Patenting Prosperity: Invention and Economic Performance in the United States and Its Metropolitan Areas. Washington, DC: Metropolitan Policy Program, Brookings Institution. https://www.brookings.edu/wp-content/uploads/2016/06/patenting-prosperity-rothwell.pdf. Accessed 10 August 2020.
Scherer FM. 1965. Firm Size, Market Structure, Opportunity, and the Output of Patented Inventions. American Economic Review 55(5):1097–1125. http://www.jstor.org/stable/1809230. Accessed 10 August 2020.
Schumpeter J. 1939. Business Cycles: A Theoretical, Historical and Statistical Analysis of the Capitalist Process, Vol. 1. New Haven: Yale University Press.
Shackelford B, Jankowski J; National Center for Science and Engineering Statistics (NCSES). 2021. Three-Quarters of U.S. Businesses that Performed or Funded R&D Viewed Trade Secrets as Important in 2018. NSF 21-339. Alexandria, VA: National Science Foundation. Available at https://ncses.nsf.gov/pubs/nsf21339.
Stephens HM, Partridge MD, Faggian A. 2013. Innovation, Entrepreneurship and Economic Growth in Lagging Regions. Journal of Regional Science 53(5):778–812.
Storper M, Venables AJ. 2004. Buzz: Face-to-Face Contact and the Urban Economy. Journal of Economic Geography 4(4):351–70. doi:10.1093/jnlecg/lbh027.
Tecu I. 2013. The Location of Industrial Innovation: Does Manufacturing Matter? Center for Economic Studies Paper No. CES 13-09. Suitland, MD: Census Bureau. https://www2.census.gov/ces/wp/2013/CES-WP-13-09.pdf. Accessed 10 August 2020.
Thompson P, Fox-Kean M. 2005. Patent Citations and the Geography of Knowledge Spillovers: A Reassessment. American Economic Review 95(1):450–60. doi:10.1257/0002828053828509.
Tomlinson M, Miles I. 1999. The Career Trajectories of Knowledge Workers. Paris: Organisation for Economic Co-operation and Development. https://www.oecd.org/unitedkingdom/2101026.pdf. Accessed 10 August 2020.
Usai S. 2011. The Geography of Inventive Activity in OECD Regions. Regional Studies 45:6:711–31, doi:10.1080/00343401003792492.
Walsh JP, Nagaoka S. 2009. Who Invents? Evidence from the Japan-U.S. Inventor Survey. RIETI Discussion Paper No. 09-E-034. Tokyo: Research Institute of Economy, Trade and Industry. http://www.rieti.go.jp/jp/publications/dp/09e034.pdf. Accessed 10 August 2020.
Whisler RL, Waldorf BS, Mulligan GF, Plane DA. 2008. Quality of Life and the Migration of the College-Educated: A Life-Course Approach. Growth and Change 39(1):58–94. doi:10.1111/j.1468-2257.2007.00405.x.
Wojan TR. 1999. Functional Skill Requirements of Manufacturing Employment in the Rural South. Journal of Rural Social Sciences 15:104–38.
Wojan TR, Dotzel KR, Low SA. 2015. Decomposing Regional Patenting Rates: How the Composition Factor Confounds the Rate Factor. Regional Studies, Regional Science 2(1):535–51. doi:10.1080/21681376.2015.1095112.
Woodward D, Figueiredo O, Guimarães P. 2006. Beyond the Silicon Valley: University R&D and High-Technology Location. Journal of Urban Economics 60:15–32.
Zellner A, Theil H. 1962. Three-Stage Least Squares: Simultaneous Estimation of Simultaneous Equations. Econometrica 30(1):54–78. doi:10.2307/1911287.
Notes
1As first conceptualized by Schumpeter (1939) and later explained by Carlino and Kerr, “invention is the creation of a new product, service, or process, whereas innovation is the commercialization or introduction of that product or service into the market” (2014:4).
2The SET occupations are a nonstandard taxonomy comprised of Science occupations, Engineering occupations, Science and Engineering (S&E) technicians/technologists, and Other S&E-related occupations (see appendix table A-1: https://www.nsf.gov/statistics/2020/nsf20300/#technical&chp3). Postsecondary teachers in S&E are not included within SET. S&E managers are also not included in SET. See Dotzel (2017:148–9) for a list of the 48 occupations.
3Each commuting zone is categorized as “rural” or “urban” based on the Rural-Urban Continuum Code (RUCC) of the most urban county in the commuting zone. Urban commuting zones are defined as those containing at least one county associated with RUCC 1, 2, or 3 (the most “urban” RUCCs). All remaining commuting zones are categorized as rural.
4This choice is made to maintain consistency with Wojan et al., who include a total of 20 occupation shares in each regression “to mitigate the effects of collinearity between occupation shares” (2015:540). Mean variance inflation factors for the 19 non-SET occupation shares and SETSh in the rural and urban analyses are 1.4 and 2.2, respectively.
5Since RUCCs range from 1 to 9, with 1 being the most urban designation and 9 being the most rural designation, in practice this means that the lowest RUCC corresponding to a county in the commuting zone is assigned to the commuting zone.
6The addition of commuting zone population as a regressor in equation 1 results in loss of statistical power for these controls in addition to population density, suggesting that PopDens and the RUCC and Census region dummy variables sufficiently control for differences in population size across regions.
7Utility patents “apply to processes, machines, articles of manufacture, composition of matter, or any new and useful improvements thereof” (Department of Commerce 2012:5).
8Team-created patents are equally (and fractionally) apportioned to team members.
9The “Importance” rating “indicates the degree of importance a particular descriptor is to the occupation” and ranges from “‘Not Important’ (1) to ‘Extremely Important’ (5).” The “Level” rating ranges from 0 to 7 and “indicates the degree…to which a particular descriptor is required or needed to perform the occupation” (O*NET OnLine 2017a).
10TC Importance and Level ratings all considered SET and not-SET occupations and summary statistics for associated occupation shares are available upon request.
11Among the 114 Census occupations omitted from the analysis for not meeting these criteria are “bus drivers” and “janitors and building cleaners.”
12Following Wojan et al. (2015), we additionally intended to include occupations associated with positive and significant coefficients in at least 50% of their regressions in the metro and nonmetro analysis in our inventive subset to account for inventive processes that appear to be widespread, if not clearly defined. However, no occupations met these criteria.
13“Customer service representatives” was not a candidate occupation in the analysis since associated TC Importance and Level ratings (1.1 and 0.3, respectively) are less than the minimum ratings across SET occupations.
14These detailed occupations are not suboccupations of the summary occupations identified as inventive in the 2015 study.
15These commuting zones include cities that received an “alpha,” “beta,” “gamma,” or “high sufficiency” rating from the Globalization and World Cities (GaWC) Research Network at Loughborough University (Beaverstock, Smith, and Taylor 1999).
16See Li (2017) for examples of the user-written Stata command “rdecompose” for decomposing aggregate or cross-listed data.
17Wojan et al. (2015) sort commuting zones containing global cities into two populations based on whether their 1975–2000 population growth rate falls above or below the global city median growth rate. The allocation method is essentially the same.
18The high-growth global city population is characterized by a rate factor of 0.0793 and a compositional factor of 0.0426, compared to factors of 0.0506 and 0.0668, respectively, in Wojan et al.’s (2015) analysis, while the low-growth global city population has a rate factor of 0.0569 and a compositional factor of 0.0456, compared to factors of 0.0360 and 0.0720, respectively, in the previous study.
19This value is generally equal to α-effect / (α-effect + β-effect) × 100. In this case, α represents patents produced per inventive class member and β represents share of total population in the inventive class. Since the β-effect (−0.0002) is less than 0, the α-effect (0.0010) exceeds the sum of the α and β-effects, resulting in an estimated impact greater than 100%.
20“Rural” commuting zones are those containing no metro counties (i.e., all counties are assigned Rural-Urban Continuum codes 4–9) in 2003. These are referred to as ‘predominately rural’ commuting zones in Wojan et al.’s (2015) study. The ‘urban, without a global city’ category is comprised of the metropolitan commuting zones (RUCCs 1–3) not containing a global city.
21For example, Das Gupta’s (2003) two-factor, three-population methodology ensures that the sum of the UCGC-UWGC and UWGC-Rural effects equals the UCGC-Rural effect for both factors.
22Unlike Faggian and McCann (2009), we do not include a measure of small business presence as a predictor of patent production, as the authors find no evidence that small firms alone are important for regional invention. Furthermore, when the percentage of firms with less than 20 employees is included as a regressor in our structural equation for patents (i.e., equation 2), estimated effects are not statistically significant.
23The group of patent-intensive industries is characterized by the above-average utility patent intensities (i.e., patent-to-employee ratios) of its industries. Select three- and four-digit industries within the following North American Industry Classification System subsectors are included: computer and electronic product manufacturing; chemical manufacturing; electrical equipment, appliance, and component manufacturing; machinery manufacturing; and miscellaneous manufacturing (Department of Commerce 2012).
24Following McCann and Faggian (2009), the R&D variable is only included in the patenting equations and not in the population subset or human capital equations. While this specification may be most appropriate for the more general university graduate or creative class human capital variables, an argument can be made for including it in the inventive class and SET equations. For this comparative analysis, we only include the R&D variable in the patenting equation. Future research using the inventive class or SET occupations should consider the relevance of R&D measures as potential attractors.
25As acknowledged in section 2, patents are not representative of all types of innovation and not all sectors use patents to protect intellectual property (e.g., knowledge-intensive service sectors) (Tomlinson and Miles 1999). Accordingly, not all workers who have a hand in innovation contribute to patentable invention. We limit our analysis to those knowledge workers with a plausible direct connection to invention.
26Between 2000 and 2003, 94% of inventors named on U.S. triadic patents had at least a bachelor’s degree, while 45% had a PhD (Walsh and Nagaoka 2009).
27Magnitudes of Pearson correlation coefficients between the alternative patenting rates and patents per capita vary as expected, given the respective subpopulation means for rural and urban commuting zones displayed in table 7. In both rural and urban samples, the patenting rate of the smallest subpopulation on average (SET workforce) displays the weakest correlation with patents per capita, while the patenting rate of the largest subpopulation on average (educated workforce) displays the strongest correlation. These correlation coefficients are available on request.
28When urban commuting zones without a global city are ranked by IC, each of these commuting zones falls within the top 10 for a given metropolitan RUCC category.
29Of the multiunit firms from the NSF Survey of Industrial R&D engaged in the inventive economy during the decade preceding 1996, 70% of firms patented in more than one MSA and, on average, firms patented in five MSAs (Tecu 2013).
30This pattern of effects for NatAmen is also observable for the urban baseline SET and IC regressions.
31Coefficients on the categorical indicator for the West Census region (in reference to the Northeast Census region) in the rural baseline patents equation results are positive in each case. These results, excluded from table 9, are available on request.
32These variables are population density, university research expenditures, unemployment rate, crime rate, proximity to urban center, and wage-rental ratio.
33Results for the rural commuting zones based on the 1998 and 1990 lags are provided in appendix table A-3 and appendix table A-5, respectively.
34Due to differences in data availability by year, rural results employing lags from 1998 and 1990 are based on 329 and 370 observations, respectively, compared to 358 observations in the baseline case. Baseline urban results are calculated from 301 observations compared to 295 and 307 observations, respectively, when 1998 and 1990 lags are substituted.
Appendix
Suggested Citation
Dotzel KR, Wojan TR; National Center for Science and Engineering Statistics (NCSES). 2022. An Occupational Approach to Analyzing Regional Invention. NCSES 22-202. Alexandria, VA: National Science Foundation. Available at https://ncses.nsf.gov/pubs/ncses22202.
Contact Us
NCSES
National Center for Science and Engineering Statistics
Directorate for Social, Behavioral and Economic Sciences
National Science Foundation
2415 Eisenhower Avenue, Suite W14200
Alexandria, VA 22314
Tel: (703) 292-8780
FIRS: (800) 877-8339
TDD: (800) 281-8749
E-mail: ncsesweb@nsf.gov