 An official website of the United States government

The Geography of Self-Reported Innovation: Results from the 2017 Annual Business Survey
Disclaimer
Working papers are intended to report exploratory results of research and analysis undertaken by the National Center for Science and Engineering Statistics (NCSES). Any opinions, findings, conclusions, or recommendations expressed in this working paper do not necessarily reflect the views of the National Science Foundation (NSF). This working paper has been released to inform interested parties of ongoing research or activities and to encourage further discussion of the topic.
Abstract
On May 5, 2020, the National Science Board (NSB) released its Vision 2030 report (NSB 2020), which lays out four central priorities for the National Science Foundation this decade. One such priority, “expand the geography of innovation,” envisions innovation hubs operating in every state to help retain the nation’s leadership in the science and engineering enterprise. This working paper uses the very large sample size of the 2017 Annual Business Survey (N ≈ 850,000) to produce substate-level estimates of self-reported innovation rates. The analysis provides a baseline for assessing efforts to actively seed and nurture innovation clusters throughout the country, identifying areas that are exceeding expectations and others that may be falling behind. Because the concentration of innovation-intensive industry varies across the country, a relative innovation rate that controls for the innovation rate expected from a region’s industrial structure is provided. The analysis is descriptive and does not examine possible explanations of differences in regional innovation rates.
Introduction
Anyone who watches the news, reads the business section of newspapers, or simply uses technology probably has a mental map of the geography of innovation. For nearly everyone, that map would include Silicon Valley, California; Seattle, Washington; and Austin, Texas—regions that host iconic high-tech companies such as Apple, Microsoft, Google, Dell, Intel, and Amazon. However, with growing concern over “places left behind”—formerly prosperous regions that thrived during the agricultural or industrial epochs of the economy—the question of the geographical extent of the innovation economy has come into sharper focus. Is it really limited to a select number of global cities, or is the capacity to invent new products and discover new ways of doing things more widely distributed?
This working paper provides empirical evidence of the concentration and dispersion of the broad-based definitions of self-reported innovation available in the 2017 Annual Business Survey (ABS). The large sample size of the inaugural ABS provides a unique opportunity to produce relatively precise estimates of innovation rates at the substate level that had not been available in earlier innovation data collections such as those that were part of the 2014 Annual Survey of Entrepreneurs or the Business R&D and Innovation Survey. The ABS is a firm- or enterprise-level survey, so the geography of innovation is only precisely estimated for single-unit firms. The statistics that follow are all based on the single-unit subpopulation that comprises close to 60% of the sample. The correspondence between single-unit firm estimates and published estimates using the complete sample is addressed with respect to state innovation rates below.
Innovation rates at the national level broken out by industry, firm size, metropolitan/nonmetropolitan classification, and settlement size categories provide benchmarks that will be helpful for making sense of the state-level breakouts that follow. These estimates are preceded by an explanation of exactly how innovation is defined in the ABS and how these measures will be used. The working paper concludes by identifying the most innovative labor market areas in the United States, in terms of overall innovation rates and innovation rates that consider the concentration of high-tech, medium-tech, and low-tech industry in the local economy.
Defining Self-Reported Innovation Rates
Until the 1990s, the measurement of innovation was largely limited to utility patents and expenditures on research and development. Recognition that utility patents are imperfect and incomplete measures of invention (much less of innovation) and that R&D expenditures are inputs to the innovation process rather than measures of innovation output compelled an international effort to develop a more inclusive measure of innovation (Arundel and Smith 2013). The Oslo Manual, first published in 1992 by the Organisation for Economic Co-operation and Development (OECD), provided guidance to national statistical agencies on the collection and interpretation of self-reported innovation data. The third edition of the Oslo Manual, published in 2005, guided the design and development of the 2017 ABS used in this analysis and thus provides the appropriate lens for examining these data (OECD/Eurostat 2005).
The two critical requirements for reporting a product innovation are (1) the innovation has been introduced on the market and (2) the innovation is a new good or service for the firm or an existing good or service that was significantly improved. Market success of an innovation is not, however, a criterion. Thus, whether the innovation is “good” or “bad” as indicated by popularity or sales volume is not considered in classifying a firm as innovative or not. This positive measure of product innovation has the advantage of making data collection and classification easier, along with directly informing the role of innovation in adaptive efficiency of the economy; that is, providing a measure of the number of firms that are introducing new products or significantly improving existing products whether successful or not. The disadvantage of a positive measure is that it is more difficult to connect the innovation measure directly to economic impact. This may be one reason why relatively little research has been done on self-reported innovation measures in the United States to date. Another possible reason is that an innovation measure that combines the introduction of completely new products with the significant improvement or imitation of existing products may be at odds with how many Americans perceive “innovation” (Peric and Galindo-Rueda 2014; Tuttle, Alvarado, and Beck 2019).
The most objective way to limit the measure of self-reported innovation to truly novel products or improvements is to require that innovating firms be the first to introduce such products in their market. Respondents are asked if any of their innovations have been “new to market,” being the first among competitors introducing an innovation. This qualification eliminates the type of innovation that was most problematic for participants in a cognitive interview study: imitation qualifying as innovation (Peric and Galindo-Rueda 2014; Tuttle, Alvarado, and Beck 2019). Many U.S. participants expressed the view that their interpretation of “innovation” was limited to the creation of something unique.
Two innovation rates are thus reported in all the tables that follow: (1) any product innovation comprising new-to-firm and new-to-market innovation and (2) a new-to-market rate of innovation that captures the creation or origination of unique products.
Relative Innovation Rates: Measuring Regional Innovative Shift
The collection of industries operating in a region is likely to affect the observed rates of any product innovation and new-to-market innovation. Emerging industries that are exploring and developing new uses for foundational technology likely contain firms more prolific in new-to-market innovation. More mature industries with established product lines and uses are likely to demonstrate much lower rates of new-to-market innovation. However, differences in any product innovation between emerging and mature industries is an empirical question because firms in mature industries may be making numerous changes to existing products in order to remain competitive.
Measuring the relative innovation of a region given its collection of emerging and mature industries can be done by first measuring the innovation rate for detailed industries at the national level. The predicted level of innovation for a region can then be computed by assigning the national innovation rate to each firm within a detailed industry. Subtracting the predicted innovation rate for the region from the observed innovation rate would provide an estimate of the region’s innovative shift—the degree to which the collection of industries is more or less innovative than the same collection of industries at the national level.
Regional Innovative Shift = Observed Innovation Rate – Predicted Innovation Rate
Deriving a regional innovative shift estimate that is statistically significant (i.e., the range of estimates does not include zero after adding or subtracting a margin of error) is highly unlikely, given that the error associated with it is the addition of the error rates from the observed and predicted rate estimates. Given this limitation, the analysis that follows will only be able to indicate whether a regional innovative shift is likely to exist, indicated by the observed innovation rate being statistically different from the predicted innovation rate. A positive regional innovative shift with the observed innovation rate larger than the predicted innovation rate would indicate that local businesses, on average, are more innovative than their peers throughout the nation.
Self-Reported Innovation Rate Estimates
The first set of any product innovation and new-to-market innovation rates examined in table 1 is for detailed industries and firm size classes for the United States, metropolitan areas, and nonmetropolitan areas. A separate column indicates when metropolitan and nonmetropolitan innovation rates are statistically different.
Any product innovation and new-to-market innovation rates, by industry and firm size class
Note(s):
Statistical difference is at the 0.05 level. The titles for NAICS 31-33, which are assigned the label of "Manufacturing" in the 2017 NAICS Manual, are modified here to provide more information for the reader. Information on the detailed retail industries in NAICS 44 and NAICS 45 is available at https://www.naics.com/what-is-naics-sector-44-45-full-description-and-statistics/. Information on the detailed Transportation and Warehousing industries in NAICS 48 and NAICS 49 is available at https://www.naics.com/naics-code-description/?code=48-49. These estimates are derived from companies with only a single location and may differ from the published innovation counts and estimates based on single- and multi-unit firms (Kindlon 2021). Limiting analysis to single-unit firms eliminates the potential headquarters’ bias resulting from attributing innovation to the reporting location of multi-unit firms and reduces potential measurement error resulting from attributing company reports of innovation to all branch locations. The statistics allow inferences regarding the population of single-unit firms but do not allow inferences regarding the population of all firms.
Source(s):
National Center for Science and Engineering Statistics and Census Bureau, 2018 Annual Business Survey: Data Year 2017.
As expected, new-to-market innovation rates vary considerably across industry groups. Industry groups commonly associated with high-tech industries such as Information (North American Industry Classification System [NAICS] 51) and Durable Manufacturing (NAICS 33) have new-to-market innovation rates that are 3 to 5 times higher than rates of industry groups commonly associated with low-technology production such as Agriculture, Forestry, Fishing and Hunting (NAICS 11) or Mining (NAICS 21) despite intensive technology use. Food and Fiber Manufacturing (NAICS 31), which has traditionally been perceived as low-tech given rankings based on R&D expenditures or patent production (Shackelford 2013), is highly innovative when measured by self-reports of new-to-market innovation. This ostensible inconsistency may reflect the low barriers to new product introduction relative to barriers faced by other industry groups. This finding does complicate the simple categorization of low-tech corresponding with lower rates of new-to-market innovation and high-tech corresponding to higher rates of new-to-market innovation. Other industries that demonstrate relatively high new-to-market innovation rates include Educational Services (NAICS 61), Wholesale Trade (NAICS 42), and Retailing including Nonstore Retailing (NAICS 45). The relatively high self-reported new-to-market innovation rates in industry groups not typically considered high-tech industry suggests that self-reported innovation rates across the country may be more similar than commonly assumed, particularly because these industries tend to be more uniformly distributed throughout the United States than high-tech industries are.
In general, new-to-market innovation rates track very closely to all product innovation rates (correlation coefficient = 0.9745; not shown). There do not appear to be any clear exceptions where industries with relatively low new-to-market innovation rates demonstrate relatively high new-to-firm innovation rates, resulting in a large difference between any product innovation and new-to-market innovation rates. In fact, the opposite trend is demonstrated: the largest differences between any product innovation and new-to-market innovation rates are in those industries with relatively high new-to-market innovation rates such as Food and Fiber Manufacturing (NAICS 31), Information (NAICS 51), and Educational Services (NAICS 61). This suggests that innovation defined by significant improvement or imitation of existing products tends to be highest in those industries that are most innovative in introducing completely new products.
The point estimates of self-reported new-to-market innovation and any product innovation rates increase gradually in larger firm size classes. Most of these differences are not statistically significant. The very smallest firms with one to four employees do demonstrate the lowest rates of self-reported any product innovation that is statistically different from that of all other firm size classes (other than the largest firm size class, which has a large standard error given its limited sample size). For new-to-market innovation, the two smallest firm size classes (with one to nine employees) demonstrate lower rates that are statistically different from those of larger firms. It is important to recognize that the data pertain to single-unit firms, so these numbers are not representative of innovation rates of multi-unit firms by size class.
Statistically significant differences in metropolitan and nonmetropolitan innovation rates by industry and firm size class are indicated in a separate column. Point estimates of metropolitan innovation rates are in most cases above the nonmetropolitan innovation rates, but these differences are statistically significant in only five industries: Nondurable Manufacturing (NAICS 32), Wholesale Trade (NAICS 42), Transportation and Warehousing (NAICS 48), Information (NAICS 51), and Professional, Scientific, and Technical Services (NAICS 54). The differences in Information (NAICS 51) are the most notable because it is the one highly innovative industry in this group. A metropolitan or nonmetropolitan difference is not evident in the other highly innovative industries such as Durable Manufacturing (NAICS 33), Educational Services (NAICS 61), and Food and Fiber Manufacturing (NAICS 31). The expectation that nonmetropolitan firms will lag significantly behind their metropolitan peers is supported for only a handful of industries.
A modest metropolitan any product innovation advantage for firms with fewer than 50 employees is evident in the data. A metropolitan new-to-market innovation advantage is statistically significant for only the smallest firm size class (1 to 4 employees) and for firms with 20 to 49 employees. None of the differences in the larger firm size classes are statistically significant. Here again, when estimates are statistically different, they appear to be more a difference of degree than a difference in kind. The takeaway from table 1 is a modest metropolitan advantage in overall innovation rates. Table 2 presents innovation rates throughout the settlement hierarchy, providing a more nuanced view of where innovation may be more or less prevalent.
Any product innovation and new-to-market innovation rates, by settlement size category
CZ = 2010 Commuting Zone.
Note(s):
A statistically larger indicator is applied at the 0.05 level. These estimates are derived from companies with only a single location and may differ from the published innovation counts and estimates based on single- and multi-unit firms (Kindlon 2021). Limiting analysis to single-unit firms eliminates the potential headquarters’ bias resulting from attributing innovation to the reporting location of multi-unit firms and reduces potential measurement error resulting from attributing company reports of innovation to all branch locations. The statistics allow inferences regarding the population of single-unit firms but do not allow inferences regarding the population of all firms.
Source(s):
National Center for Science and Engineering Statistics and Census Bureau, 2018 Annual Business Survey: Data Year 2017.
Differences in self-reported any product innovation rates between the largest cities and completely rural counties (counties with no settlements of at least 2,500 residents) are statistically significant but are not particularly large given conventional wisdom that innovation is predominantly an urban phenomenon (World Bank 2009). Any product innovation rates in the largest cities (metropolitan area population of 1 million or more) are also statistically larger than innovation rates in all other settlement size classes with one exception. The difference between the largest city innovation rates and rates in the largest nonmetropolitan counties (with urbanized populations of 20,000 to 50,000) that are not adjacent to a metropolitan area are not statistically significant. The observation that point estimates in nonmetropolitan counties adjacent to metropolitan areas are lower than estimates in their nonadjacent peer counties is an interesting finding that contradicts the belief that more remote areas will be more disadvantaged pursuing innovation. A real nonadjacent innovation advantage could be explained by greater rural-to-urban flows in metropolitan proximate areas (a backwash effect). Alternatively, higher innovation in nonadjacent counties may represent thinner markets in which reporting an innovation is more likely, given the absence of metropolitan competitors.
The Geography of Self-Reported Innovation
Given small differences in innovation rates across the settlement hierarchy, and unexpectedly high innovation rates among some industries not thought of as high-tech, the expectation of large differences in self-reported innovation rates across states and between the urban and rural portions of states is considerably diminished. Because the self-reported measure does not consider the success of a new or significantly improved product in identifying innovation, our expectations of significantly higher levels of innovation in the most dynamic, fastest-growing states and regions may be muted. Interpreting the self-reported innovation rates as measures of adaptive efficiency—the capability for trying new ways to succeed—is more consistent with the objective of providing a positive measure of innovation.
Table 3 presents any product innovation and new-to-market innovation rates for states. The table indicates where the observed innovation rates were significantly different from the predicted innovation rates if industries in the state were as innovative as the national average. A statistically significant difference between observed and predicted innovation rates is indicated by a (+) representing a positive regional innovative shift in which state industries are more innovative than the same collection of industries in the nation. A (-) indicates a negative regional innovative shift in which state industries are less innovative than the same collection of industries in the nation.
Observed and predicted any product innovation and new-to-market innovation rates, by state
Note(s):
Shift refers to regional innovative shift in which + indicates that observed is statistically larger than predicted at the 0.05 level, and - indicates that observed is statistically smaller than predicted at the 0.05 level. These estimates are derived from companies with only a single location and may differ from the published innovation counts and estimates based on single- and multi-unit firms (Kindlon 2021). Limiting analysis to single-unit firms eliminates the potential headquarters’ bias resulting from attributing innovation to the reporting location of multi-unit firms and reduces potential measurement error resulting from attributing company reports of innovation to all branch locations. The statistics allow inferences regarding the population of single-unit firms but do not allow inferences regarding the population of all firms.
Source(s):
National Center for Science and Engineering Statistics and Census Bureau, 2018 Annual Business Survey: Data Year 2017.
The two most salient geographic findings in the table are the western states’ proclivity toward positive regional innovative shift and the eastern states’ tendency toward negative regional innovative shift. In the West, Alaska, Colorado, Montana, Nevada, and New Mexico demonstrate a positive regional innovative shift for any product innovation and new-to-market innovation, whereas the innovative shift for California and Oregon is limited to any product innovation. California does demonstrate the highest predicted new-to-market innovation rate, consistent with expectations of a considerable high-tech presence, that is close to its observed new-to-market innovation rate. New York also demonstrates one of the highest predicted new-to-market innovation rates, but its observed innovation rate is significantly lower, suggesting a negative regional innovative shift. Other eastern states with negative shifts include Alabama, Kentucky, Louisiana, Mississippi, New Jersey, Ohio, and West Virginia.
The District of Columbia does provide a contrast to the story of a western innovation advantage, demonstrating the highest point estimate for any product innovation or new-to-market innovation of any state. The fact that the city of Washington is coterminous with the District of Columbia might explain the high innovation rates relative to most states that combine metropolitan and nonmetropolitan areas. However, an examination of metropolitan and nonmetropolitan innovation rates by state (not shown) identifies only six states in which the any product innovation rate was significantly lower for nonmetropolitan areas (Delaware, Georgia, Illinois, Kentucky, Ohio, and Virginia), one state with a significantly lower nonmetropolitan new-to-market rate (Pennsylvania), and one state with significantly lower nonmetropolitan any product innovation and new-to-market innovation rates (Texas). States with relatively large nonmetropolitan populations such as Alaska, Montana, and Wyoming also demonstrate some of the highest observed innovation rates, suggesting that rural areas do not inherently impede state-level innovation.
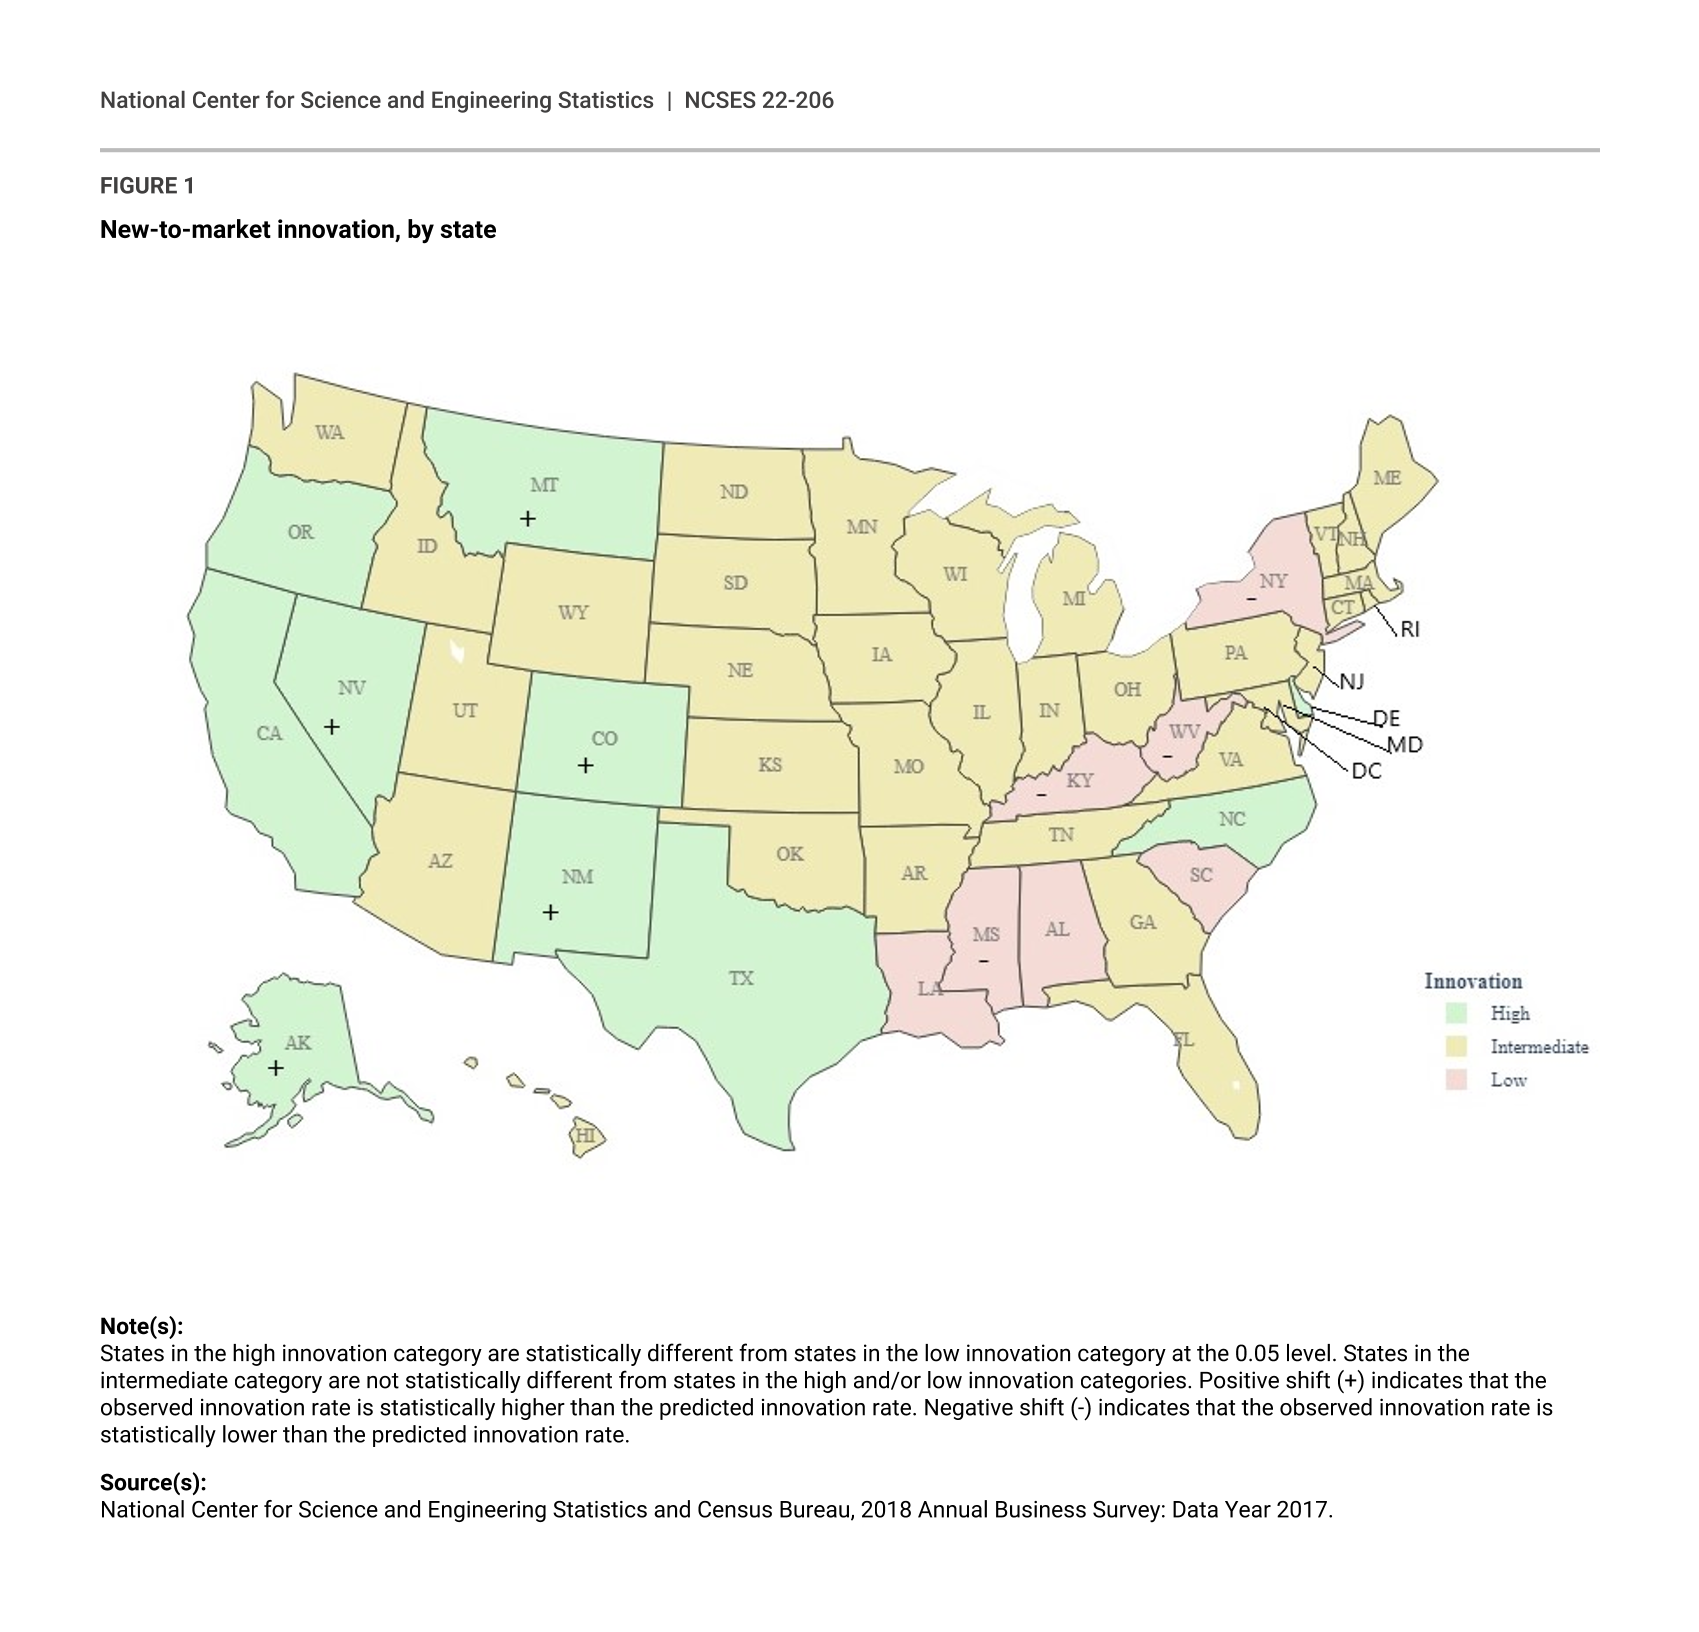
Geography is most easily communicated through maps, and figure 1 visually summarizes table 3. The difficulty of expressing differences in innovation rates on a map from the ABS is that the state innovation rates are generally close together, making ranking by point estimates problematic. The differences between the 10 most innovative and 7 least innovative states are statistically different. However, for most states in the middle, it is not possible to characterize them definitively as less innovative than the top states or more innovative than the bottom states. The largest category of states is thus an intermediate or indeterminant classification.
New-to-market innovation, by state
Note(s):
States in the high innovation category are statistically different from states in the low innovation category at the 0.05 level. States in the intermediate category are not statistically different from states in the high and/or low innovation categories. Positive shift (+) indicates that the observed innovation rate is statistically higher than the predicted innovation rate. Negative shift (-) indicates that the observed innovation rate is statistically lower than the predicted innovation rate.
Source(s):
National Center for Science and Engineering Statistics and Census Bureau, 2018 Annual Business Survey: Data Year 2017.
The western innovation advantage is evident in the map, with Delaware, the District of Columbia, and North Carolina the only three high-innovation regions in the East. The West includes no low-innovation states, and all of the states demonstrating a positive regional innovative shift are located here. In contrast, all states demonstrating a negative innovative shift are in the East. However, the most compelling message from the map is that most states are in the intermediate category. The only clear statistical evidence presented in the map is a difference in innovation rates between states with high and low innovation rates. Thus, there is no evidence of a distinct coastal/heartland difference in self-reported innovation that always seems to motivate discussion of the concentrated geographic distribution of venture capital or R&D funding. This is encouraging to the extent that the motivation of businesses to innovate appears to be much more broadly distributed than the funding streams for new ideas.
Two possible explanations for the rather flat geography of self-reported innovation are that state aggregates mask considerable variation across substate areas or that the very smallest firm size classes mask variation in the larger firms, which are less numerous. The former possibility will be investigated in the next section. As for the latter possibility, limiting the estimation of innovation rates to firms with 10 or more employees, which is the common practice in the Community Innovation Survey administered in European Union countries, substantially reduces sample size (N ≈ 64,000), making it more difficult to identify statistically significant differences among states. The immediate verdict is to suspend judgment on whether the smallest firm size classes are masking larger innovation differences across states. However, the following substate analysis poses the question somewhat differently: are assumed coastal standouts such as Silicon Valley (San Jose), San Francisco, and Boston masked in statewide averages?
Most Innovative Commuting Zones: Overall and Controlling for Industrial Composition
The substate regions used in this analysis are the 2010 commuting zones, collections of individual counties linked by strong intercounty commuter flows (Fowler and Jenson 2020; Fowler, Rhubart, and Jensen 2016). Commuting zones have the advantage of defining a functional economic region and providing a larger sample size for estimating innovation rates than a county geography. In contrast to metropolitan statistical areas, commuting zones are inclusive of all areas in the United States. Commuting zone geographies have been frequently used in studies of innovation and labor market issues (Acemoglu and Restrepo 2020; Autor, Dorn, and Hanson 2013; Bell et al. 2019).
Ranking the 50 most innovative commuting zones by point estimate is problematic because the standard errors are considerably larger than those for the state estimates. Ranking by the lower limit of the 95% confidence interval for the innovation rate estimate limits the number of false positives (i.e., commuting zones included in the top 50 list that are in fact not particularly innovative). This ranking is provided in table 4. The trade-off is that some truly innovative commuting zones may be excluded from the list (false negatives), and this misclassification is more likely to affect smaller commuting zones. However, the central concern that state-level estimates are masking high innovation rates in global cities on the coasts can be effectively assessed.
Top 50 commuting zones, by robust new-to-market innovation rates
CBSA = core-based statistical area.
Note(s):
"Yes" for regional shift indicates that the observed new-to-market innovation rate is statistically larger than the predicted new-to-market innovation rate at the 0.05 level. These estimates are derived from companies with only a single location and may differ from the published innovation counts and estimates based on single- and multi-unit firms (Kindlon 2021). Limiting analysis to single-unit firms eliminates the potential headquarters’ bias resulting from attributing innovation to the reporting location of multi-unit firms and reduces potential measurement error resulting from attributing company reports of innovation to all branch locations. The statistics allow inferences regarding the population of single-unit firms but do not allow inferences regarding the population of all firms.
Source(s):
National Center for Science and Engineering Statistics and U.S. Census Bureau, 2018 Annual Business Survey: Data Year 2017.
Silicon Valley (San Jose), San Francisco, Boston, Austin, Seattle, and other areas identified with high tech are included in table 4. However, the estimated innovation rates are not substantially different from their respective state innovation rates. In fact, the rates for all but Austin are not statistically different from the rates for their state. Table 4, listing the 50 most innovative commuting zones, reinforces the conclusion from the state table that regional differences in self-reported innovation rate are matters of degree rather than kind. The combination of global cities (the District of Columbia, Los Angeles, New York City, and San Francisco), small rural areas (Wallowa, Oregon), small midwestern cities (Kokomo, Indiana), and university-dominated regions (Blacksburg and Charlottesville, Virginia) on the list challenges the notion that any particular type of region is pulling away in the introduction of new products. It is important to remember that the positive measures of innovation are not dependent on market success, so there may be large regional differences in the economic outcomes derived from the introduction of new products.
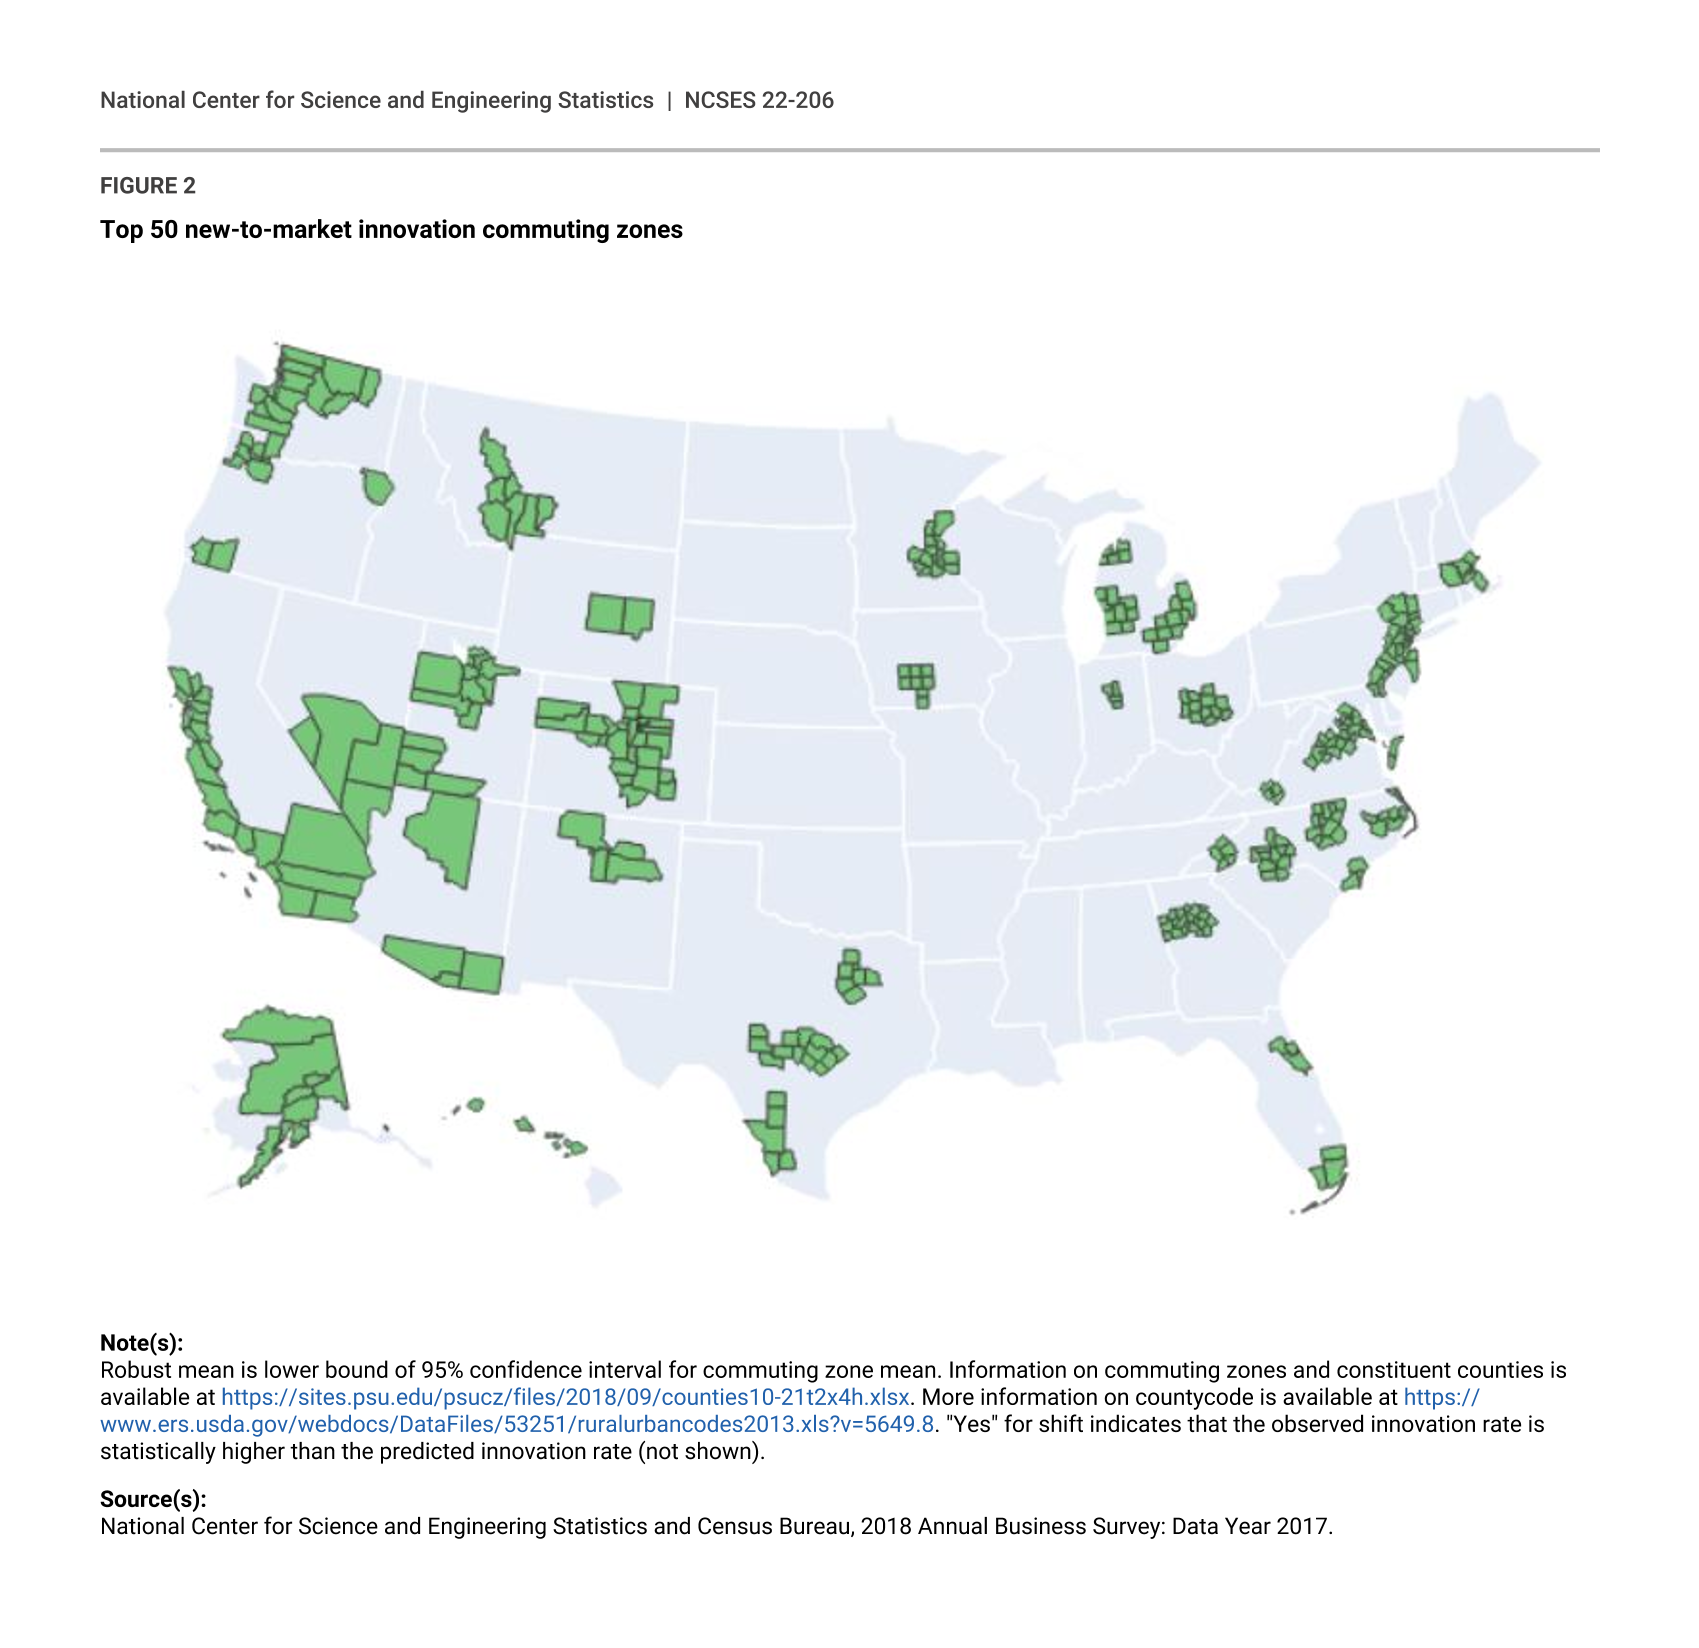
Figure 2 maps the findings in table 4, providing visual evidence of the dispersion of the top 50 commuting zones. The western dominance evident in the state map is replaced with greater regional balance for substate areas. Notable geographic features are the high-innovation commuting zones clustering in the eastern seaboard megalopolis between the District of Columbia and New York City, and the Northern and Southern California clusters. Large areas on the map that are seemingly devoid of any high-innovation commuting zones such as the Great Plains should be assessed with caution, given the high probability of false negatives for small-population commuting zones characterizing the region.
Top 50 new-to-market innovation commuting zones
Note(s):
Robust mean is lower bound of 95% confidence interval for commuting zone mean. Information on commuting zones and constituent counties is available at https://sites.psu.edu/psucz/files/2018/09/counties10-21t2x4h.xlsx. More information on countycode is available at https://www.ers.usda.gov/webdocs/DataFiles/53251/ruralurbancodes2013.xls?v=5649.8. "Yes" for shift indicates that the observed innovation rate is statistically higher than the predicted innovation rate (not shown).
Source(s):
National Center for Science and Engineering Statistics and Census Bureau, 2018 Annual Business Survey: Data Year 2017.
Substate regions specializing in more innovative industries are more likely to be included in the top 50 list. California commuting zones making the list have some of the highest predicted innovation estimates in the country. Assessing the innovative activity in a commuting zone controlling for the industries located there is possible using the regional innovative shift measure described earlier. Commuting zones with observed innovation rates statistically higher than their predicted innovation rates indicate that local businesses are more innovative, on average, than their industry peers. The geographic distribution of these regions gives an idea of where business-level innovation is particularly active. Table 5 may not capture all such regions, given larger errors in innovation rate estimates for smaller areas.
Commuting zones with higher innovation rates than predicted
CBSA = core-based statistical area.
Note(s):
+ indicates that observed is statistically larger than predicted at the 0.05 level. These estimates are derived from companies with only a single location and may differ from the published innovation counts and estimates based on single- and multi-unit firms (Kindlon 2021). Limiting analysis to single-unit firms eliminates the potential headquarters’ bias resulting from attributing innovation to the reporting location of multi-unit firms and reduces potential measurement error resulting from attributing company reports of innovation to all branch locations. The statistics allow inferences regarding the population of single-unit firms but do not allow inferences regarding the population of all firms. The numbers of observations are rounded.
Source(s):
National Center for Science and Engineering Statistics and Census Bureau, 2018 Annual Business Survey: Data Year 2017.
Many of the commuting zones in table 4 are also included in table 5. Global city commuting zones with high predicted innovation rates and even higher observed innovation rates such as Austin, San Francisco, and San Jose, appear in both tables. In contrast, Boston, Los Angeles, New York, and Seattle appear in table 4 but not table 5 because the observed innovation rates were close to the predicted innovation rates. Denver, Aurora, Boulder, Fort Collins (Colorado); Portland, Vancouver, Hillsboro (Oregon/Washington); and Durham, Chapel Hill, Raleigh, Henderson (North Carolina) appear in both tables, but the regional innovative shift is in any product innovation, not the new-to-market innovation measure used in table 4. Commuting zones with relatively low predicted innovation rates but very high observed innovation rates include St. George, Cedar City (Utah); Casper (Wyoming); Wallowa (Oregon); and Bozeman, Helena (Montana). Commuting zones with a regional innovative shift in all product innovation that do not appear in the top 50 list include Jackson (Wyoming/Idaho); Cookeville (Tennessee); Elko, Winnemucca (Nevada); Kankakee (Illinois); and Orlando, Kissimmee, Sanford (Florida).
The examination of self-reported innovation rates within functional economic regions defined by commuting zones reinforces findings from the state-level, industry, settlement size, and establishment size analyses: innovation advantages do characterize some entities as expected, but aggregate differences are modest. Silicon Valley (San Jose), San Francisco, and Austin being included in table 4 and table 5 reflect a concentration in more innovative industries and excelling in those industries relative to national peers. Despite this double advantage, self-reported innovation rates do not demonstrate the marked spatial concentration observed in other innovation indicators such as R&D expenditures (Shackelford and Wolfe 2021) or venture capital funding (Florida and Hathaway 2018). Possible implications of these divergent findings are discussed in the conclusion.
Conclusion
The very large sample size in the inaugural 2017 ABS provides the unique opportunity to examine differences in regional self-reported innovation rates that was not possible with earlier federal collections of innovation data. Modest differences in regional innovation rates are explained by relatively small differences in innovation rates across the settlement hierarchy, and relatively high innovation rates among some low-tech or traditional industries are distributed throughout the country (see Gault 2016). The absence of large regional differences in self-reported innovation rates has significant implications for policy priorities that focus on expanding the geography of innovation, for the utility of the innovation measure in the analysis of economic growth and development, and for future analyses of the geography of self-reported innovation.
The positive measure of innovation collected in the ABS that focuses solely on the introduction of new products or significant change in existing products has a distinct advantage over a normative measure of successful innovation: it does not confound the separate processes of implementing a novel idea with the activities and resources associated with innovative success. The positive measure of innovation effectively captures the elements of the innovation process over which policy may have the least influence. Clearly, a counterfactual of some regions having much lower rates of self-reported innovation would pose a much greater threat to expanding the geography of innovation. If the building blocks of novelty generation and risk-taking behavior that are essential to any innovative endeavor are in short supply in a state or region, then investments in the resources to increase innovative success will be hamstrung from the outset. Instead, the available data demonstrate relatively small differences in the local propensity to bring new ideas to market.
The lack of variation in the self-reported innovation measure compared with wide regional variation in economic outcomes may help explain the relative disinterest of regional scientists and economic geographers in positive measures of self-reported innovation, at least in the United States. Self-reported innovation may be a relatively weak explanatory variable of economic growth. However, if novelty generation and risk aversion as inherent characteristics of a population are not as amenable to policy, then the independent effect of self-reported innovation on economic growth, by itself, may be uninformative. Self-reported innovation can be understood as a necessary but not sufficient condition for economic dynamism.
Research examining economic dynamism in places where it was unexpected found that single factors in isolation have little explanatory power (McGranahan, Wojan, and Lambert 2011). Entrepreneurial context may be similar to self-reported innovation as local data on self-employment, or the size of the small firm sector, do not consider the likelihood of success. McGranahan, Wojan, and Lambert (2011) found that entrepreneurial context did not explain employment or establishment growth well if not combined with local employment in creative occupations and an attractive endowment of natural amenities. Creative occupations and natural amenities were likewise relatively inert in explaining economic dynamism in areas with weak entrepreneurial context. The critical empirical question is what activities and resources are required to transform new ideas into impactful innovations. Reliable data on self-reported innovation at relatively small geographic scales will be valuable in identifying the requisite activities and resources and for evaluating policies and initiatives to expand the geography of impactful innovation.
The conjecture that self-reported innovation is analogous to entrepreneurial context in providing a necessary but not sufficient condition for economic dynamism can be empirically tested using the ABS microdata available in Federal Statistical Research Data Centers. Alternative explanations for the small regional differences in self-reported innovation rates owing to social desirability bias or other measurement errors should be examined. However, research using the Oslo Manual innovation questions in the ABS, supplemented with latent class analysis of establishment-level attributes thought to be associated with innovative capability, arrived at the conclusion that urban–rural differences in innovation rates were modest (Wojan and Parker 2017). At the micro level, this augmented measure of self-reported innovation was associated with higher rates of survival among manufacturing establishments, suggesting that the innovation questions are capturing information relevant to economic performance (Wojan, Crown, and Rupasingha 2018).
The data collection strategy of the National Center for Science and Engineering Statistics pertaining to self-reported innovation is to field a large ABS with a sample size of ~800,000 every 5 years, to align with the U.S. Economic Census reference years of 2017, 2022, and 2027. Intervening years, when the U.S. Economic Census is not conducted, will have a sample size of ~300,000. Limiting the geographic analysis to single-unit firms reduced usable sample size by more than a third. Replicating the analysis here will be possible when the 2023 ABS (reference year 2022) data become available. Longitudinal analysis that tracks the performance of 2017 ABS respondents through time via links to the Census Longitudinal Business Database will allow identifying factors that result in impactful outcomes when combined with self-reported innovation. This longitudinal approach can effectively be implemented in the intervening years between U.S. Economic Census years because examining performance of firms using microdata does not impose the very large sample size requirements for precise estimates of proportions from a binomial distribution.
References
Acemoglu D, Restrepo P. 2020. Robots and Jobs: Evidence from US Labor Markets. Journal of Political Economy 128(6):2188–2244. doi:10.1086/705716.
Arundel A, Smith K. 2013. History of the Community Innovation Survey. In Fred Gault, editor, Handbook of Innovation Indicators and Measurement, pp. 60–87. Cheltenham, UK: Edward Elgar Publishing.
Autor DH, Dorn D, Hanson GH. 2013. The Geography of Trade and Technology Shocks in the United States. American Economic Review 103(3):220–5. doi:10.3386/w18940.
Bell A, Chetty R, Jaravel X, Petkova N, Van Reenen J. 2019. Who Becomes an Inventor in America? The Importance of Exposure to Innovation, The Quarterly Journal of Economics 134(2):647–713. doi:10.1093/qje/qjy028.
Florida R, Hathaway I. 2018. Rise of the Global Startup City: The New Map of Entrepreneurship and Venture Capital. Washington, DC: Center for American Entrepreneurship.
Fowler CS, Jensen L. 2020. Bridging the Gap Between Geographic Concept and the Data We Have: The Case of Labor Markets in the USA. Economy and Space 52(7):1395–1414. doi:10.1177/0308518X20906154.
Fowler CS, Rhubart DC, Jensen L. 2016. Reassessing and Revising Commuting Zones for 2010: History, Assessment, and Updates for U.S. ‘Labor-Sheds’ 1990–2010. Population Research Policy Review 35:263–86. doi:10.1007/s11113-016-9386-0.
Gault F. 2016. User Innovation and Official Statistics. In Harhoff D, Lakhani KR, editors, Revolutionizing Innovation. Cambridge, MA: MIT Press.
Kindlon A; National Center for Science and Engineering Statistics (NCSES). 2021. First Comprehensive Innovation Survey for the United States: Data from the 2017 Annual Business Survey. NSF 21-334. Alexandria, VA: National Science Foundation. Available at https://ncses.nsf.gov/pubs/nsf21334/.
McGranahan DA, Wojan TR, Lambert DM. 2011. The Rural Growth Trifecta: Outdoor Amenities, Creative Class and Entrepreneurial Context. Journal of Economic Geography 11(3):529–57. doi:10.1093/jeg/lbq007.
National Science Board. 2020. Vision 2030. Report # NSB-2020-15. https://www.nsf.gov/nsb/publications/2020/nsb202015.pdf. Accessed 8 December 2021.
Organisation for Economic Co-operation and Development (OECD)/Eurostat. 2005. Guidelines for Collecting and Interpreting Innovation Data — The Oslo Manual, 3rd ed. Paris: OECD.
Peric S, Galindo-Rueda F. 2014. The Cognitive Testing of Innovation Survey Concepts, Definitions and Questions. Final report from the Improving the Measurement of Innovation: Supporting International Comparisons project, NSF Award #1114138.
Shackelford B. 2013. One in Five U.S. Businesses with R&D Applied for a U.S. Patent in 2008. InfoBrief NSF-13-307. Arlington, VA: National Science Foundation, National Center for Science and Engineering Statistics. Available at https://www.nsf.gov/statistics/infbrief/nsf13307/.
Shackelford B, Wolfe R; National Center for Science and Engineering Statistics (NCSES). 2021. Businesses Performed 60% of Their U.S. R&D in 10 Metropolitan Areas in 2018. NSF 21-331. Alexandria, VA: National Science Foundation. Available at https://ncses.nsf.gov/pubs/nsf21331.
Tuttle AD, Alvarado HA, Beck J. 2019. OECD Innovation Project: Findings from Early Stage Scoping Interviews in the United States Final Report. Research and Methodology Directorate, Center for Behavioral Science Methods Research Report Series. Survey Methodology #2019-05. Suitland, MD: Census Bureau. http://www.census.gov/content/dam/Census/library/working-papers/2019/adrm/rsm2019-05.pdf. Accessed 8 December 2021.
Wojan TR, Crown D, Rupasingha, A. 2018. Varieties of Innovation and Business Survival: Does Pursuit of Incremental or Far-Ranging Innovation Make Manufacturing Establishments More Resilient? Research Policy 47(9):1801–10. doi:10.1016/j.respol.2018.06.011.
Wojan T, Parker T. 2017. Innovation in the Rural Nonfarm Economy: Its Effect on Job and Earnings Growth, 2010-2014. Economic Research Report 238. Washington, DC: U.S. Department of Agriculture, Economic Research Service. https://www.ers.usda.gov/webdocs/publications/85191/err-238.pdf?v=6473.4. Accessed 8 December 2021.
World Bank. 2009. World Development Report 2009: Reshaping Economic Geography. Washington, DC: World Bank. http://documents1.worldbank.org/curated/en/730971468139804495/pdf/437380REVISED01BLIC1097808213760720.pdf. Accessed 18 August 2020.
Notes
1The exact wording of the product innovation question in the 2017 ABS is, “During the three years 2015 to 2017, did this business introduce new or significantly improved: a. Goods. (exclude the simple resale of new goods and changes of a solely aesthetic nature). A good is usually a tangible object such as a smartphone, furniture, or packaged software, but downloadable software, music and film are also goods. b. Services. A service is usually intangible, such as retailing, insurance, educational courses, air travel, consulting, etc.” The survey instrument is available at https://www.nsf.gov/statistics/srvyabs/surveys/srvyabs-2017-abs-1.pdf.
2The innovation rate is conventionally computed as the mean of a binomial (0 for non-innovating or 1 for innovating) distribution. To compute the predicted innovation rate, the 0 or 1 for each firm is replaced with the national innovation rate for the industry. The predicted innovation rate for a region is simply the mean of the predicted innovation rates across all industries in a region, essentially weighted by the number of firms in each industry with their corresponding sample weights.
3The correspondence of the single-unit innovation rates to innovation rates calculated on the full sample for states (Kindlon 2021) was assessed by calculating the rank order correlation. The rank order correlation of the published state innovation rates in the 2017 ABS and the single unit innovation rates is 0.98615, suggesting a very close correspondence. The largest difference in rank is for New York, which ranks 45th using the full sample ABS but 39th when limited to single-unit firms. Single-unit any product innovation rates are consistently 1.2% to 1.5% higher than the firm-level (single- and multi-unit) innovation rates.
Suggested Citation
Wojan TR; National Center for Science and Engineering Statistics (NCSES). 2022. The Geography of Self-Reported Innovation: Results from the 2017 Annual Business Survey. Working Paper NCSES 22-206. Alexandria, VA: National Science Foundation. Available at https://ncses.nsf.gov/pubs/ncses22206.
Contact Us
NCSES
National Center for Science and Engineering Statistics
Directorate for Social, Behavioral and Economic Sciences
National Science Foundation
2415 Eisenhower Avenue, Suite W14200
Alexandria, VA 22314
Tel: (703) 292-8780
FIRS: (800) 877-8339
TDD: (800) 281-8749
E-mail: ncsesweb@nsf.gov