 An official website of the United States government

Effects of the COVID-19 Pandemic on Employment, Earnings, and Professional Engagement: New Insights from the 2021 National Survey of College Graduates
The number of college graduates in the United States reached nearly 68.6 million in 2021, of which approximately 68 million had ever held a job, with nearly 52 million currently employed and 16 million not employed. Although the number of employed college graduates increased by 1.2 million (2.5%) between 2019 and 2021, the number of nonemployed college graduates increased by 2.5 million (17.9%). This large increase in nonemployment coincided with the COVID-19 pandemic and signals important changes in the labor market for college graduates.
This InfoBrief provides an overview of the effects of the COVID-19 pandemic on the college-educated workforce, drawing on new data from the National Survey of College Graduates (NSCG). In addition to collecting basic information on labor force status and earnings, the NSCG collects detailed information on reasons for nonemployment, access to various job benefits, participation in professional activities, and measures of job satisfaction. The 2021 cycle of the NSCG elicited additional information related to the pandemic, such as pandemic-related reasons for not working, presence of telework arrangements, and pandemic-related salary effects. Some of this information is highlighted below.
Labor Force Statuses and Reasons for Not Working
Table 1 presents the labor force status of college graduates in the United States in 2021, disaggregated by broad occupation and racial group. Roughly 52 million (76%) college graduates were employed. Among those employed, 44.2 million (85%) worked full time (i.e., worked 35 or more hours per week) and the remaining 7.6 million (15%) worked part time. Approximately 2.5 million of these part-time workers (33%) cited family responsibilities as a reason for their part-time status, 2.4 million (32%) cited an involuntary reduction of working hours, and 1.6 million (21%) cited a lack of available full-time jobs.
Labor force status of college graduates, by broad occupation, race, and ethnicity: 2021
AIAN = American Indian or Alaska Native; NHPI = Native Hawaiian or Other Pacific Islander; S&E = science and engineering.
a Hispanic or Latino may be any race; race categories exclude Hispanic origin.
b Approximately 668,000 college graduates who never worked are excluded from this table.
c Respondents were asked to select from a list of possible reasons to explain their part-time or not employed status and could select multiple reasons.
Note(s):
Numbers are rounded to the nearest 1,000. Survey respondents could report multiple reasons for not working or for working part time. Full-time employment is at least 35 hours per typical week of the survey reference year; part-time employment is less than 35 hours per typical week of the survey reference year. Not in the labor force are those not currently employed, who have not recently been laid off, and who are not actively searching for work. Unemployed are those currently not employed and who have actively searched for work in the last 4 weeks or were recently laid off from a job.
Source(s):
National Center for Science and Engineering Statistics, National Survey of College Graduates, 2021.
Substantial shares of individuals cited a pandemic-related consideration as the sole reason for not working full time. For example, of the 2.5 million indicating family responsibilities as a reason for working part time, 18% indicated the pandemic was the sole reason for these family responsibilities. Among those indicating that their hours were reduced, 54% attributed this reduction solely to the pandemic. Among those indicating that a full-time job was not available to them, 36% cited the pandemic as the only contributing factor. These breakdowns are generally consistent across occupation and racial groups. However, a larger share of Hispanic individuals (72%) than White individuals (52%) attributed their reduction in working hours solely to the pandemic.
Among the 16 million college graduates who reported not being employed, around 2.7 million (17%) of these individuals cited family responsibilities as a reason for not working. Another 2.2 million (14%) reported having been laid off from their primary job, and 9.6 million (60%) identified as being retired. Among those reporting family responsibilities as a reason for not working, 24% identified the pandemic as the sole cause of these responsibilities. This percentage was higher among Black (44%) and Hispanic (42%) individuals than among White individuals (19%). On the other hand, among those not working due to being laid off, 69% identified the pandemic as the sole contributing factor. Thus, it appears that underemployment and unemployment resulting from the pandemic was driven primarily by reduction in hours worked and by layoffs and to a lesser extent by increased family responsibilities.
Figure 1 places these numbers in perspective by reporting trends between 2015 and 2021 in the labor force status among college graduates in the United States. The share of this population employed full time trended downward over this period, from 66.8% in 2015 to 65.0% in 2021. On the other hand, the share of the population employed part time was flat from 2015 to 2019, and then it decreased, from 13.4% in 2019 to 11.2% in 2021. This decrease occurred as the unemployed share of the college graduate population increased from 2.5% in 2019 to 4.5% in 2021 and as the retired share of the population increased from 13.0% to 13.8% during that same period.
College graduates in the United States, by employment status: 2015–21
| Year | Employed full time | Employed part time | Unemployed | Not in labor force, not retired | Retired |
|---|---|---|---|---|---|
| 2015 | 66.8 | 13.0 | 2.8 | 5.8 | 11.6 |
| 2017 | 66.2 | 13.3 | 2.3 | 5.8 | 12.5 |
| 2019 | 65.3 | 13.4 | 2.5 | 5.8 | 13.0 |
| 2021 | 65.0 | 11.2 | 4.5 | 5.5 | 13.8 |
Note(s):
Full-time employment is at least 35 hours per week; part-time employment is less than 35 hours per week. Not in the labor force are those not currently employed, who have not recently been laid off, and who are not actively searching for work. Unemployed are those currently not employed and who have actively searched for work in the last 4 weeks or were recently laid off from a job. College graduates who have never worked are excluded from this table.
Source(s):
National Center for Science and Engineering Statistics, National Survey of College Graduates.
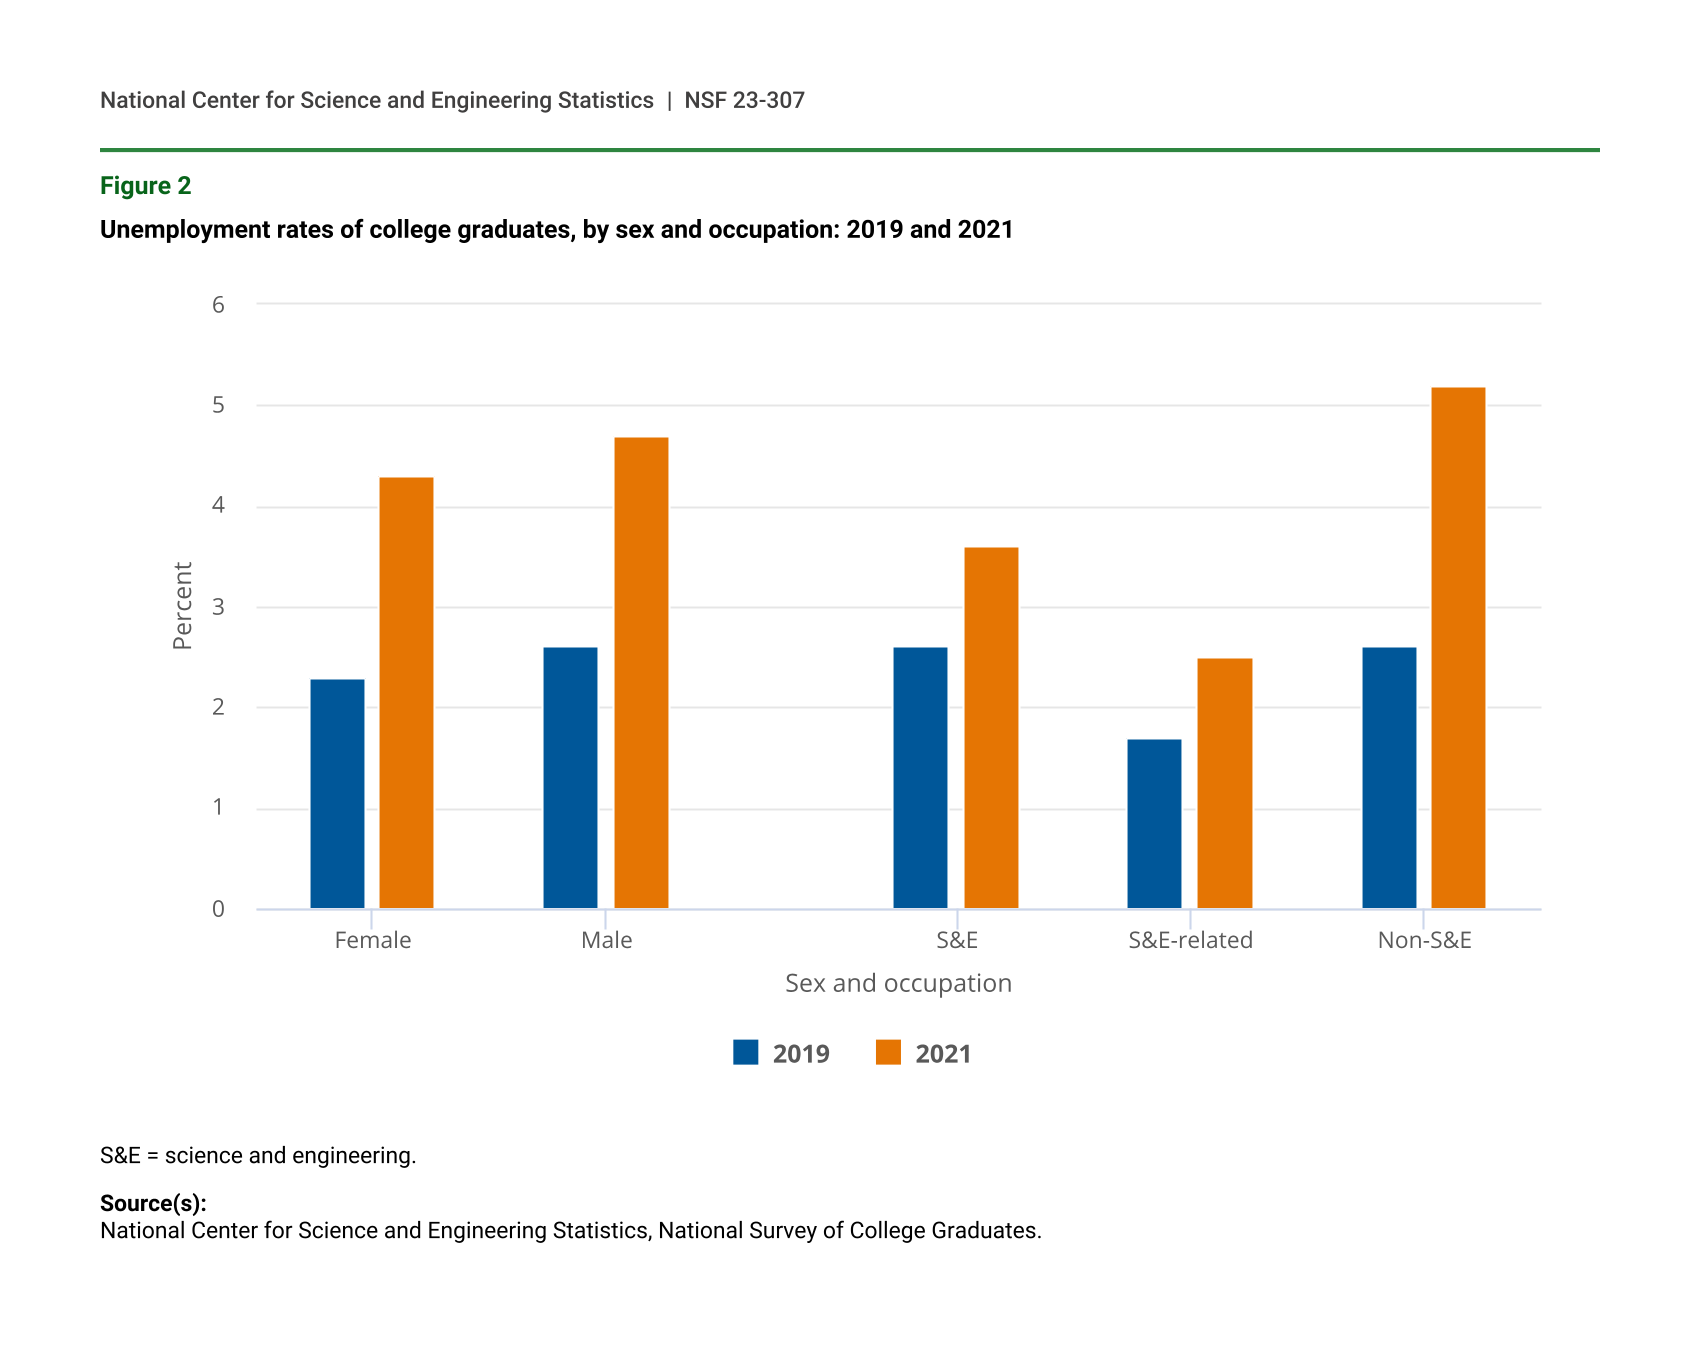
Figure 2 focuses on changes in unemployment among college graduates between 2019 and 2021, reporting results for each of these two survey cycles across sex and occupation groups. Although the science and engineering (S&E) and S&E-related occupation groups experienced relatively small percentage point changes in unemployment rates between 2019 and 2021, non-S&E occupations experienced larger changes. The share of college graduates who were unemployed increased by 1.0 percentage point for the S&E group, 0.8 percentage point for the S&E-related group, and a full 2.5 percentage points for the non-S&E group.
Unemployment rates of college graduates, by sex and occupation: 2019 and 2021
| Sex and occupation | 2019 | 2021 |
|---|---|---|
| Female | 2.3 | 4.3 |
| Male | 2.6 | 4.7 |
| S&E | 2.6 | 3.6 |
| S&E-related | 1.7 | 2.5 |
| Non-S&E | 2.6 | 5.2 |
S&E = science and engineering.
Source(s):
National Center for Science and Engineering Statistics, National Survey of College Graduates.
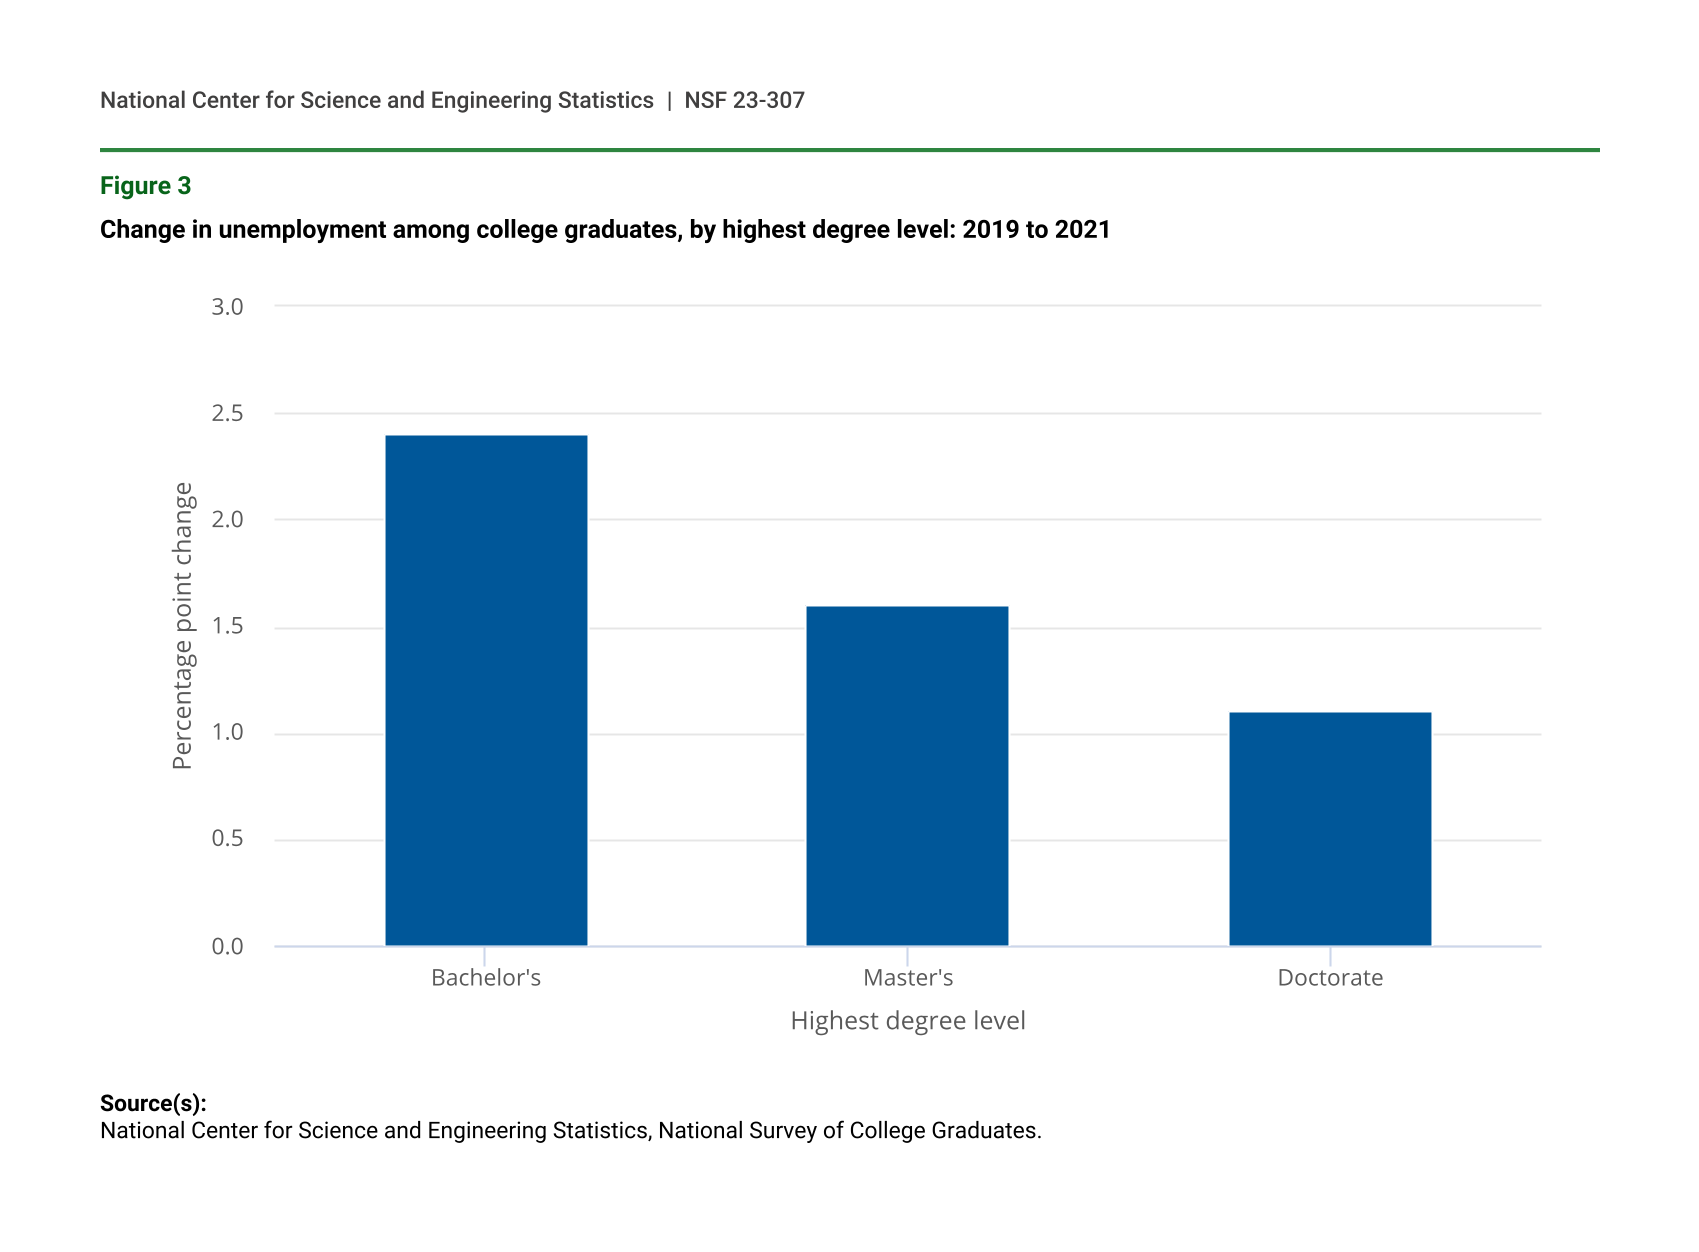
Figure 3 further explores changes in unemployment rate between 2019 and 2021 by disaggregating by highest degree type. Unemployment increased across all levels of education over this period. The percentage point change in the unemployment rate was largest for bachelor’s degree holders (2.4 percentage points). By 2021, the unemployment rate for those with bachelor’s degrees exceeded the rate for those with doctoral degrees by 2.6 percentage points (5.3% versus 2.7%) and exceeded the rate for those with master’s degrees by 1.9 percentage points (5.3% versus 3.4%).
Change in unemployment among college graduates, by highest degree level: 2019 to 2021
| Highest degree level | Change in unemployment rate |
|---|---|
| Bachelor's | 2.4 |
| Master's | 1.6 |
| Doctorate | 1.1 |
Source(s):
National Center for Science and Engineering Statistics, National Survey of College Graduates.
Earnings and Salaries
Table 2 complements the above data on labor force status by showing trends in median real earnings from survey years 2015–21 (calendar years 2014–20, because the NSCG asks about annual earnings for the prior calendar year). Earnings are expressed in constant 2021 U.S. dollars by inflating pre-2021 earnings observations according to the Consumer Price Index published by the Bureau of Labor Statistics. Median annual earnings of all college-educated workers who were employed at some time during calendar years 2014 to 2020 experienced growth even through the pandemic. Full-time employees obtained a 5.1% ($3,900) increase in median earnings from $76,700 in 2014 to $80,600 in 2020. When also considering earnings from part-time employees, median earnings rose 7.2% ($4,800) from $66,400 to $71,200 during that period.
Table 2 also considers the median earnings of the total population of college graduates with previous employment history, by including those who did not work at all during the prior calendar year. This series shows slight growth in median earnings between 2014 and 2018, followed by stagnation from 2018 to 2020. These patterns suggest that part-time wages boosted median earnings growth during this period, but not enough to overcome the added effects of nonemployment during the pandemic.
Median annual real earnings of college graduates: 2014–20
Note(s):
The National Survey of College Graduates asks respondents to report their total earned income in the year prior to the survey reference year. Earnings are expressed in constant 2021 U.S. dollars by inflating pre-2021 earnings observations according to the Consumer Price Index published by the Bureau of Labor Statistics. Full-time employment is at least 35 hours per typical week of the survey reference year; part-time employment is less than 35 hours per typical week of the survey reference year. College graduates who have never worked are excluded from this table.
Source(s):
National Center for Science and Engineering Statistics, National Survey of College Graduates.
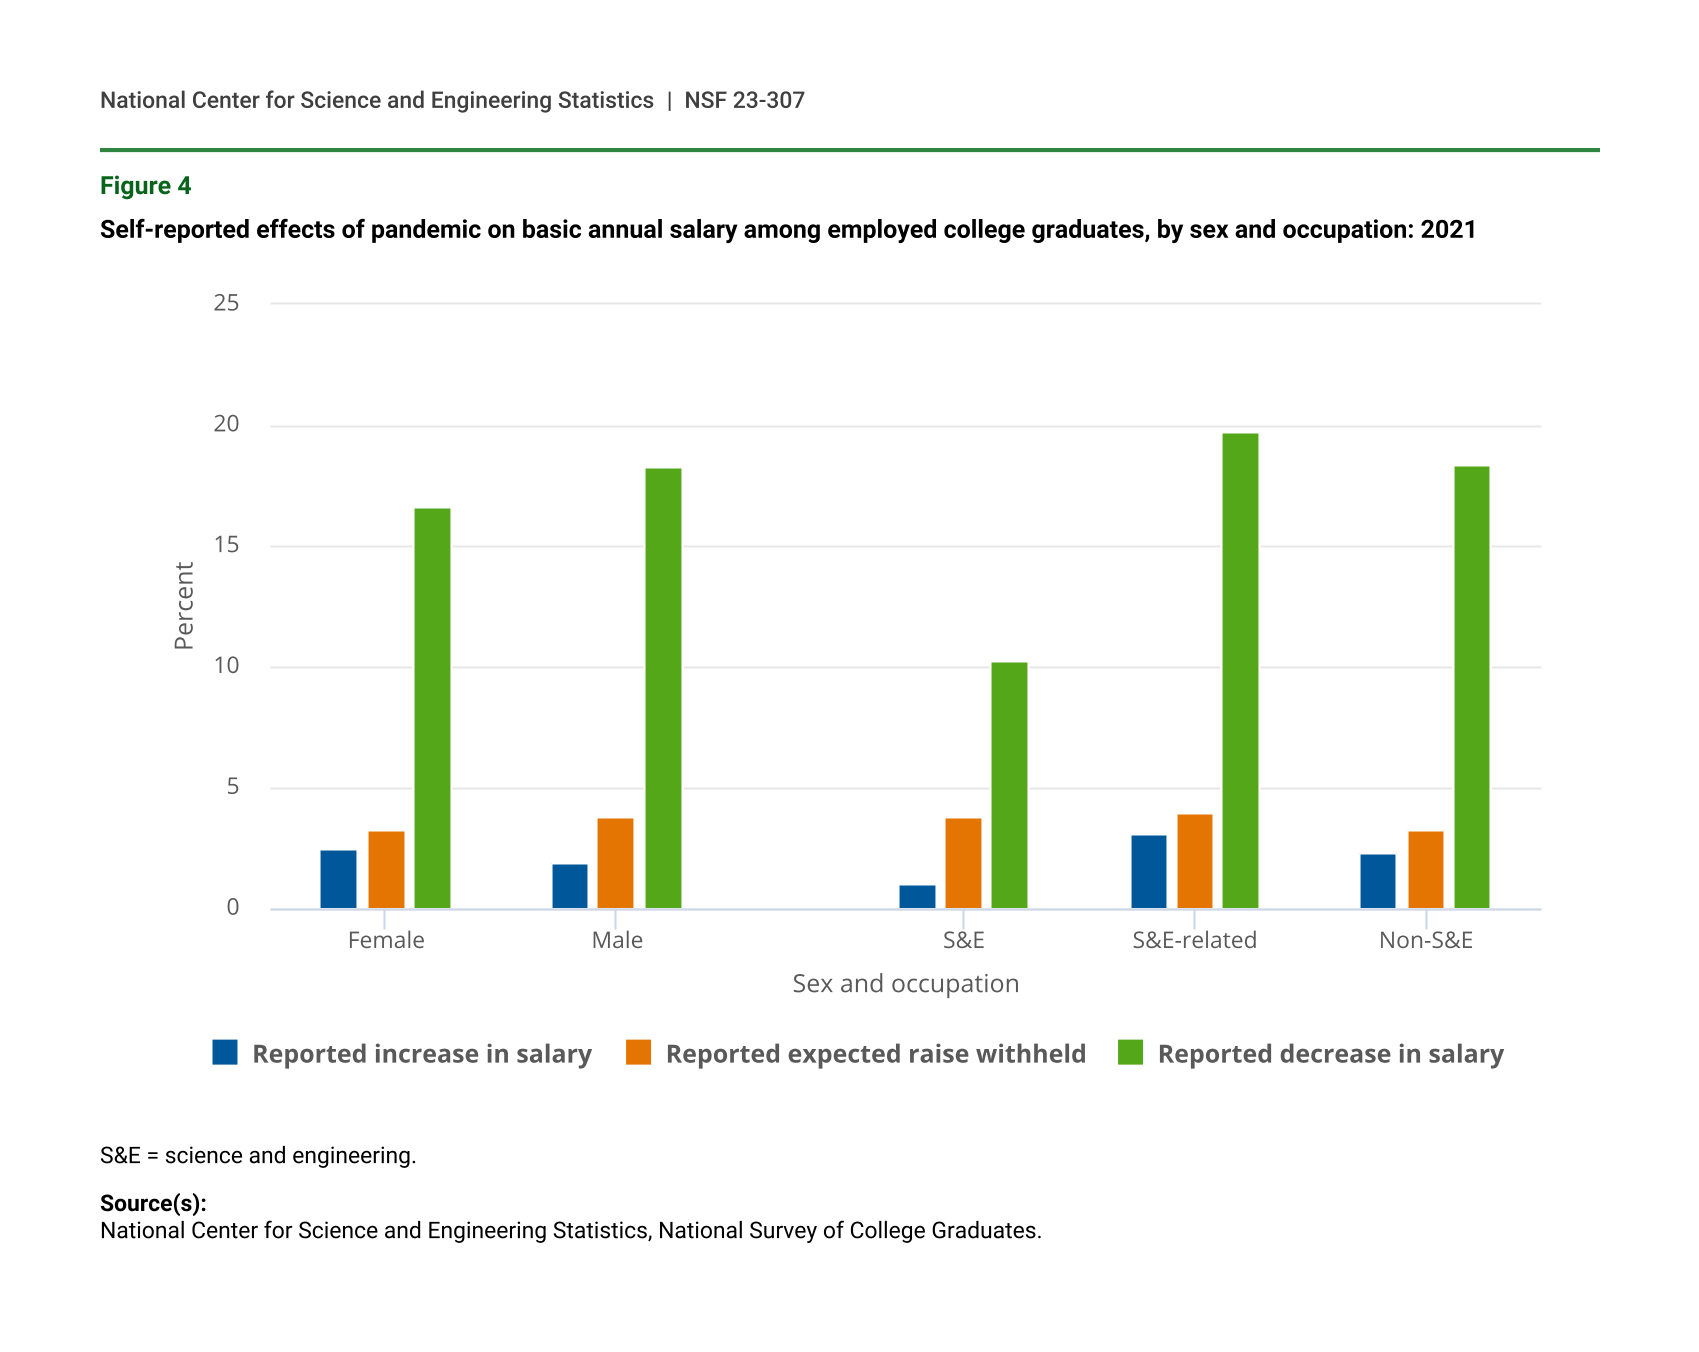
Figure 4 focuses on respondents employed in 2021 and the self-reported effects of the pandemic on basic annual salaries in their primary jobs. Very few respondents reported that the pandemic caused an increase in their salary. A modest share of respondents reported that the pandemic caused an expected raise or a cost-of-living adjustment to be withheld. A sizable share of respondents reported a decline in salary due to the pandemic. This share amounted to 16.6% for women, 18.3% for men, 10.3% for those employed in S&E occupations, 19.7% for those employed in S&E-related occupations, and 18.4% for those employed in non-S&E occupations. These patterns continue to highlight a larger disruptive effect that the pandemic had on labor market outcomes among those with careers in occupations outside of S&E.
Self-reported effects of pandemic on basic annual salary among employed college graduates, by sex and occupation: 2021
| Sex and occupation | Reported increase in salary | Reported expected raise withheld | Reported decrease in salary |
|---|---|---|---|
| Female | 2.5 | 3.3 | 16.6 |
| Male | 1.9 | 3.8 | 18.3 |
| S&E | 1.0 | 3.8 | 10.3 |
| S&E-related | 3.1 | 4.0 | 19.7 |
| Non-S&E | 2.3 | 3.3 | 18.4 |
S&E = science and engineering.
Source(s):
National Center for Science and Engineering Statistics, National Survey of College Graduates.
Professional Engagement
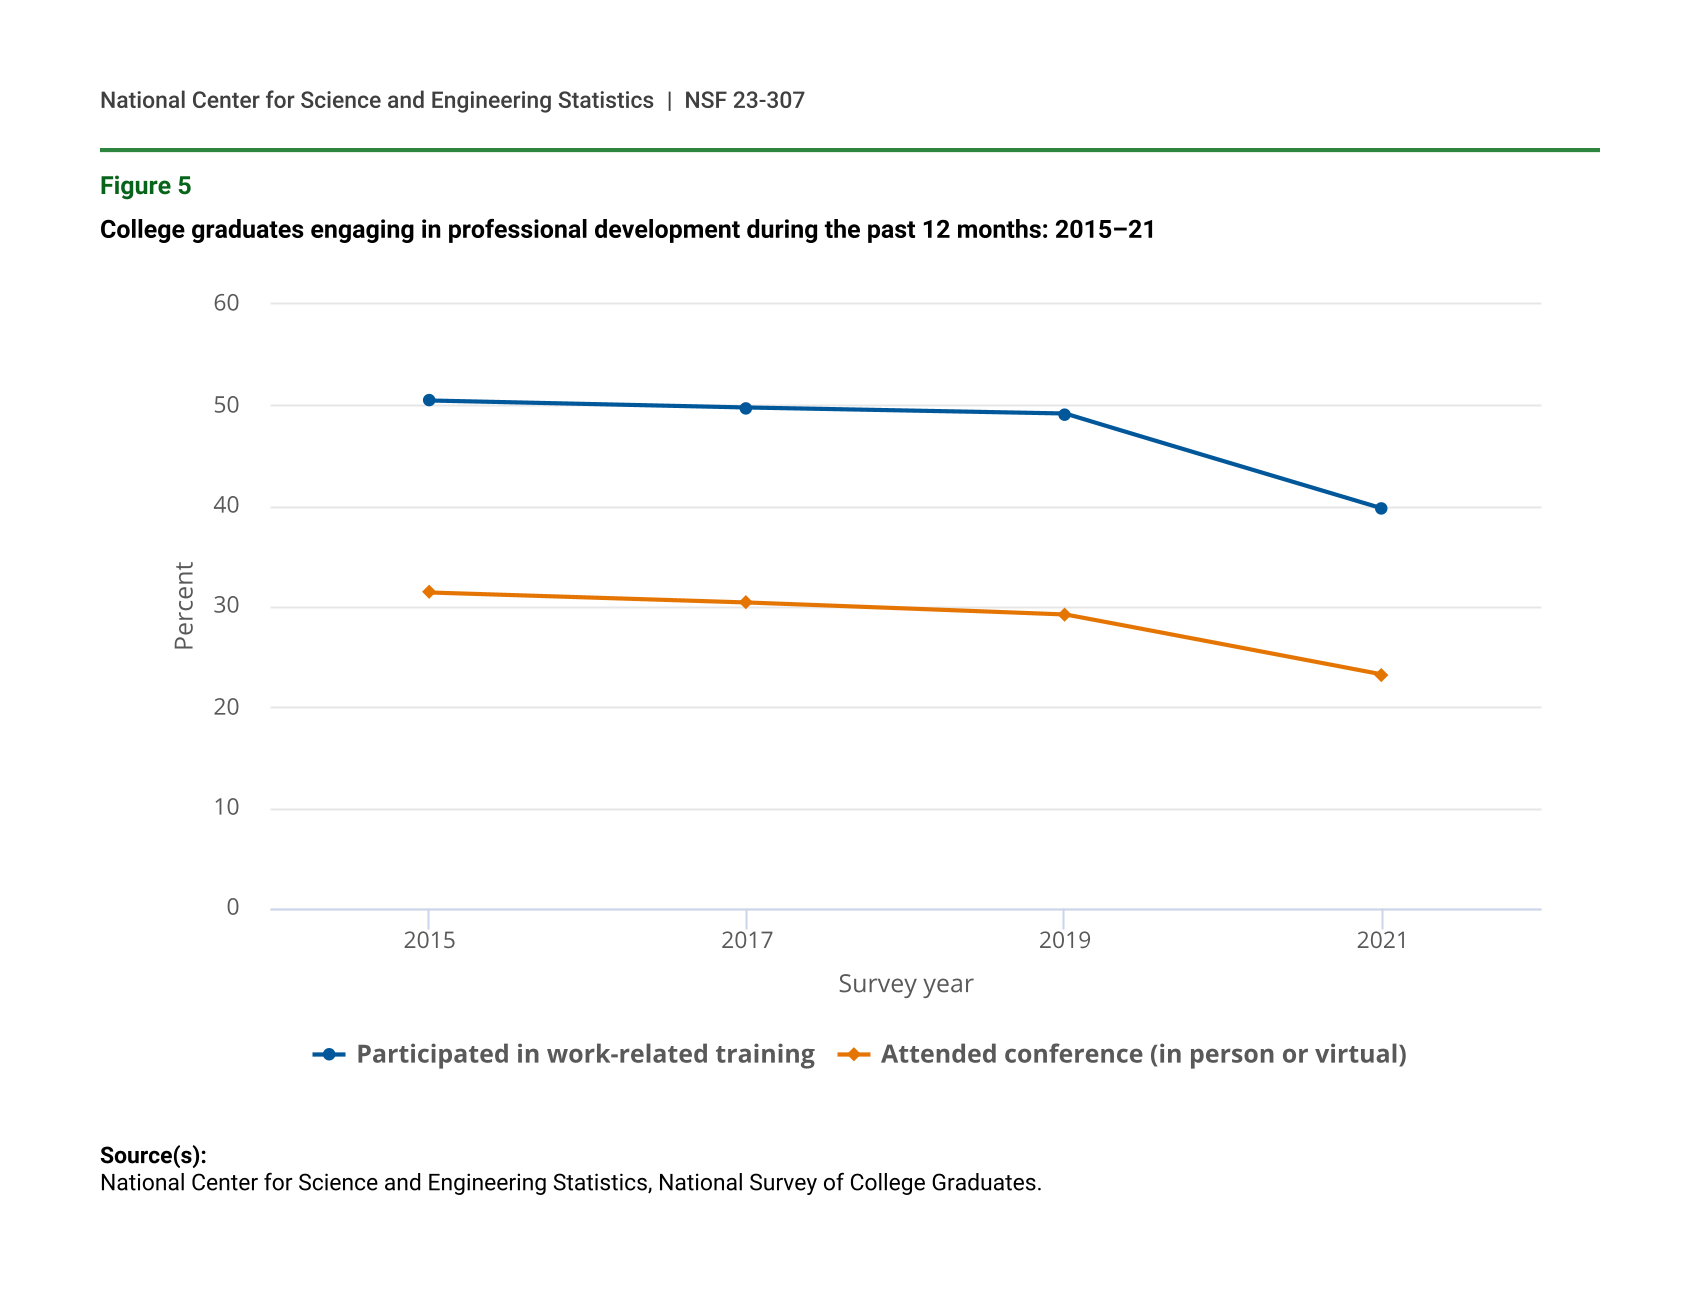
Figure 5 through figure 7 present information on other salient aspects of the career experience. Figure 5 shows the 2015–21 trend in the share of all college graduates that participated in work-related training activities in the prior 12 months, as well as trends in the share that attended a professional conference in the prior 12 months. The share of individuals participating in training declined modestly between 2015 and 2019, from 50.4% to 49.1%, but then it declined sharply to 39.7% in 2021. Similarly, the share of individuals attending a conference declined from 31.4% in 2015 to 29.2% in 2019, but then it declined sharply to 23.2% in 2021. This decline is notable, given the expansion of virtual attendance opportunities.
College graduates engaging in professional development during the past 12 months: 2015–21
| Survey year | Participated in work-related training | Attended conference (in person or virtual) |
|---|---|---|
| 2015 | 50.4 | 31.4 |
| 2017 | 49.7 | 30.4 |
| 2019 | 49.1 | 29.2 |
| 2021 | 39.7 | 23.2 |
Source(s):
National Center for Science and Engineering Statistics, National Survey of College Graduates.
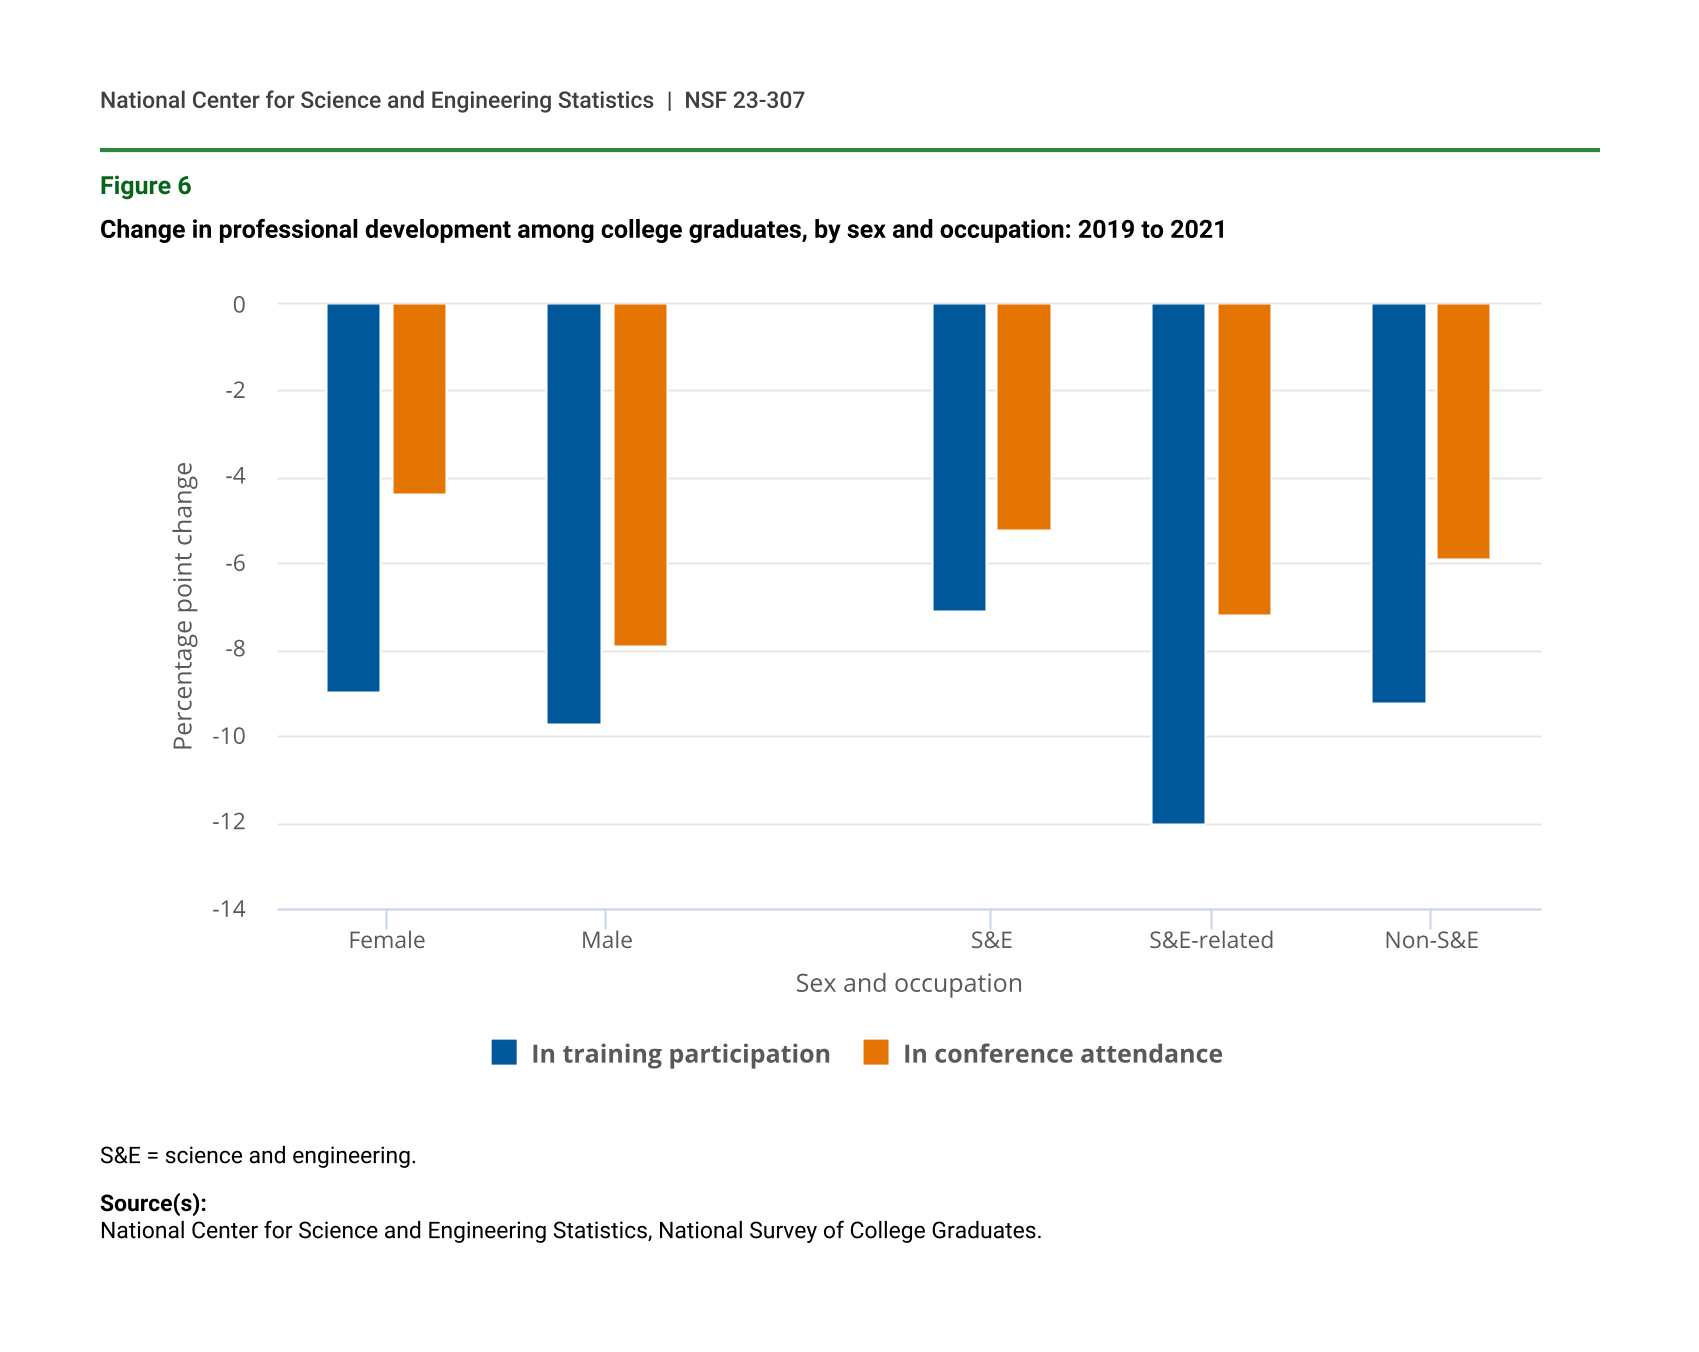
Figure 6 shows heterogeneity in the 2019–21 decline in professional development across sex and occupation subgroups. For the percentage of respondents who reported attending any professional meeting or conference in the past 12 months, men showed a greater percentage point decrease between 2019 and 2021 than did women (-7.9% versus -4.4%). Consistent with the above findings on employment and earnings, a smaller decline in professional engagement was seen within S&E occupations than within other occupations. For example, those working in S&E occupations experienced a 7.1 percentage point decline in attending any work-related training, whereas those working in non-S&E occupations and S&E-related occupations experienced a 9.2 and 12.0 percentage point decline in training attendance, respectively.
Change in professional development among college graduates, by sex and occupation: 2019 to 2021
| Sex and occupation | In training participation | In conference attendance |
|---|---|---|
| Female | -9.0 | -4.4 |
| Male | -9.7 | -7.9 |
| S&E | -7.1 | -5.2 |
| S&E-related | -12.0 | -7.2 |
| Non-S&E | -9.2 | -5.9 |
S&E = science and engineering.
Source(s):
National Center for Science and Engineering Statistics, National Survey of College Graduates.
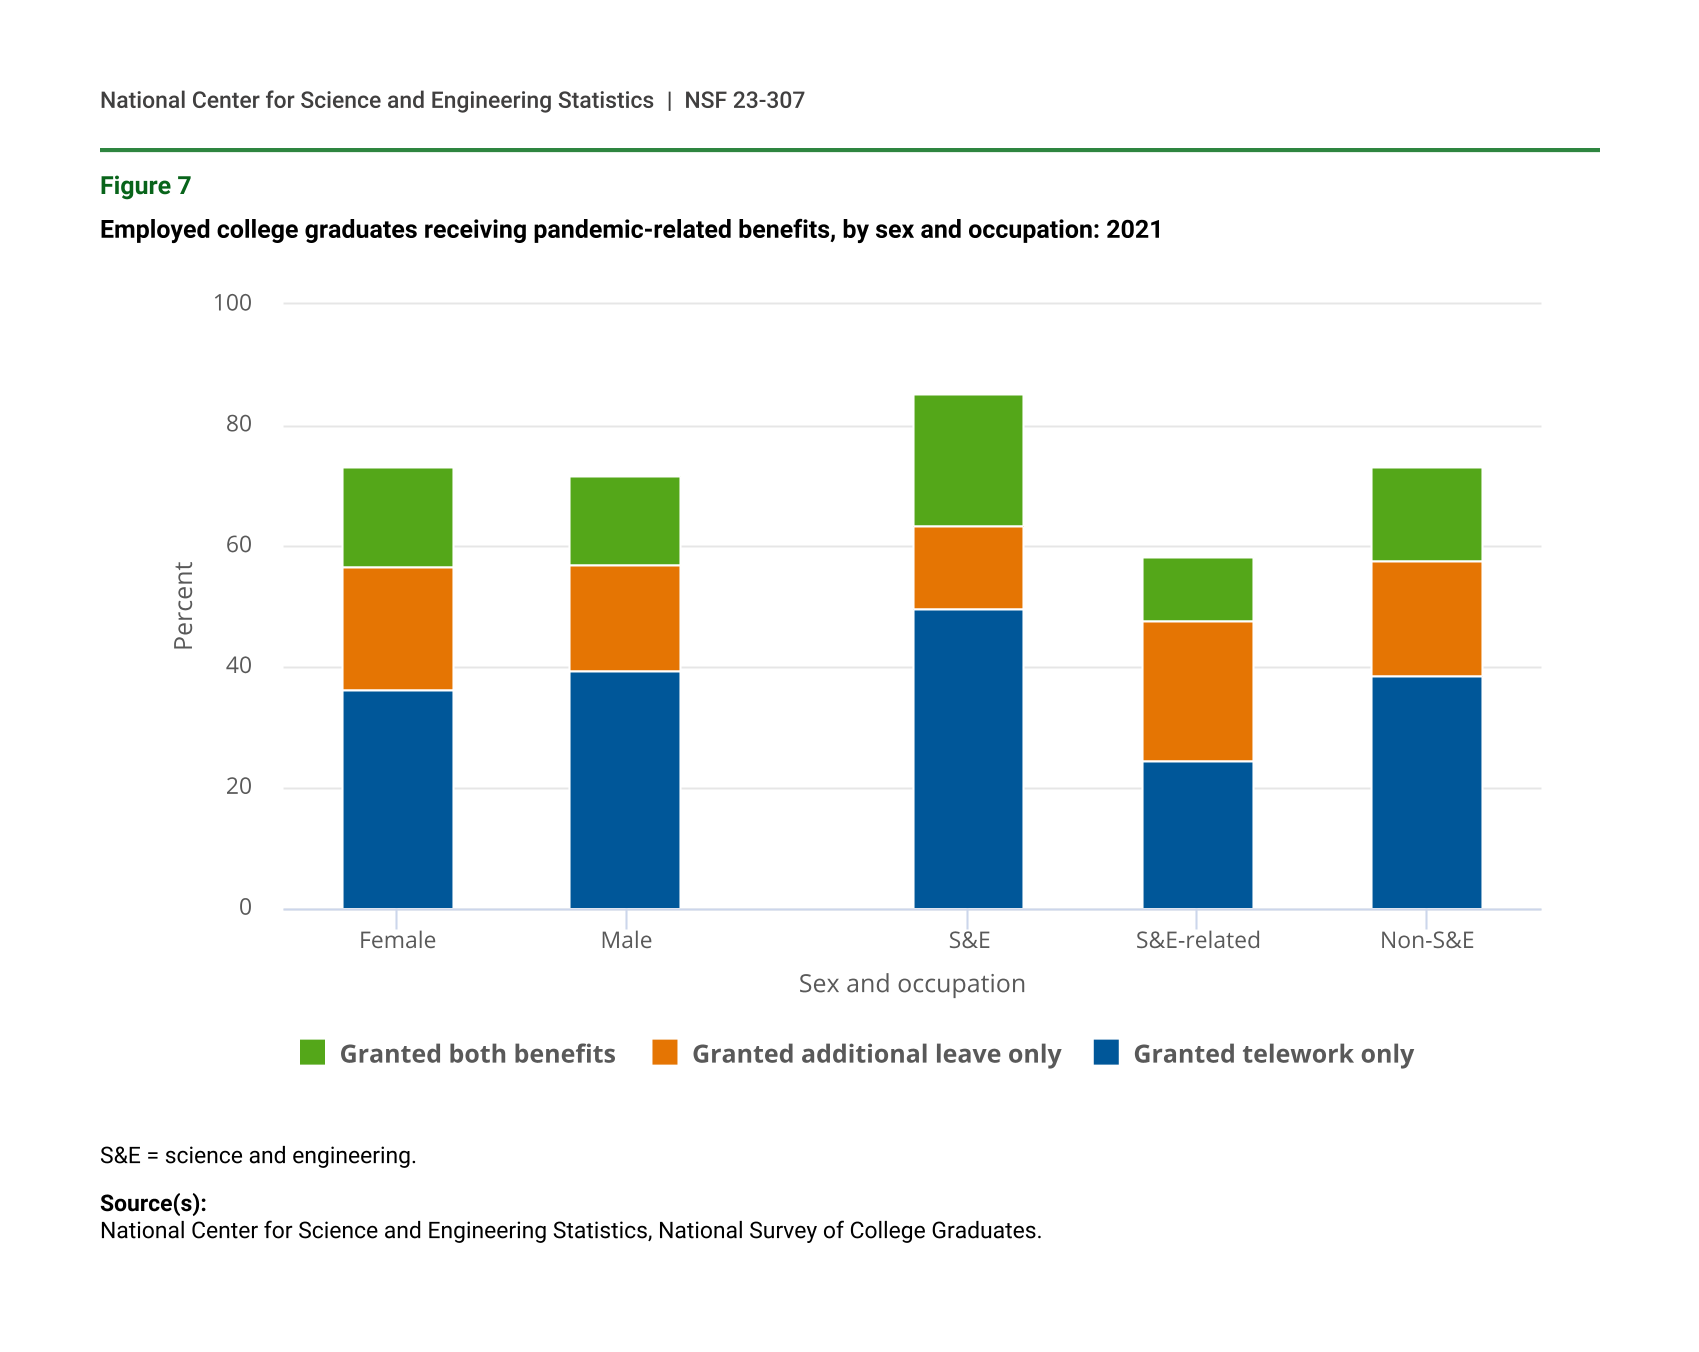
Finally, figure 7 reports on the shares of workers receiving certain additional benefits due to the pandemic across sex and occupation subgroups. Approximately 36.2% of female workers and 39.3% of male workers reported being granted telework because of the pandemic, without additional pandemic-related leave granted. In addition, 20.5% of women and 17.5% of men reported access to additional pandemic-related paid leave, without access to telework. Finally, 16.3% of women and 14.9% of men reported having access to both telework and additional paid leave benefits. This suggests that many employers adapted their working arrangements and expectations in response to the pandemic, likely to comply with social-distancing measures or to allow workers to cope with additional stress and family responsibilities. However, this response was not uniform across occupation groups. S&E occupations responded strongly to the pandemic, with 49.5% of workers reporting new access to telework without additional paid leave, and 21.7% of workers reporting new access to both telework and additional paid leave. On the other hand, in non-S&E occupations, 38.6% of workers reported new access to telework without additional paid leave, and 15.6% reported new access to both telework and additional paid leave.
Employed college graduates receiving pandemic-related benefits, by sex and occupation: 2021
| Sex and occupation | Granted telework only | Granted additional leave only | Granted both benefits |
|---|---|---|---|
| Female | 36.2 | 20.5 | 16.3 |
| Male | 39.3 | 17.5 | 14.9 |
| S&E | 49.5 | 14.1 | 21.7 |
| S&E-related | 24.5 | 23.0 | 10.8 |
| Non-S&E | 38.6 | 19.0 | 15.6 |
S&E = science and engineering.
Source(s):
National Center for Science and Engineering Statistics, National Survey of College Graduates.
Definitions and Classifications
Universe of analysis: All NSCG respondents who reported ever having worked for pay or profit.
Full-time employed: Those who were employed during the week of 1 February of the survey reference year and working at least 35 hours in a typical week on their principal job.
Part-time employed: Those who were employed during the week of 1 February of the survey reference year and working less than 35 hours in a typical week on their principal job.
Not in labor force: Those who were not employed during the week of 1 February of the survey reference year, not recently laid off, and not actively searching for work.
Unemployed: Those who were not employed during the week of 1 February of the survey reference year and who had actively searched for work in the preceding 4 weeks or were recently laid off from a job.
Not working (nonemployed): Those indicating they did not work for pay or profit during the week of 1 February of the survey reference year. These individuals are either unemployed or are not in the labor force.
Real earnings: Total earnings from employment in a given calendar year, expressed in 2021 U.S. dollars. Total earnings from employment are categorized by employment status (e.g., full time) using hours worked per typical week at the principal job in the survey reference year, which is 1 year after the calendar year in which the earnings are realized.
S&E occupations: Biological, agricultural, and environmental life scientists; computer and mathematical scientists; physical scientists; social scientists; engineers; and post-secondary teachers in these fields.
S&E-related occupations: Health-related occupations, S&E managers, S&E precollege teachers, S&E technicians and technologists, architects, actuaries, and postsecondary teachers in these fields.
Non-S&E occupations: Occupations that are neither S&E occupations nor S&E-related occupations.
Data Sources and Limitations
Data presented here are from the 2021 NSCG, sponsored by the National Center for Science and Engineering Statistics within the National Science Foundation. The NSCG surveyed approximately 164,000 individuals representing the college-educated population residing in the United States and younger than 76 during the week of 1 February 2021 with at least one degree (bachelor’s degree or higher) earned (in the United States or abroad) before 1 January 2020. The resulting data contain approximately 106,000 completed responses. For further survey information, please visit the NSCG website at www.nsf.gov/statistics/srvygrads.
The estimates in this InfoBrief are based on responses from a sample of the population and may differ from actual values because of sampling variability or other factors. As a result, apparent differences between the estimates for two or more groups may not be statistically significant. All comparative statements in this InfoBrief have undergone statistical testing and are significant at the 90% confidence level unless otherwise noted. The variances of estimates in this report were calculated using the successive difference replication method.
Data presented in this InfoBrief are now available for custom tabulations through the Scientists and Engineers Statistical Data System (SESTAT) Data Tool at https://ncsesdata.nsf.gov/sestat/. The NSCG public use data files are available for download from https://ncsesdata.nsf.gov/datadownload/. Data from the NSCG are also included in NSF reports, such as Science and Engineering Indicators and Women, Minorities, and Persons with Disabilities in Science and Engineering.
Notes
1The National Survey of College Graduates includes ages up to and including 75, and the median age of respondents was 46 in the 2019 and 2021 cycles. Approximately 668,000 college graduates in 2021—less than 1% of the population—have never worked for pay or profit and are excluded from this analysis of pandemic-related changes to employment. All references to workers or employment status in this report refer to the college-educated population aged 75 and younger.
2For those not currently working when responding to the NSCG, the survey instrument asks about occupation when one last worked.
3Respondents were asked to select from a list of possible reasons to explain their part-time or non-employed status. Respondents could select multiple reasons.
4Those with professional degrees are excluded from this analysis due to lack of reliability.
5Specifically, the CPI-U (consumer price index for all urban consumers) series was used. Series is available at Top Picks (Most Requested Statistics) (https://data.bls.gov/cgi-bin/surveymost?cu).
6This analysis looks at salary only and does not consider other forms of financial support.
7The 2021 cycle of the NSCG changed the response field on the question to capture virtual conference attendance in addition to in-person attendance.
Correction(s)
Suggested Citation
Binder AJ, Dillon M, Milan L, Phou K; National Center for Science and Engineering Statistics (NCSES). 2023. Effects of the COVID-19 Pandemic on Employment, Earnings, and Professional Engagement: New Insights from the 2021 National Survey of College Graduates. NSF 23-307. Alexandria, VA: National Science Foundation. Available at https://ncses.nsf.gov/pubs/nsf23307/.
Contact Us
NCSES
National Center for Science and Engineering Statistics
Directorate for Social, Behavioral and Economic Sciences
National Science Foundation
2415 Eisenhower Avenue, Suite W14200
Alexandria, VA 22314
Tel: (703) 292-8780
FIRS: (800) 877-8339
TDD: (800) 281-8749
E-mail: ncsesweb@nsf.gov
NSF 23-307
|January 27, 2023