 An official website of the United States government

University Science and Engineering Research Space Increased More Than 30 Million Square Feet in the Past Decade
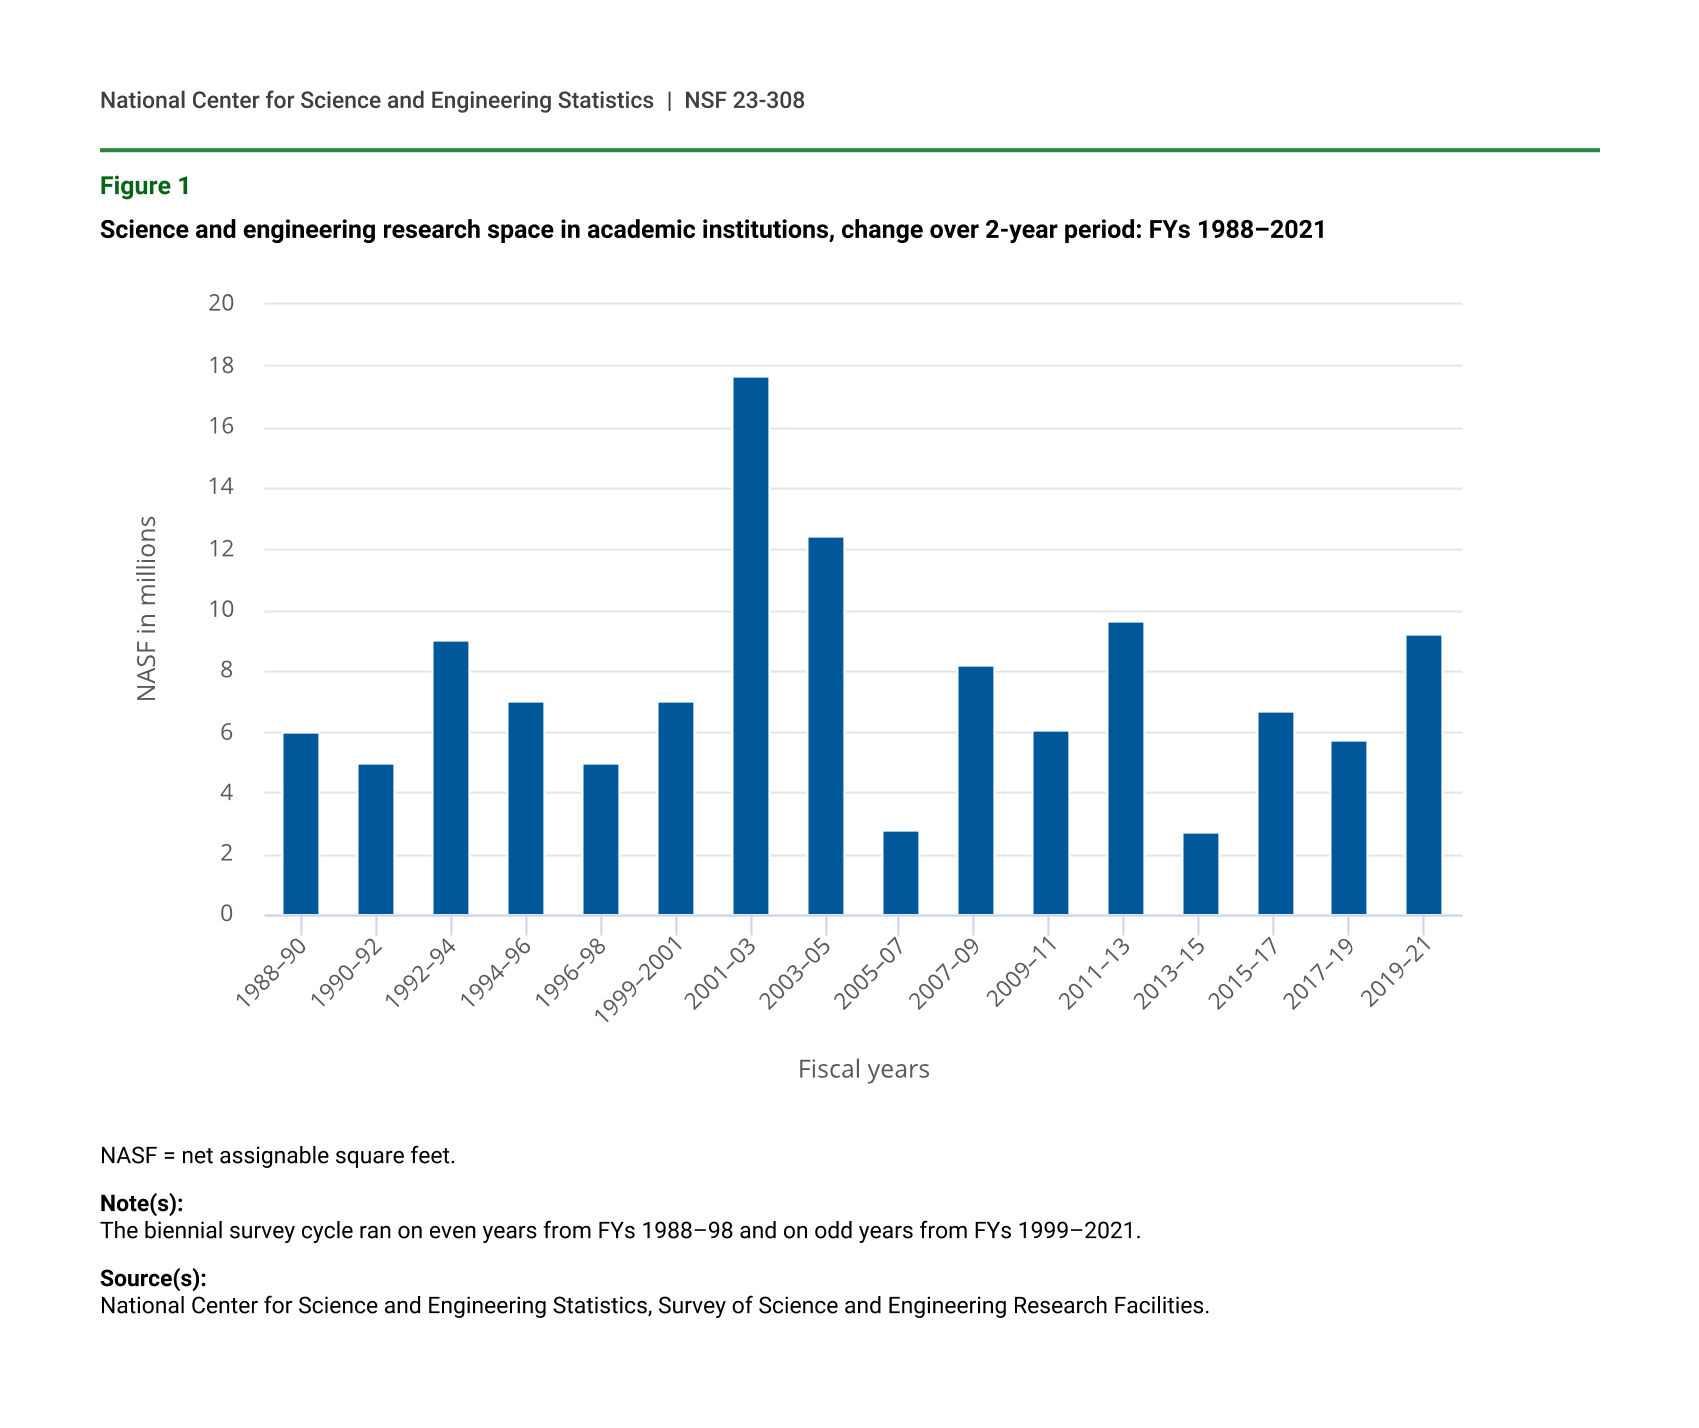
The nation’s research-performing universities and colleges reported 236.1 million net assignable square feet (NASF) of science and engineering (S&E) research space in FY 2021 (table 1), an increase of 34 million NASF since FY 2011. Research space is a key component in the infrastructure that enabled U.S. colleges and universities to conduct almost $85 billion in S&E research in FY 2021. The FY 2021 research space total was also 9.2 million NASF (4.1%) more than in FY 2019 (figure 1), according to the biennial Survey of Science and Engineering Research Facilities, conducted by the National Center for Science and Engineering Statistics (NCSES) within the National Science Foundation (see “Data Notes” for definitions of research space and NASF).
Five fields accounted for nearly 84% of total S&E research space in FY 2021. Biological and biomedical sciences accounted for the largest share of all research space in FY 2021 with 25% of the total. The next four largest fields were engineering (17%), health sciences (17%), agricultural sciences (14%), and physical sciences (10%). No other field accounted for more than 4% of total S&E research NASF. The remaining fields, when combined, accounted for about 16% of total research space and added 1.7 million NASF between FY 2019 and FY 2021.
NCSES reassigned the locations of some subfields of S&E to other broad S&E fields for the FY 2021 survey to ensure uniformity in reporting across its various surveys. The impact of this change can be seen as a factor in the decrease in health sciences research space (800 thousand NASF) as veterinary biomedical and clinical sciences and veterinary medicine were recategorized from health sciences to agricultural sciences. This added to the growth in agricultural sciences research space (4.1 million NASF) from FY 2019 to FY 2021.
Research space within medical schools reached 51.5 million NASF in FY 2021 and accounted for 22% of total research space at academic institutions. The national total increased 1.8 million NASF from FY 2019 to FY 2021, following an increase of 2.2 million NASF from FY 2017 to FY 2019. Medical school research space remained virtually unchanged from FY 2011 to FY 2017. The change is due to both increased R&D space over the period and the ability of some institutions to report medical school R&D space more accurately than was done in the past.
Science and engineering research space in academic institutions, by field and research animal space: FYs 2011–21
na = not applicable; see notes below.
S&E = science and engineering.
a Medical school space and research animal space are listed separately and are also included in individual field totals.
Note(s):
Fields of science and engineering and their disciplines were revised in FY 2015. Specifically, "Agricultural sciences and natural resources sciences" was split into "Agricultural sciences" and "Natural resources and conservation." Prior to FY 2015, data for "Natural resources and conservation" are included in "Agricultural sciences." Details may not add to totals due to rounding.
Source(s):
National Center for Science and Engineering Statistics, Survey of Science and Engineering Research Facilities.
Science and engineering research space in academic institutions, change over 2-year period: FYs 1988–2021
| Fiscal years | NASF change |
|---|---|
| 1988–90 | 6.0 |
| 1990–92 | 5.0 |
| 1992–94 | 9.0 |
| 1994–96 | 7.0 |
| 1996–98 | 5.0 |
| 1999–2001 | 7.0 |
| 2001–03 | 17.7 |
| 2003–05 | 12.4 |
| 2005–07 | 2.8 |
| 2007–09 | 8.2 |
| 2009–11 | 6.1 |
| 2011–13 | 9.6 |
| 2013–15 | 2.7 |
| 2015–17 | 6.7 |
| 2017–19 | 5.7 |
| 2019–21 | 9.2 |
NASF = net assignable square feet.
Note(s):
The biennial survey cycle ran on even years from FYs 1988–98 and on odd years from FYs 1999–2021.
Source(s):
National Center for Science and Engineering Statistics, Survey of Science and Engineering Research Facilities.
New Construction of Research Space
New research space is added each year through new construction projects, the repurposing of existing space, and occasional acquisitions. Similarly, some space is withdrawn from use through decommissioning and repurposing. As part of this process, academic institutions broke ground on 4.0 million NASF of new S&E research space construction projects in FYs 2020–21 (table 2), costing almost $4.5 billion. These totals were noticeably lower than in recent years due at least in part to delays institutions attributed to the COVID-19 pandemic. Although some of the new construction was completed within this time frame, some projects extended beyond FY 2021, so the research space was not yet in use. Projects designed for biological and biomedical sciences (1.0 million NASF) and engineering (1.0 million NASF) research accounted for half of new research space construction started in FYs 2020–21. About a quarter of projects started were for new research space in agricultural sciences (13%) and health sciences (13%).
New construction of science and engineering research space in academic institutions, by field and time of construction: FYs 2010–21
* = value > 0 but < 50,000 net assignable square feet; na = not applicable; see notes below.
S&E = science and engineering.
a Medical school space is listed separately and is also included in individual field totals.
Note(s):
Fields of science and engineering and their disciplines were revised in FY 2015. Specifically, "Agricultural sciences and natural resources sciences" was split into "Agricultural sciences" and "Natural resources and conservation." Prior to FY 2015, data for "Natural resources and conservation" are included in "Agricultural sciences." Details may not add to totals due to rounding.
Source(s):
National Center for Science and Engineering Statistics, Survey of Science and Engineering Research Facilities.
U.S. universities and colleges reported that they planned to start 10.6 million NASF of new S&E research space construction in FY 2022 or FY 2023, with projected costs of $12.8 billion. The planned NASF total is the highest since 2008–09 (13.4 million NASF). From 2010–11 to 2020–21, total planned new construction was between 8.4 million NASF and 10.2 million NASF for each biennial period. Because institutions’ budgets and priorities may change unexpectedly, not all planned projects are started during the projected time frame.
Repair and Renovation
Academic institutions expended $4.9 billion on major repairs and renovations of S&E research space started in FY 2020 or FY 2021 (table 3). Costs for research space improvements exceeded $1 billion in biological and biomedical sciences ($1.6 billion) and in health sciences ($1.1 billion), followed by $732 million in engineering and $533 million in physical sciences research space. Combined, these four fields accounted for 80% of all research space repair and renovation costs. Four additional fields had research space improvement costs exceeding $100 million: agricultural sciences ($238 million), computer and information sciences ($162 million), geosciences, atmospheric sciences, and ocean sciences ($155 million), and social sciences ($112 million).
Institutions anticipate $6.1 billion in costs for planned repairs and renovations with start dates in FY 2022 or FY 2023. They expect to spend more than $1.8 billion improving research space in biological and biomedical sciences and $1.3 billion for improvements in health sciences research space. Research space in physical sciences ($919 million) and engineering ($746 million) is also slated for major repairs and renovations. In addition, academic institutions reported $8.1 billion in deferred repair and renovation projects included in their institutional plans, as well as $3.0 billion not included in their institutional plans. These deferred projects were not funded and not scheduled to begin before FY 2024.
Costs for repair and renovation of science and engineering research space in academic institutions, by field and time of repair and renovation: FYs 2020–23
S&E = science and engineering.
Note(s):
Fields of science and engineering and their disciplines were revised in FY 2015. Specifically, "Agricultural sciences and natural resources sciences" was split into "Agricultural sciences" and "Natural resources and conservation." Prior to FY 2015, data for "Natural resources and conservation" are included in "Agricultural sciences." Deferred projects are those that (1) are not funded and (2) are not scheduled for FY 2022 or FY 2023. Details may not add to totals due to rounding.
Source(s):
National Center for Science and Engineering Statistics, Survey of Science and Engineering Research Facilities.
Condition of Research Space
Academic institutions assessed the condition of their research space in FY 2021 by S&E field based on four condition categories: superior condition, satisfactory condition, requires renovation, and requires replacement. Three fields were assessed to have at least 40% of the space in superior condition: computer and information sciences (42%), health sciences (42%), and biological and biomedical sciences (41%) (figure 2). The “other fields of S&E,” which includes multidisciplinary research or space that is otherwise unclassifiable in the eleven major fields, was also assessed with 43% in superior condition. All but three fields were classified with at least 79% of the space in either superior or satisfactory condition, with research space in computer and information sciences receiving the highest combined rating (88%). Natural resources and conservation (28%) and agricultural sciences (27%) were the only two fields assessed with at least 25% of the space requiring renovation or replacement.
Condition of science and engineering research space in academic institutions, by field: FY 2021
| Field | Superior | Satisfactory | Requires renovation | Requires replacement |
|---|---|---|---|---|
| Other fields of S&E | 43 | 39 | 12 | 6 |
| Health sciences | 42 | 41 | 13 | 4 |
| Computer and information sciences | 42 | 46 | 10 | 2 |
| Biological and biomedical sciences | 41 | 41 | 15 | 3 |
| Engineering | 38 | 44 | 15 | 3 |
| Physical sciences | 35 | 44 | 17 | 4 |
| Geosciences, atmospheric sciences, and ocean sciences | 30 | 49 | 18 | 3 |
| Psychology | 29 | 50 | 16 | 5 |
| Social sciences | 28 | 52 | 17 | 3 |
| Agricultural sciences | 28 | 45 | 22 | 5 |
| Natural resources and conservation | 25 | 47 | 20 | 8 |
| Mathematics and statistics | 25 | 51 | 19 | 5 |
Note(s):
Details may not add to totals due to rounding. Condition was assessed relative to the usage of the current research program.
Source(s):
National Center for Science and Engineering Statistics, Survey of Science and Engineering Research Facilities, FY 2021.
Research Space at the Largest Institutions
Of the 584 institutions surveyed, the top 30 institutions ranked by total S&E research NASF accounted for 35% of all research space in FY 2021 (table 4). This is the same share for the top 30 (although not necessarily the same 30 institutions) reported in FYs 2019, 2017, 2015, and 2013. In FY 2021, the top 30 institutions accounted for 54% of all research space in agricultural sciences. They also reported a large percentage of total academic research space in health sciences (38%), natural resources and conservation (37%), engineering (35%), and social sciences (35%). These institutions accounted for less than 30% of the nation’s research space in the six other major fields: mathematics and statistics (28%), biological and biomedical sciences (27%), physical sciences (27%), geosciences, atmospheric sciences, and ocean sciences (26%), psychology (23%), computer and information sciences (20%).
Thirty institutions reporting the most FY 2021 research space in all fields: FYs 2017 to 2021
Note(s):
The leading 30 institutions reflect the totals for FY 2021. Some institutions may not have been in the top 30 prior to FY 2021. Details may not add to totals due to rounding.
Source(s):
National Center for Science and Engineering Statistics, Survey of Science and Engineering Research Facilities.
Data Notes
Data Sources and Availability
The data presented in this InfoBrief were obtained from the Survey of Science and Engineering Research Facilities, conducted by NCSES within the National Science Foundation. The survey is a census of 584 colleges and universities that expended at least $1 million in S&E research and development funds in FY 2020. The response rate for this survey was 97%. For more details see the survey description at https://www.nsf.gov/statistics/srvyfacilities/.
The full set of data tables and technical notes are available in Science and Engineering Research Facilities: Fiscal Year 2021 at https://ncses.nsf.gov/pubs/nsf23309/. Data for the survey are also available in NCSES data tools (https://ncsesdata.nsf.gov/home/). Please contact the author for more information.
Definitions
Net assignable square feet (NASF) is the sum of all areas on all floors of a building assigned to, or available to be assigned to, an occupant for a specific use, such as research or instruction. NASF is measured from the inside faces of walls.
Research space is the NASF of space in buildings within which research activities take place. Research facilities are located within buildings. A building is a roofed structure for permanent or temporary shelter of persons, animals, plants, materials, or equipment. Structures should be included if they are (1) attached to a foundation, (2) roofed, (3) serviced by a utility, exclusive of lighting, and (4) a source of significant maintenance and repair activities.
Condition of research space is assessed through four categories:
- Superior condition: Suitable for the most scientifically competitive research in this field over the next 2 years (your FY 2020 and FY 2021)
- Satisfactory condition: Suitable for continued use over the next 2 years (your FY 2020 and FY 2021) for most levels of research in this field, but may require minor repairs or renovation
- Requires renovation: Will no longer be suitable for current research without undergoing major renovation within the next 2 years (your FY 2020 and FY 2021)
- Requires replacement: Should stop using space for current research within the next 2 years (your FY 2020 and FY 2021)
Notes
1For details on academic R&D expenditures see the Higher Education Research and Development (HERD) Survey data tables and InfoBriefs at https://www.nsf.gov/statistics/srvyherd/. The HERD survey collects data for S&E and non-S&E R&D fields.
2During the conduct of the FY 2021 Survey of Science and Engineering Research Facilities, many universities noted reassessments of their research space accounting capabilities due in part to the effects of the COVID-19 pandemic on research space and personnel practices. Consequently, some universities’ NASF totals or individual field totals were notably different from FY 2019. The largest such reassessment was reported by Northwestern University who informed NCSES that their past years’ research NASF totals were incorrectly calculated. Northwestern was unable to provide correct totals for prior years, consequently their reported total increased by 1.3 million NASF from FY 2019 to FY 2021. Due to the lack of historical data, NCSES has chosen not to revise the estimates from prior years. Users should take this into account when assessing estimated annual changes.
3For details on other field changes to the FY 2021 survey, see “Changes in the questionnaire” in the 2021 “Technical Notes” available at https://ncses.nsf.gov/pubs/nsf23309/.
4Data on costs for new construction of S&E research space are available in data tables 12 through 17 (https://ncses.nsf.gov/pubs/nsf23309/).
5Academic institutions reported planned new S&E research space construction in previous surveys for the following 2-year periods: 2010–11 (10.2 million NASF), 2012–13 (8.4 million NASF), 2014–15 (8.8 million NASF), 2016–17 (9.6 million NASF), 2018–19 (9.4 million NASF), 2020–21 (10.1 million NASF).
6Data on institutional rankings by field are available in data table 3 (https://ncses.nsf.gov/pubs/nsf23309/).
Suggested Citation
Gibbons, MT; National Center for Science and Engineering Statistics (NCSES). 2022. University Science and Engineering Research Space Increased More Than 30 Million Square Feet in the Past Decade. NSF 23-308. Alexandria, VA: National Science Foundation. Available at https://ncses.nsf.gov/pubs/nsf23308/.
Contact Us
NCSES
National Center for Science and Engineering Statistics
Directorate for Social, Behavioral and Economic Sciences
National Science Foundation
2415 Eisenhower Avenue, Suite W14200
Alexandria, VA 22314
Tel: (703) 292-8780
FIRS: (800) 877-8339
NSF 23-308
|December 15, 2022