 An official website of the United States government

2021 Graduate Enrollment in Science, Engineering, and Health Fields at All-Time High as Postdocs Continue to Decline
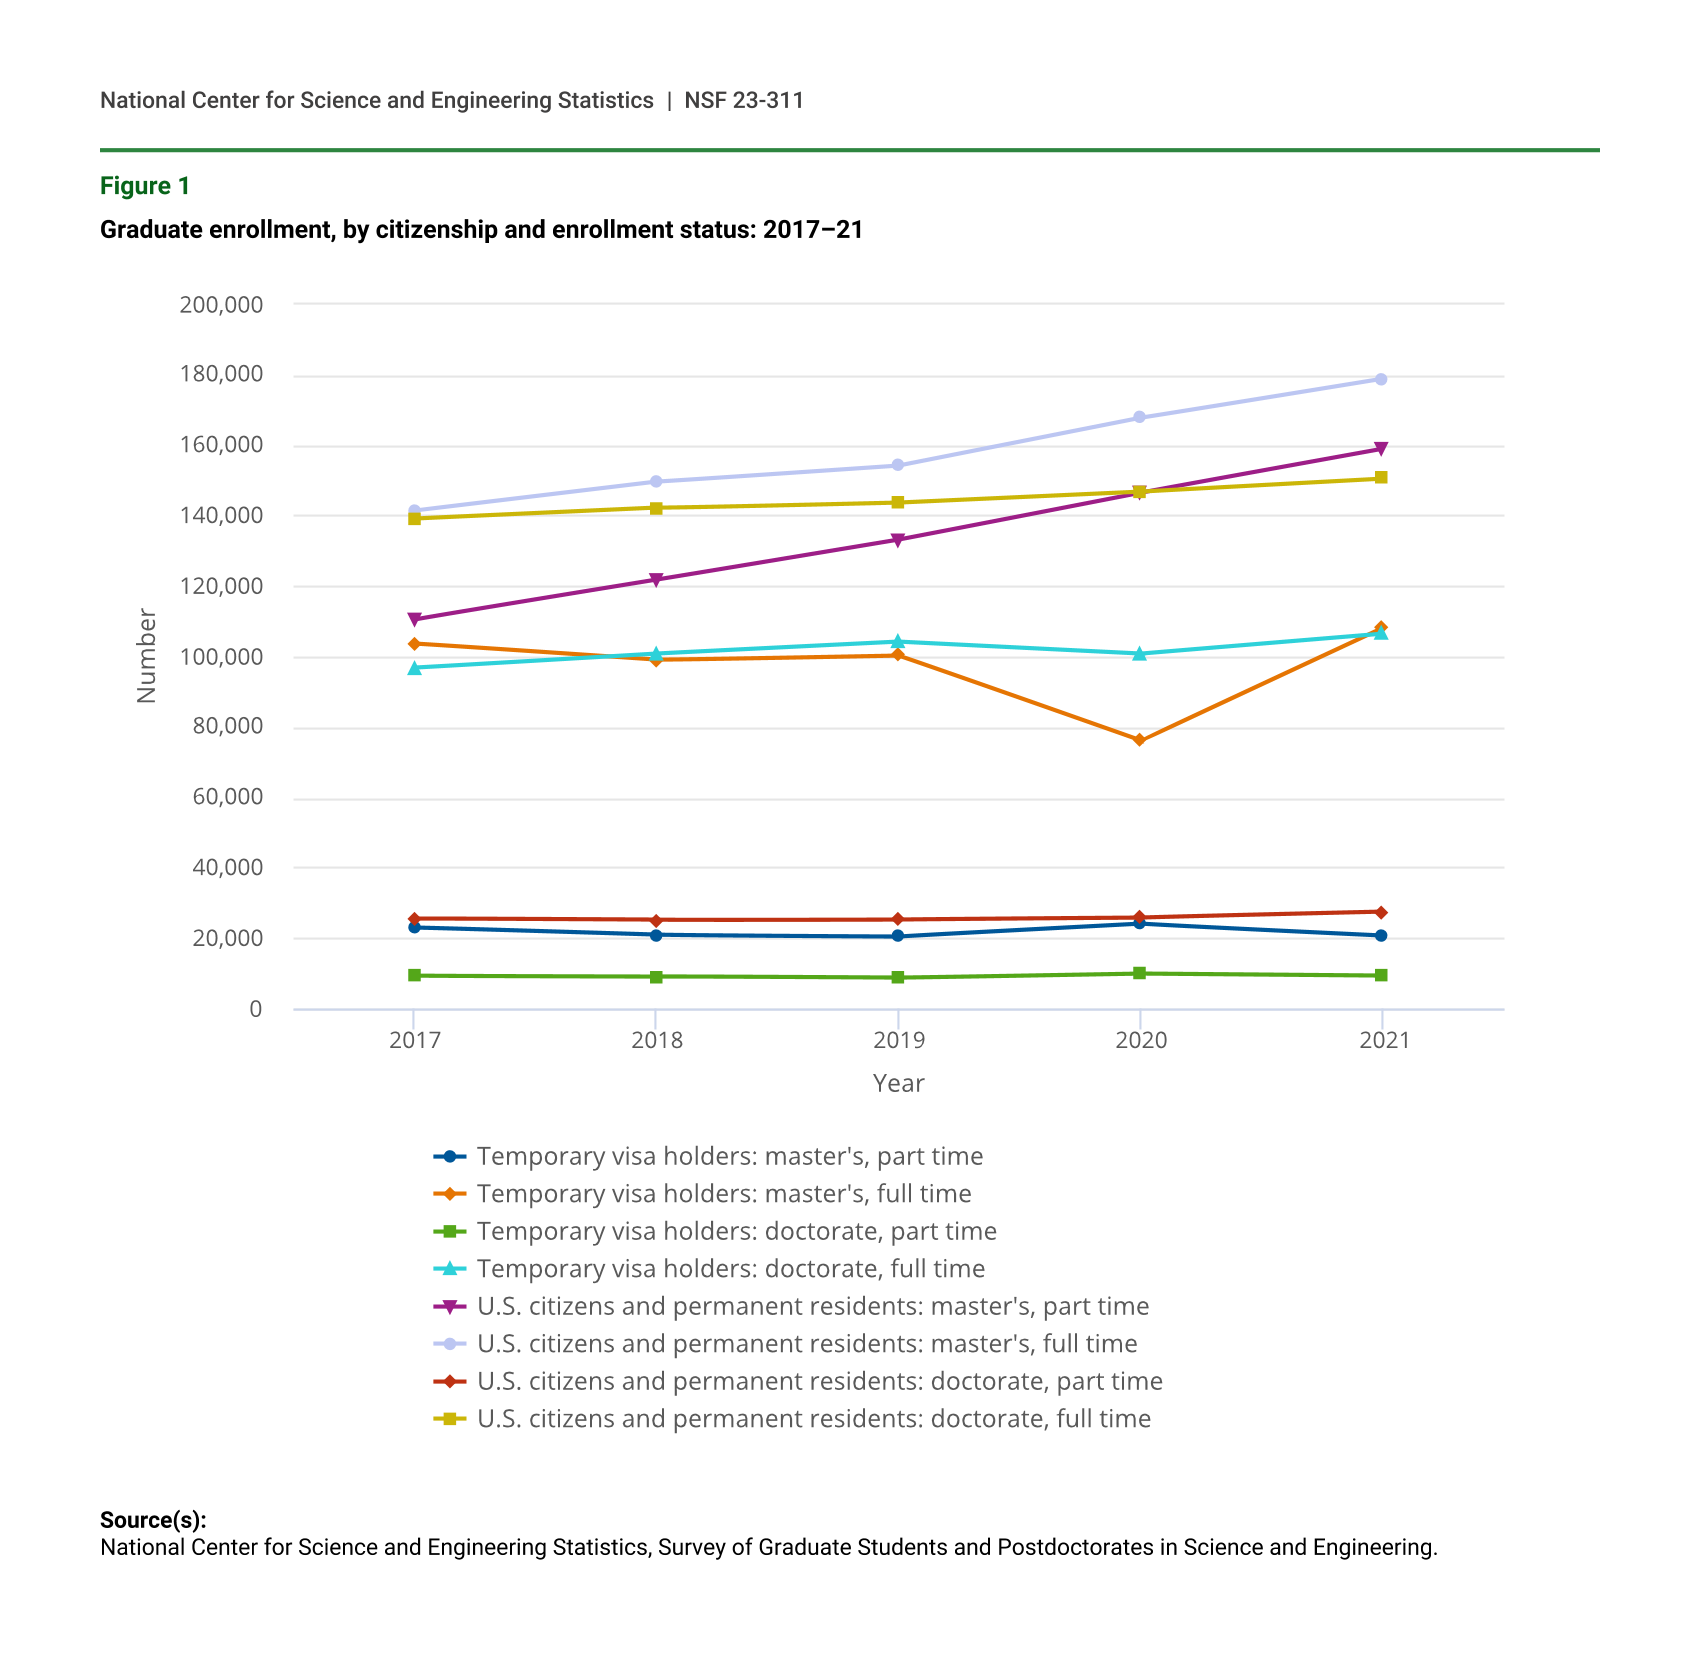
Enrollment patterns for students pursuing graduate degrees in science, engineering, and selected health (SEH) fields have been disrupted by the COVID-19 pandemic. The enrollment declines seen in 2020 among temporary visa holders and first-time, full-time master’s and doctoral students were reversed in 2021 by matriculation increases in doctoral and especially master’s students. Enrollment increases were driven by a 44.3% increase in first-time, full-time master’s students and by a 13.4% increase in first-time, full-time doctoral students between 2020 and 2021. Full-time master’s enrollment in 2021 was 287,022, while full-time doctoral enrollment was 256,980. These numbers represent the highest enrollments reported since separate data for master’s and doctoral students became available in 2017 (figure 1, table 1). Conversely, overall postdoctoral (postdoc) appointments declined by 3.6% since 2020 and by 2.2% since 2017. Postdoc declines were seen across all broad field groups between 2020 and 2021: -4.1% in science fields, -1.3% in engineering fields, and -3.8% in health fields. These data align with 5-year trends reported by the 2020 Survey of Earned Doctorates, which showed declines in the percentage of recent doctorate recipients committing to postdoc positions, and support several recent anecdotal accounts documented by journalists of postdoc recruiting challenges and position vacancies across science and engineering (S&E) disciplines.
Graduate enrollment, by citizenship and enrollment status: 2017–21
| Year | Temporary visa holders: master's, part time | Temporary visa holders: master's, full time | Temporary visa holders: doctorate, part time | Temporary visa holders: doctorate, full time | U.S. citizens and permanent residents: master's, part time | U.S. citizens and permanent residents: master's, full time | U.S. citizens and permanent residents: doctorate, part time | U.S. citizens and permanent residents: doctorate, full time |
|---|---|---|---|---|---|---|---|---|
| 2017 | 23,002 | 103,689 | 9,239 | 96,701 | 110,575 | 141,321 | 25,508 | 139,077 |
| 2018 | 20,902 | 99,019 | 9,066 | 100,739 | 121,757 | 149,533 | 25,133 | 142,158 |
| 2019 | 20,516 | 100,342 | 8,652 | 104,103 | 133,180 | 154,190 | 25,327 | 143,807 |
| 2020 | 24,080 | 76,093 | 9,861 | 100,728 | 146,539 | 167,766 | 25,818 | 146,928 |
| 2021 | 20,840 | 108,090 | 9,285 | 106,376 | 158,959 | 178,932 | 27,417 | 150,604 |
Source(s):
National Center for Science and Engineering Statistics, Survey of Graduate Students and Postdoctorates in Science and Engineering.
Graduate enrollment in science, engineering, and health, by degree level, enrollment status, citizenship, sex, ethnicity, and race: 2017–21
a Race and ethnicity data are available for U.S. citizens and permanent residents only.
Source(s):
National Center for Science and Engineering Statistics, Survey of Graduate Students and Postdoctorates in Science and Engineering.
These and other findings in this report are from the 2021 Survey of Graduate Students and Postdoctorates in Science and Engineering (GSS), with comparisons to data from 2017 to 2021. Data from the GSS provide insight into the composition of the current and future S&E workforce by collecting data on graduate students in SEH fields, postdocs, and doctorate-holding nonfaculty researchers (NFRs). The GSS is sponsored by the National Center for Science and Engineering Statistics (NCSES) within the National Science Foundation and by the National Institutes of Health (NIH).
Trends in Enrollment, by Citizenship
The declines in master’s full-time enrollment between 2019 and 2020 reversed in 2021, with enrollment growing from 243,859 in 2020 to 287,022 in 2021, a 17.7% increase. Full-time doctoral enrollment, which was stable between 2019 and 2020, increased by 3.8%, from 247,656 in 2020 to 256,980 in 2021. Part-time enrollment increased by 5.4% over the same period (to 179,799) for master’s students and by 2.9% (to 36,702) for doctoral students. The 5-year trend for part-time master’s students shows an increase of more than a third—with enrollments up 34.6% from 2017 to 2021—while doctoral part-time enrollment increased 5.6% over the same period (table 1, figure 1).
Temporary Visa Holders
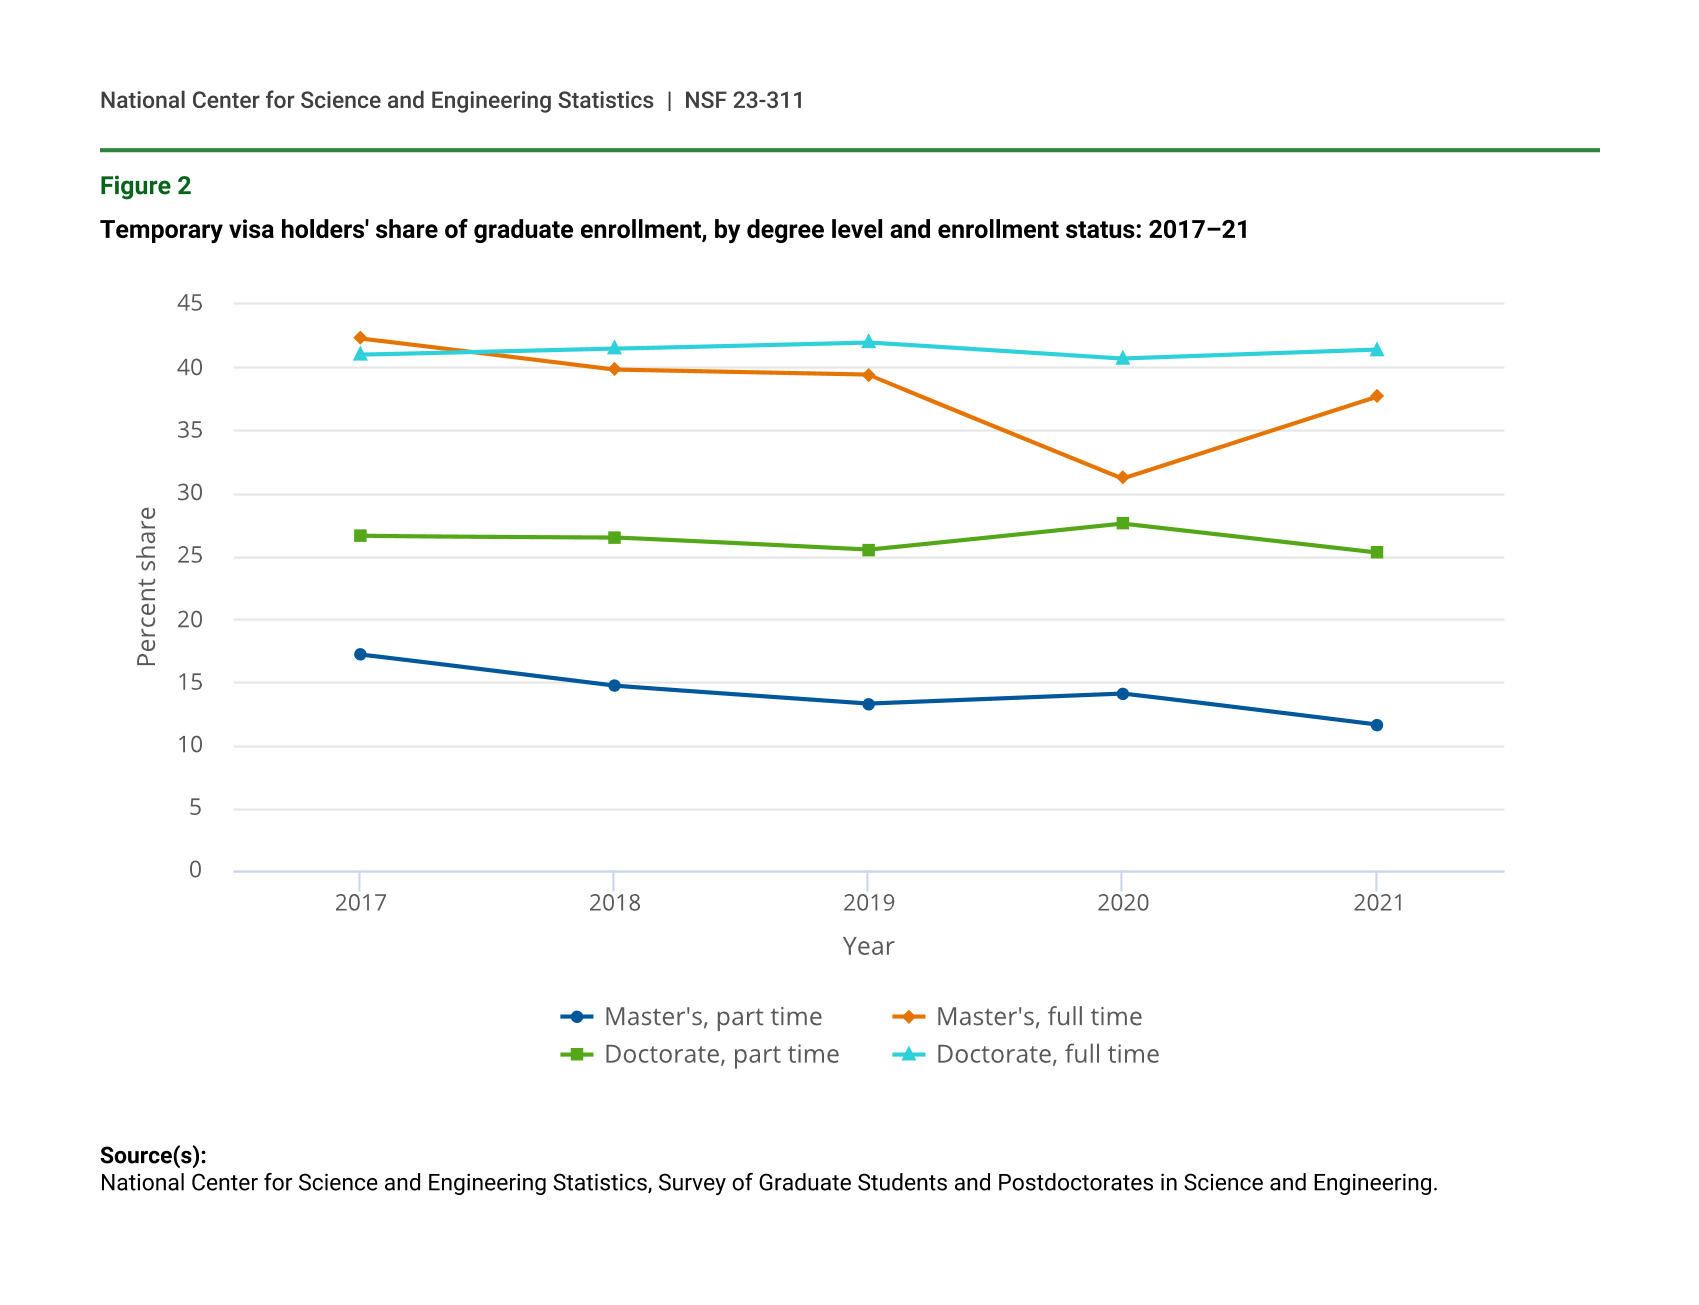
The enrollment of temporary visa holders in SEH master’s and doctoral programs declined between 2019 and 2020. However, enrollments of students on a temporary visa recovered in 2021, led by a 42.0% increase in full-time master’s students (to 108,090 students), and a 5.6% increase in full-time doctoral students (to 106,373 students). First-time, full-time enrollments of temporary visa holders increased considerably between 2020 and 2021, with a 189.6% increase for first-time, full-time master’s students (from 22,381 to 64,805 students), and a 42.7% increase (from 13,429 to 19,163) for first-time, full-time doctoral students.
Despite this larger-than-average recent growth, over the past 5 years temporary visa holders as a percentage of all master’s and doctoral students have declined for full- and part-time master’s students and for part-time doctoral students. The percentage of full-time doctoral students with temporary visas was stable (41.0% in 2017 and 41.4% in 2021) (table 1, figure 2).
Temporary visa holders' share of graduate enrollment, by degree level and enrollment status: 2017–21
| Year | Master's, part time | Master's, full time | Doctorate, part time | Doctorate, full time |
|---|---|---|---|---|
| 2017 | 17.2 | 42.3 | 26.6 | 41.0 |
| 2018 | 14.7 | 39.8 | 26.5 | 41.5 |
| 2019 | 13.3 | 39.4 | 25.5 | 42.0 |
| 2020 | 14.1 | 31.2 | 27.6 | 40.7 |
| 2021 | 11.6 | 37.7 | 25.3 | 41.4 |
Source(s):
National Center for Science and Engineering Statistics, Survey of Graduate Students and Postdoctorates in Science and Engineering.
U.S. Citizens and Permanent Residents
Enrollment of U.S. citizens and permanent residents increased from 2020 to 2021 for both degree levels (master’s and doctoral) and enrollment status (part time and full time). Among U.S. citizen and permanent residents with first-time, full-time enrollment between 2020 and 2021, the number of master’s students increased 3.5% (from 79,715 to 82,497) but the number of doctoral students declined slightly (from 27,744 to 27,533, or -0.8%) (table 1).
Year-over-year enrollment patterns by sex, race, and ethnicity were variable. Enrollment of female full-time master’s and doctoral students increased by 8.1% (8,163 students) and 4.8% (3,511 students), respectively. Meanwhile, male full-time master’s and doctoral student enrollment increased by a more modest 4.5% (3,003 students) and 0.2% (165 students), respectively (table 1).
Enrollment among Hispanic or Latino and Black or African American graduate students showed continued annual growth. Hispanic or Latino full-time master’s enrollment increased by 10.1% (2,465 students) from 2020 to 2021, while doctoral enrollment increased by 8.9% (1,450 students). Over the same period, Black or African American full-time enrollment increased by 5.9% for master's students (944 students) and by 8.7% for doctoral students (747 students). Asian full-time master’s and doctoral enrollments increased by 17.1% (3,163 students) and by 8.9% (1,426 students), respectively. Meanwhile, White enrollment increased by 4.4% (4,151 students) for full-time master’s students but declined by 0.2% (-201 students) for full-time doctoral students (table 1).
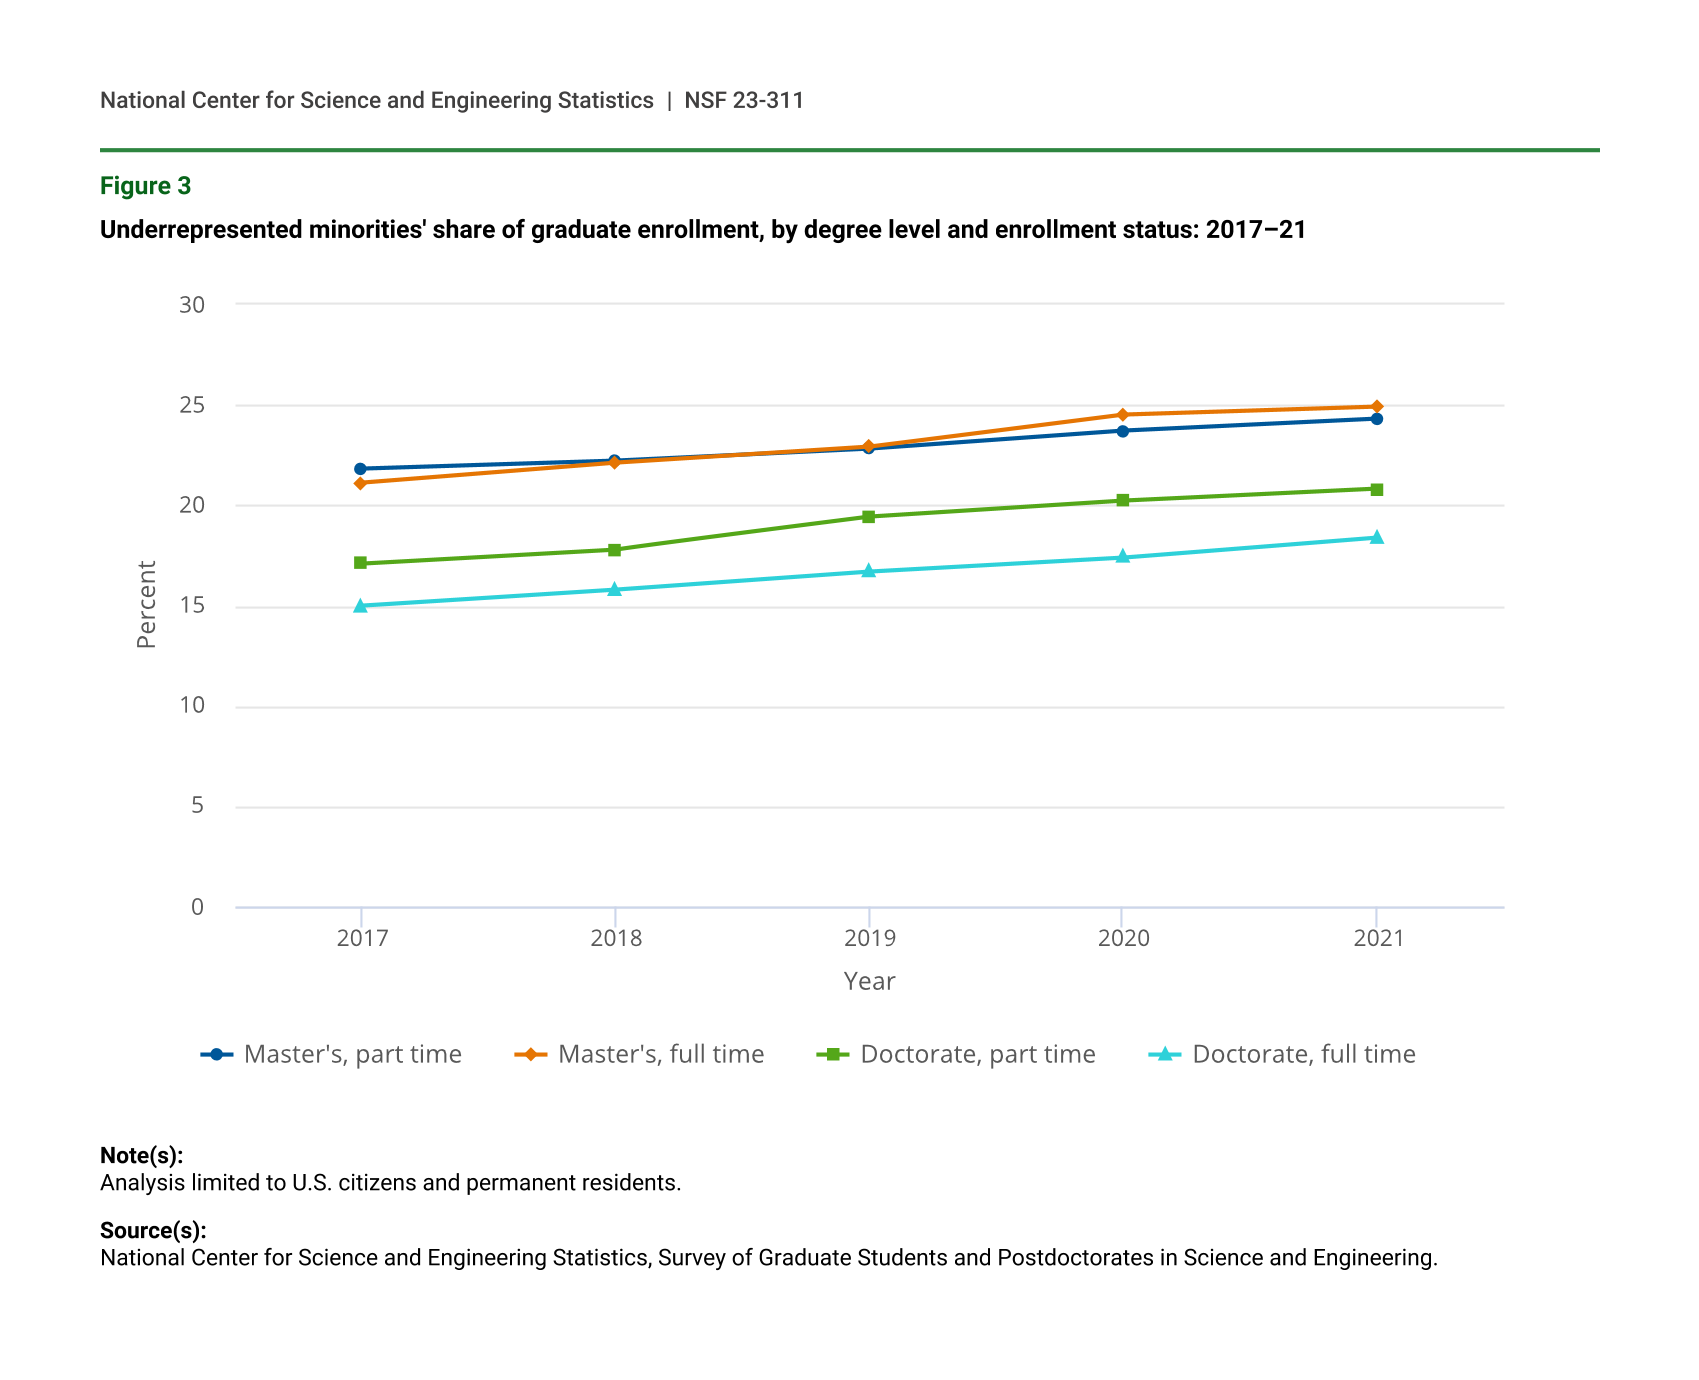
Viewed over a 5-year period, students who are underrepresented minorities (URM)—Hispanic or Latino, Black or African American, and American Indian or Alaska Native—have increased their overall representation among all U.S. citizen and permanent resident graduate students regardless of degree level or enrollment status. For example, URM constituted 15.0% of all full-time doctoral students in 2017 and 18.4% in 2021. For full-time master’s students, URM represented 21.1% of the total enrollment in 2017 and 24.9% in 2021 (table 1, figure 3).
Underrepresented minorities' share of graduate enrollment, by degree level and enrollment status: 2017–21
| Year | Master's, part time | Master's, full time | Doctorate, part time | Doctorate, full time |
|---|---|---|---|---|
| 2017 | 21.8 | 21.1 | 17.1 | 15.0 |
| 2018 | 22.2 | 22.1 | 17.8 | 15.8 |
| 2019 | 22.8 | 22.9 | 19.4 | 16.7 |
| 2020 | 23.7 | 24.5 | 20.2 | 17.4 |
| 2021 | 24.3 | 24.9 | 20.8 | 18.4 |
Note(s):
Analysis limited to U.S. citizens and permanent residents.
Source(s):
National Center for Science and Engineering Statistics, Survey of Graduate Students and Postdoctorates in Science and Engineering.
Field of Study Trends for Master’s and Doctoral Students
Master’s and doctoral enrollment in SEH fields increased to an all-time high of 760,503 students in 2021. Enrollment grew between 2020 and 2021 across nearly all broad fields at both degree levels—master’s enrollment increased in every broad field, while doctoral enrollment increased in all but two fields (mathematics and statistics; electrical, electronics, communications and computer engineering) (table 2).
In 2020, the GSS revised its field taxonomy to align with an updated NCSES Taxonomy of Disciplines (TOD) and National Center for Education Statistics’ (NCES) Classification of Instructional Programs (CIP). The revisions resulted in some disciplines moving between broad fields; in these cases, the changes in broad field counts in 2020 reflect the updated taxonomy rather than change in enrollment or employment. See “Data Sources and Limitations” for more information.
Graduate enrollment in science, engineering, and health, by degree level and field: 2017–21
Note(s):
In 2020, the GSS revised its field taxonomy, and the revisions resulted in some disciplines moving between broad fields; see “Data Sources and Limitations” for details. For more information about fields collected in this survey, please see table A-17 in Survey of Graduate Students and Postdoctorates in Science and Engineering: Fall 2021.
Source(s):
National Center for Science and Engineering Statistics, Survey of Graduate Students and Postdoctorates in Science and Engineering.
Master’s Enrollment Trends, by Field
Master’s enrollment in SEH fields soared to a record high of 466,821 students, an increase of 12.6% over 2020 and of 23.3% over 2017. Over the past academic year, master’s enrollment grew in SEH fields by 14.2% (38,045 students), 10.0% (8,660 students), and 9.4% (5,638 students), respectively. Master’s enrollment in engineering fields increased in 2021 for the first time in 4 years. Between 2017 and 2021, master’s enrollment in science and health both grew (by 33.5% and 24.9%, respectively), while engineering enrollment contracted by 1.7% (table 2).
Computer and information sciences had the largest numeric and percentage increase in master’s enrollment between 2020 and 2021 at 26.7% (21,542 students). This field accounted for 41.2% of the 1-year growth in master’s enrollment and remains the largest field for master’s enrollment, with 102,232 students enrolled in 2021, or over a fifth of the master’s students reported to the GSS. In terms of percentage growth, the next three largest-growing fields were aerospace, aeronautical, and astronautical engineering (17.1%, or 739 students); clinical medicine (14.5%, or 4,320 students); and biological, biomedical, and biosystems engineering (14.5%, or 658 students) (table 2).
Master’s enrollment increased across all GSS broad fields from 2020 to 2021. Over a 5-year time span, six fields had declining enrollment—with all but one of these within the broad field of engineering. Chemical, petroleum, and chemical-related engineering had the smallest 1-year growth (1.4%, or 41 students) and the largest 5-year percentage decline (-29.1%, or -1,225 students). Master’s enrollment in electrical, electronics, communications and computer engineering experienced the largest numeric decline from 2017 to 2021 (-2,129 students, or 7.1%) (table 2).
Doctoral Enrollment Trends, by Field
Similar to master’s enrollment, doctoral enrollment rose to a record high in 2021 (293,682 students), growing 3.7% (10,347 students) compared to the larger percentage increase in master’s enrollment 12.6% (52,343 students). Among SEH fields from 2020 to 2021, health grew the most in percentage terms (8.8%, or 1,346 students), followed by science (3.7%, or 7,335 students) and engineering (2.3%, or 1,666 students). The trends between 2017 and 2021 were slightly different: science fields experienced the greatest percentage increase (9.5%, or 17,678 students), followed by health (8.9%, or 1,359 students) and engineering (6.0%, or 4,120 students) (table 2).
Measured in percentage terms, the top three growing S&E detailed fields between 2020 and 2021 were biological, biomedical, and biosystems engineering (7.8%, or 640 students); computer and information sciences (7.7%, or 1,400 students); and multidisciplinary and interdisciplinary studies (6.2%, or 222 students). Biological and biomedical sciences had the largest numeric increase from 2020 to 2021 (3,308 students) and remains the largest academic field (58,213 students) (table 2).
Trends in Postdocs and Nonfaculty Researchers
Annual trends in postdocs and doctorate-holding NFRs diverged in 2021. Postdoc appointments declined overall and within each broad field group—science, engineering, and health—while NFRs increased in these same areas. Among all surveyed fields, postdocs declined by 3.6% (-2,385) from 2020 to 2021 and by 2.2% (-1,437) since 2017. Conversely, NFRs increased by 3.6% (1,064) between 2020 and 2021 and by 9.0% (2,545) between 2017 and 2021 (table 3).
Postdoctoral appointees and nonfaculty researchers, by field: 2017–21
Note(s):
In 2020, the GSS revised its field taxonomy, and the revisions resulted in some disciplines moving between broad fields; see “Data Sources and Limitations” for details. For more information about fields collected in this survey, please see table A-17 in Survey of Graduate Students and Postdoctorates in Science and Engineering: Fall 2021.
Source(s):
National Center for Science and Engineering Statistics, Survey of Graduate Students and Postdoctorates in Science and Engineering.
Demographics of Postdocs
The declines in postdoc appointments are unevenly distributed among U.S. citizens and permanent residents and temporary visa holders. Postdocs holding temporary visas declined by 7.0% (-2,493) between 2020 and 2021 and by 3.8% (-1,325) since 2017. Postdocs among U.S. citizens and permanent residents increased by 0.4% (108) between 2020 and 2021, while declining by 0.4% (-112) since 2017. Among U.S. citizens and permanent residents, Hispanic or Latino postdocs increased by 5.7% (115) from 2020 to 2021 and by 29.1% (483) since 2017. Black or African American postdocs in 2021 increased by 6.6% (71) over the previous year and by 13.1% (133) since 2017 (table 4).
Postdoctoral appointees, by citizenship, sex, ethnicity, and race: 2017–21
a Race and ethnicity data are available for U.S. citizens and permanent residents only.
Source(s):
National Center for Science and Engineering Statistics, Survey of Graduate Students and Postdoctorates in Science and Engineering.
Field of Research
From 2020 to 2021, trends in postdocs and NFRs continued to diverge with respect to field of research. Postdoc appointments declined in SEH, while NFR employment increased.
From 2020 to 2021, postdocs declined by 4.1% (-1,570) in science, by 3.8% (-708) in health, and by 1.3% (-107) in engineering. However, several individual broad fields had notable 1-year percentage gains. The top three growing fields for postdoc appointments by percentage were aerospace, aeronautical, and astronautical engineering (19.7%, or 46), natural resources and conservation (7.5%, or 63), and computer and information sciences (6.7%, or 55). Biological and biomedical sciences remained the largest field for postdoc appointments with 20,182 postdocs, but it reported the largest numeric loses across all fields from both 2017 (-1,599 postdocs) and 2020 (-1,720 postdocs). From 2017 to 2021, only engineering had an increase (6.6%, or 516 postdocs), led by a 20.4% (164 postdocs) increase in civil, environmental, transportation and related engineering fields (table 3).
In 2021, NFR employment increased from both 2017 (9.0%, or 2,545 NFRs) and 2020 (3.6%, or 1,064 NFRs). From 2020 to 2021, mathematics and statistics had the largest 1-year percentage increase (20.9%, or 42 NFRs), while clinical medicine had the largest numeric increase (4.0%, or 258 NFRs). Similar to postdoc employment, biological and biomedical sciences remained the largest field for NFR employment, with 8,208 NFRs reported. From 2017 to 2021, notable 5-year gains were seen in agricultural and veterinary sciences (up 82.7%, or 410 NFRs), natural resources and conservation (up 71.7%, or 261 NFRs), and psychology (up 62.6%, or 309 NFRs) (table 3).
Data Sources and Limitations
Conducted since 1966, the GSS is an annual survey of all academic institutions in the United States that grant research-based master’s or doctoral degrees in SEH fields. The 2021 GSS collected data from 21,365 organizational units (departments, programs, affiliated research centers, and health care facilities) at 699 eligible institutions and their affiliates in the United States, Puerto Rico, and Guam. The unit response rate was 98.2%. An overview of the survey is available at https://www.nsf.gov/statistics/srvygradpostdoc/.
In 2020, the GSS amended its taxonomy to align with a revised NCSES TOD and 2020 NCES CIP. The 2017 to 2019 GSS counts were not reclassified using the 2020 CIP. Unlike the taxonomy changes in 2017, the only newly ineligible CIP codes were those dropped by the 2020 CIP. As such, these changes did not lead to a large shift in overall reported GSS counts, and data remain comparable to data from 2017 to 2019. Additionally, new CIP codes, such as data science and medical clinical sciences, were added, along with other codes in GSS-eligible series; while these CIP codes are newly eligible, a review of unit names from prior years indicates that many of them were being reported prior to 2020. Some additional adjustments to allow for further detail in some fields were made to the GSS taxonomy based on the 2020 CIP codes reported to GSS. Finally, similar to the science and health groups, broad fields were added to the engineering group.
At the field level, there were some notable changes that may impact trends. First, consistent with the 2020 CIP and TOD, veterinary biomedical and clinical sciences moved from the health sciences to agricultural sciences (which was then renamed agricultural and veterinary sciences). Human development is now reported under psychology, rather than social sciences, to align with the 2020 TOD. Finally, 22 new 2020 CIP codes were added to multidisciplinary and interdisciplinary studies; the addition of these CIP codes likely moved units that were already reported (i.e., many units named data science are now reported with new CIP codes that map to the new data science and data analytics GSS code). For more information about the 2020 GSS taxonomy change, see tables A-17, A-18a, and A-18b in the 2020 data tables (https://ncses.nsf.gov/pubs/nsf22319).
In 2017, the GSS was redesigned to collect demographic and financial support data separately for master’s and doctoral students so as to prioritize electronic data interchange (EDI) as the primary means of data submission and to utilize the Department of Education’s CIP codes to report fields of study for graduate student enrollment data. More information regarding the 2017 GSS redesign is available in the “Technical Notes” for the 2019 data tables (https://ncses.nsf.gov/pubs/nsf21318#technical-notes). Due to these changes, the data for 2017 and beyond are not directly comparable to previously collected GSS data. Trend comparisons can be made using the “2017old” estimates in the 2017 data tables, which are available at https://ncsesdata.nsf.gov/gradpostdoc/2017/.
GSS health fields are collected under the advisement of NIH. These GSS fields are about a third of all health fields in the Department of Education’s CIP taxonomy. NIH information on trends seen within these selected health fields can be found at https://report.nih.gov/nihdatabook/.
The full set of data tables from the 2021 survey is available at https://www.nsf.gov/statistics/srvygradpostdoc/. Data are also available in NCSES’s interactive data tool (https://ncsesdata.nsf.gov/ids/gss). For more information about the survey, contact the GSS Survey Manager, Michael Yamaner.
A related InfoBrief based on the 2020 COVID Impact Module that was conducted as part of the 2020 GSS is available at https://ncses.nsf.gov/pubs/nsf22313.
Notes
1Between 2015 and 2020, the percentage of SED respondents stating that their immediate postgraduate plan was a postdoc position declined in five out of six S&E broad fields. See 2020 SED Digest, figure 23 (https://ncses.nsf.gov/pubs/nsf22300/report/postgraduation-trends, accessed 26 August 2022) and table 44 (https://ncses.nsf.gov/pubs/nsf22300/data-tables, accessed 26 August 2022). See also Langin K. 2022. U.S. Labs Face Severe Postdoc Shortage. Science 376(6600):1369–70. https://www.science.org/content/article/professors-struggle-recruit-postdocs-calls-structural-change-academia-intensify. Accessed 24 August 2022.
2EDI is a method for transferring data between computer systems or networks using a standardized format. CIP is a taxonomy used for reporting postsecondary fields to the Department of Education for the Integrated Postsecondary Education Data System, a mandatory survey for institutions receiving federal financial aid. Most institutions in the GSS already use CIP codes to report data on graduate students. The CIP taxonomy was developed by NCES, which updates the taxonomy about once a decade; CIP was last revised in 2020. For more information, see https://nces.ed.gov/ipeds/cipcode/.
Suggested Citation
Gordon J, Davies C, Yamaner MI; National Center for Science and Engineering Statistics (NCSES). 2023. 2021 Graduate Enrollment in Science, Engineering, and Health Fields at All-Time High as Postdocs Continue to Decline. NSF 23-311. Alexandria, VA: National Science Foundation. Available at https://ncses.nsf.gov/pubs/nsf23311.
Contact Us
NCSES
National Center for Science and Engineering Statistics
Directorate for Social, Behavioral and Economic Sciences
National Science Foundation
2415 Eisenhower Avenue, Suite W14200
Alexandria, VA 22314
Tel: (703) 292-8780
FIRS: (800) 877-8339
TDD: (800) 281-8749
E-mail: ncsesweb@nsf.gov
NSF 23-311
|January 17, 2023