 An official website of the United States government

U.S. Nonprofits Spent $28 Billion on R&D Activities in FY 2020
U.S. nonprofits spent an estimated $28.0 billion on research and experimental development (R&D) performed within their organizations in FY 2020 (table 1). This amount is equivalent to 4% of the estimated total spent on R&D in the United States in 2020 and represents a 24% increase over the total reported for FY 2016.
Total expenditures for R&D performed by nonprofit organizations, by source of funds: FY 2020
Note(s):
These data exclude nonprofit universities and colleges and federally funded research and development centers administered by nonprofit organizations. Detail may not add to total because of rounding.
Source(s):
National Center for Science and Engineering Statistics and Census Bureau, Nonprofit Research Activities FY 2020 module of the 2021 Annual Business Survey.
Data in this InfoBrief are from the Nonprofit Research Activities (NPRA) FY 2020 module of the 2021 Annual Business Survey, conducted by the Census Bureau for the National Center for Science and Engineering Statistics (NCSES) within the National Science Foundation. It is the first collection of nonprofit R&D data by the Annual Business Survey and the beginning of an annual survey-based data series for this population. The questions in the FY 2020 module were first developed and used in the FY 2016 Nonprofit Research Activities Survey, which was the first national survey of R&D activities in the U.S. nonprofit population since 1997.
Sources of Funding for Nonprofit R&D Performance
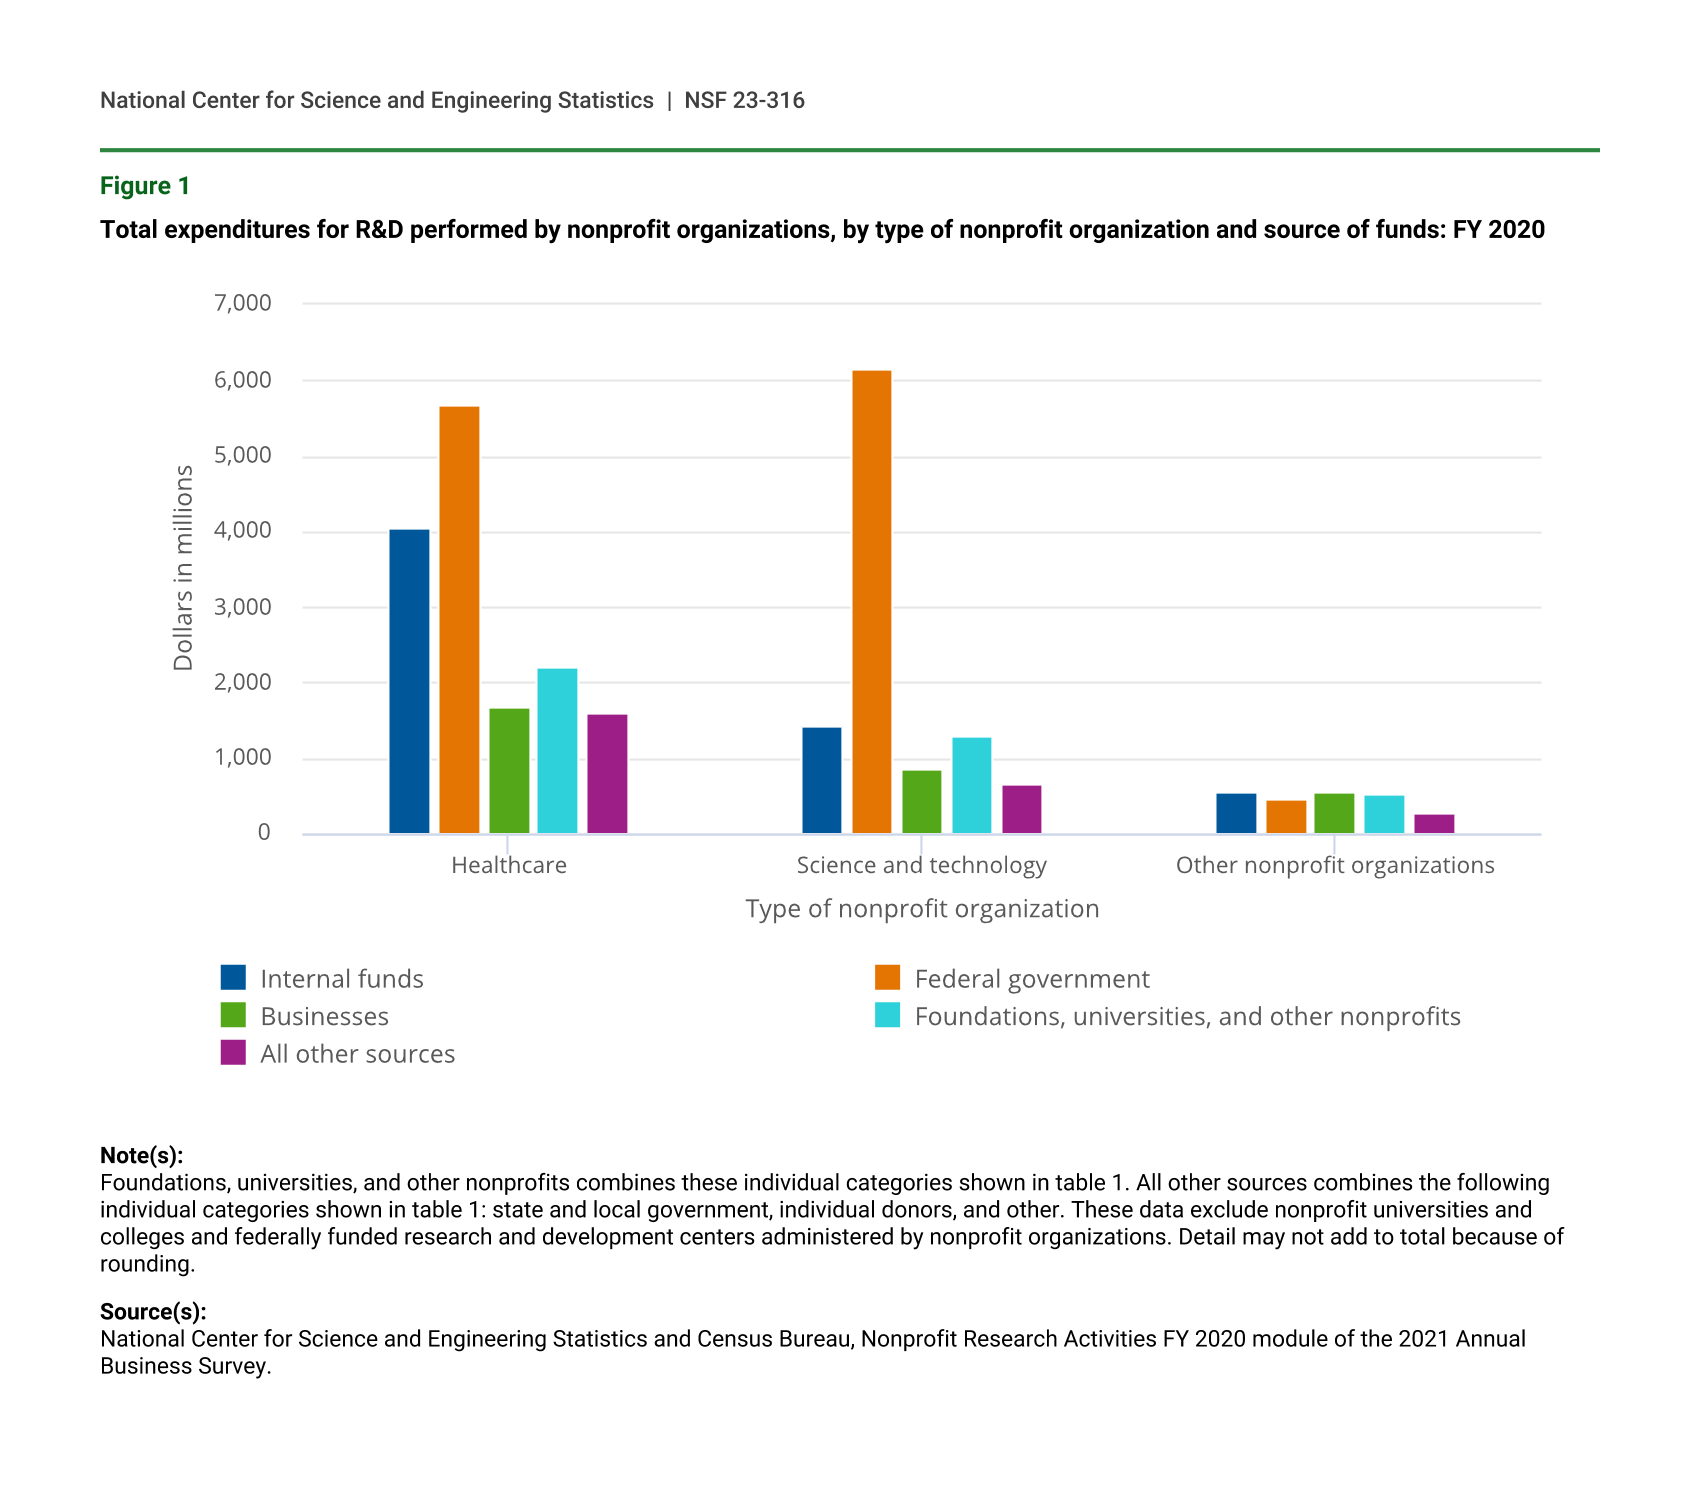
The largest funding source for nonprofit R&D performance was the federal government, contributing $12.3 billion, or 44%, of the total. Nonprofit organizations’ own internal funds were the next largest source at $6.0 billion, or 22%, of the total. For-profit businesses funded $3.1 billion (11%), and nonprofit foundations contributed an additional $2.3 billion (8%). The remaining sources each contributed less than 5% to total nonprofit R&D performance.
There was variation in the distribution of funding sources across the different types of nonprofits (figure 1). Science and technology organizations reported a much smaller proportion of internally funded R&D than healthcare organizations and other nonprofits. Science and technology organizations reported 14% ($1.4 billion) of their R&D performance was funded with their own dollars, whereas healthcare organizations reported 27% ($4.0 billion) and other nonprofits reported nearly a quarter ($554 million) of their respective R&D performance was funded internally. On the other hand, science and technology organizations reported a much larger proportion of R&D funded by the federal government ($6.1 billion or 59%) than healthcare organizations ($5.7 billion or 37%) or all other nonprofits ($461 million or 19%).
Historic estimates of nonprofit organization R&D from 1953–2020 and details about their creation are available in the National Patterns of R&D Resources: 2019–20 Data Update, available at https://ncses.nsf.gov/pubs/nsf22320.
Total expenditures for R&D performed by nonprofit organizations, by type of nonprofit organization and source of funds: FY 2020
| Type of nonprofit organization | Internal funds | Federal government | Businesses | Foundations, universities, and other nonprofits | All other sources |
|---|---|---|---|---|---|
| Healthcare | 4,043 | 5,673 | 1,676 | 2,198 | 1,607 |
| Science and technology | 1,434 | 6,143 | 863 | 1,295 | 664 |
| Other nonprofit organizations | 554 | 461 | 564 | 528 | 268 |
Note(s):
Foundations, universities, and other nonprofits combines these individual categories shown in table 1. All other sources combines the following individual categories shown in table 1: state and local government, individual donors, and other. These data exclude nonprofit universities and colleges and federally funded research and development centers administered by nonprofit organizations. Detail may not add to total because of rounding.
Source(s):
National Center for Science and Engineering Statistics and Census Bureau, Nonprofit Research Activities FY 2020 module of the 2021 Annual Business Survey.
Nonprofit R&D Performance by Type
Nonprofits reported that just under half (45%) of their FY 2020 R&D performance was categorized as basic research ($12.7 billion) and 39% ($10.8 billion) was applied research (table 2). The remaining 16% ($4.5 billion) was categorized as experimental development. These distributions remained stable regardless of whether the funding source was federal or nonfederal.
Total expenditures for R&D performed by nonprofit organizations, by type of R&D and source of funds: FY 2020
Note(s):
These data exclude nonprofit universities and colleges and federally funded research and development centers administered by nonprofit organizations. Detail may not add to total because of rounding.
Source(s):
National Center for Science and Engineering Statistics and Census Bureau, Nonprofit Research Activities FY 2020 module of the 2021 Annual Business Survey.
Nonprofit R&D Performance by Field
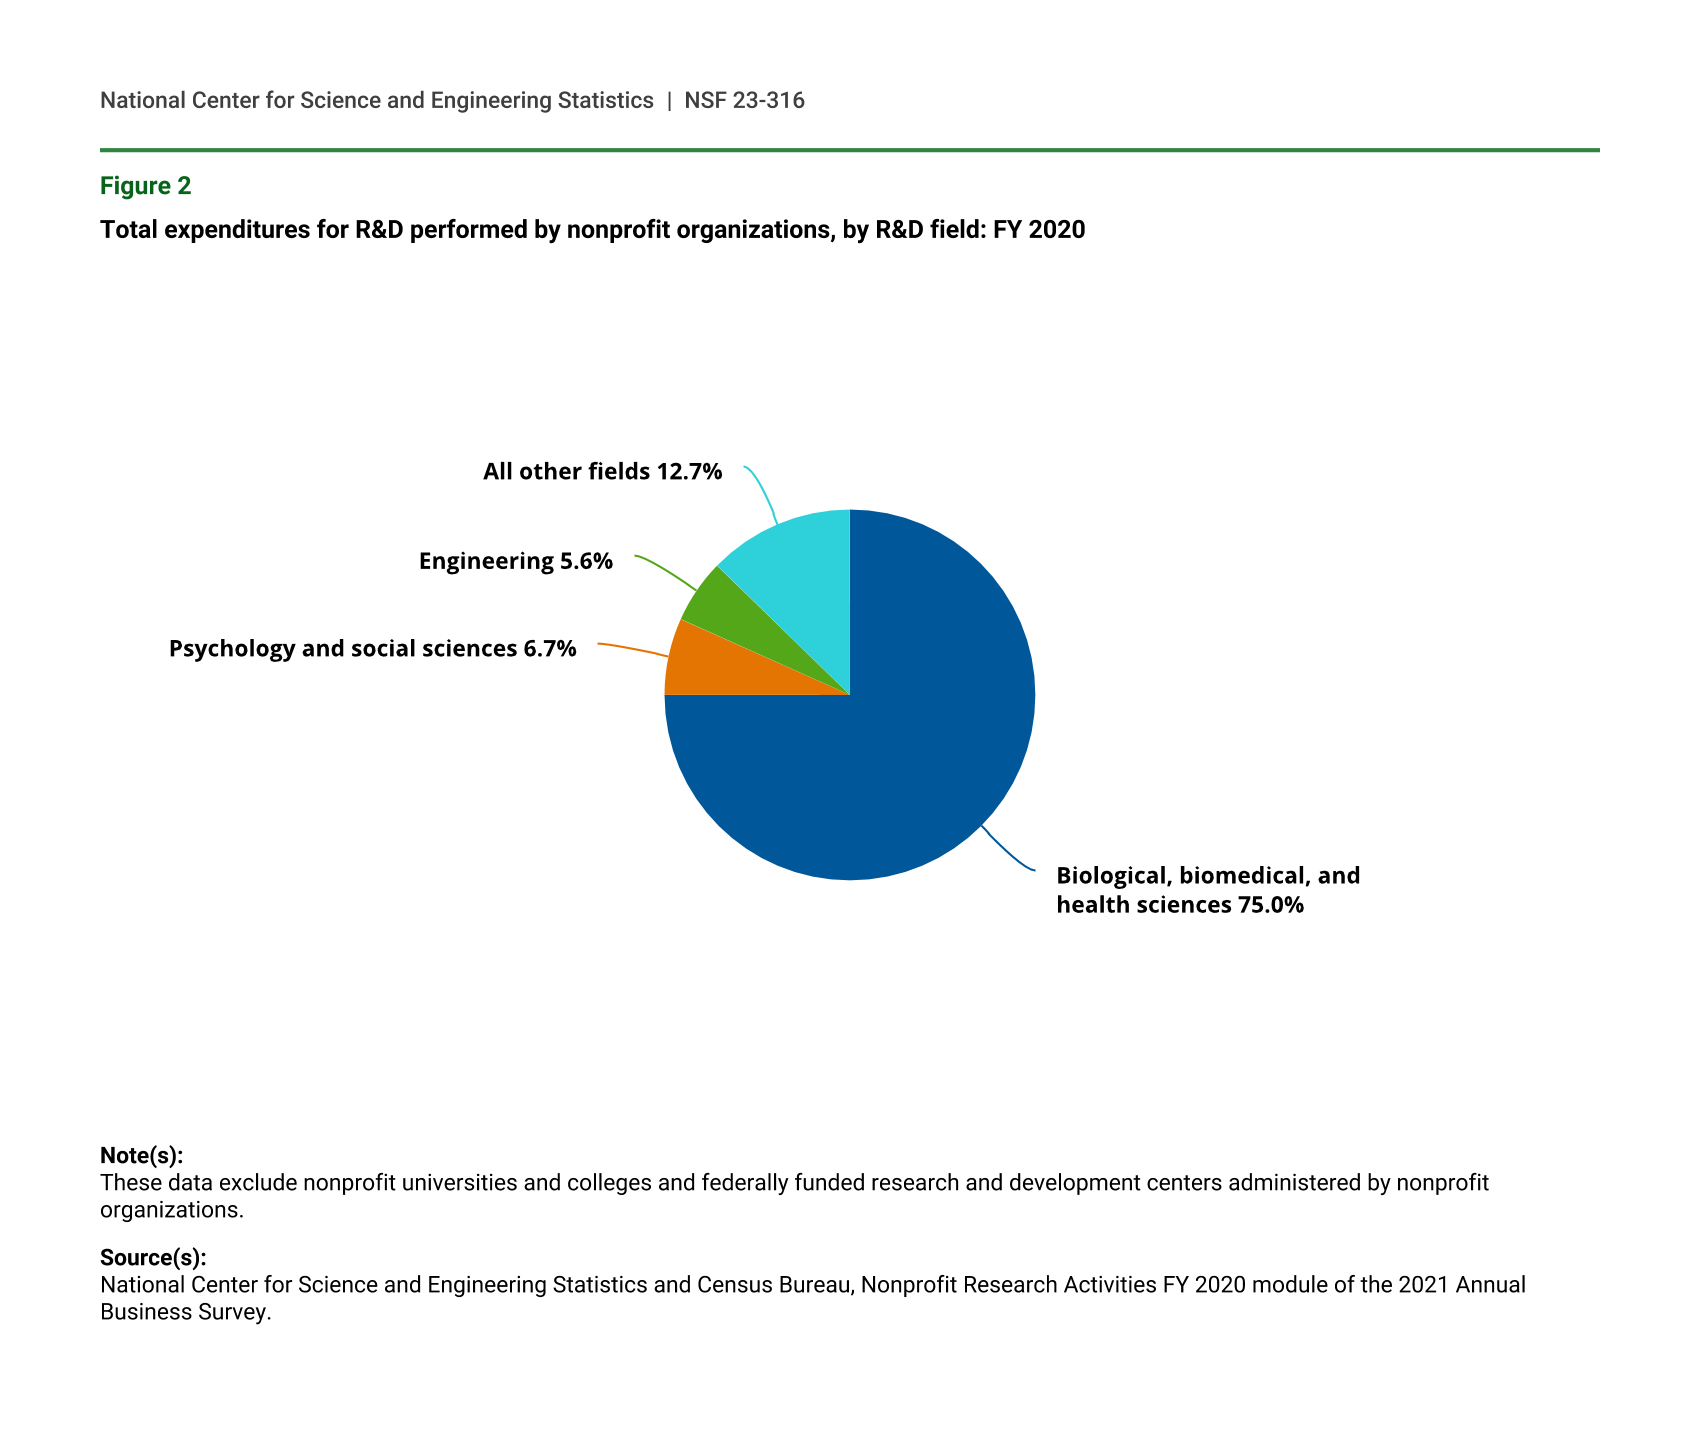
Similar to the higher education sector, nonprofit R&D is concentrated in the health and medical fields. The vast majority (75%, or $21 billion) of FY 2020 nonprofit R&D spending was in biological, biomedical, and health sciences (figure 2). Nonprofits also spent 7% ($1.9 billion) in psychology and social sciences. Another 6% of total R&D was reported in engineering in FY 2020 ($1.6 billion). The remaining fields accounted for nearly 13% ($3.5 billion).
Total expenditures for R&D performed by nonprofit organizations, by R&D field: FY 2020
)
| Field | Share of R&D expenditures (%) |
|---|---|
| Biological, biomedical, and health sciences | 75.0 |
| Psychology and social sciences | 6.7 |
| Engineering | 5.6 |
| All other fields | 12.7 |
Note(s):
These data exclude nonprofit universities and colleges and federally funded research and development centers administered by nonprofit organizations.
Source(s):
National Center for Science and Engineering Statistics and Census Bureau, Nonprofit Research Activities FY 2020 module of the 2021 Annual Business Survey.
Nonprofit R&D Personnel
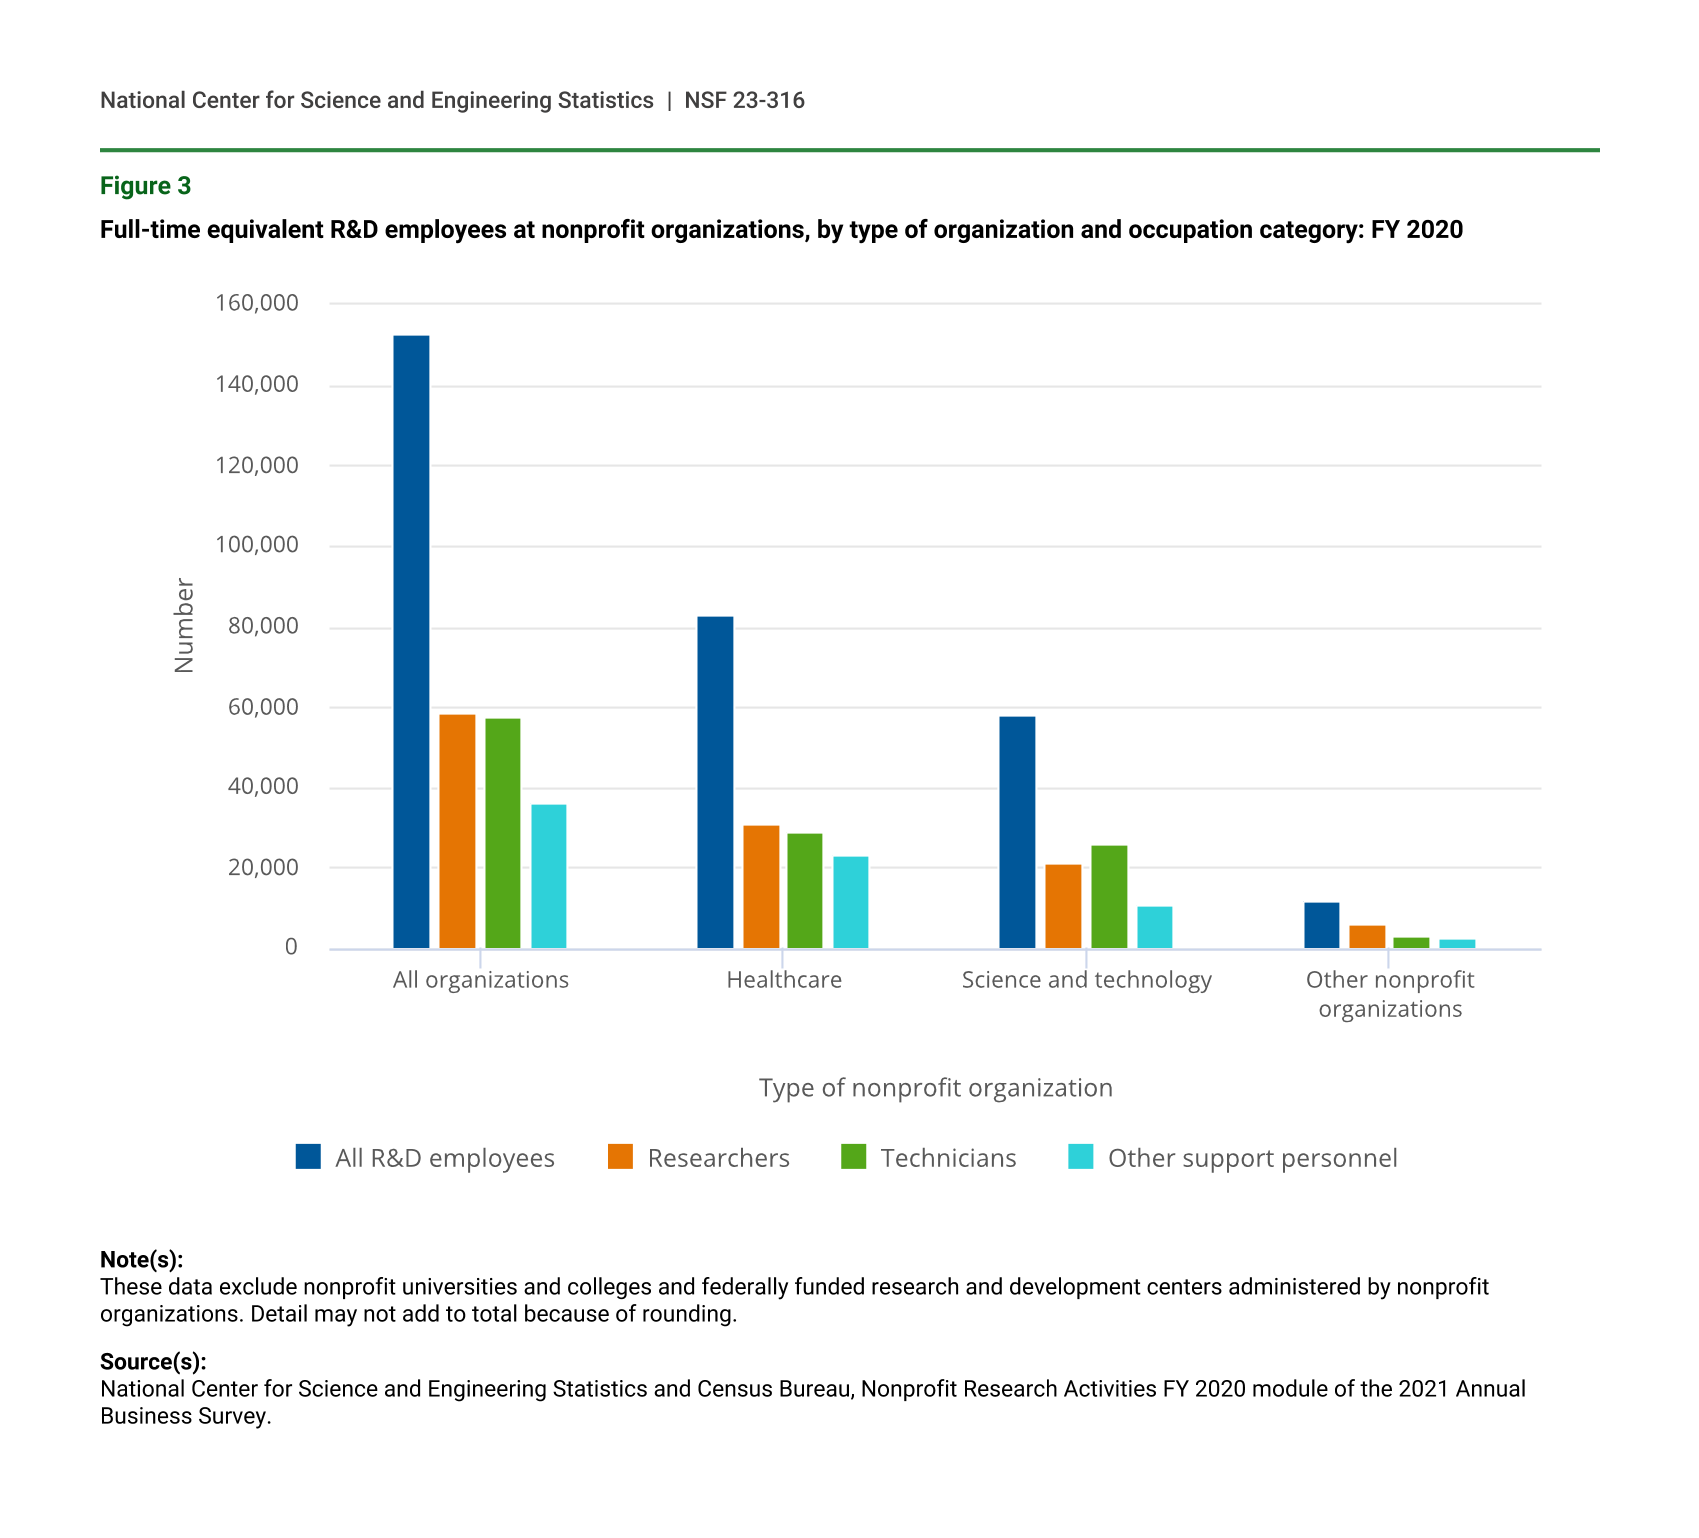
An estimated total of 213,794 employees worked on R&D within U.S. nonprofit organizations in FY 2020, including 152,596 full-time equivalent (FTE) employees. Of this FTE total, 38% (58,657) were classified as researchers, 38% (57,510) were classified as technicians, and the remaining 24% (36,429) were other support personnel (figure 3). Healthcare organizations accounted for over half of the FTE totals and had a higher proportion of other support personnel (28% of their total) compared to science and technology and all other organizations (18% and 21%, respectively).
Full-time equivalent R&D employees at nonprofit organizations, by type of organization and occupation category: FY 2020
| Type of nonprofit organization | All R&D employees | Researchers | Technicians | Other support personnel |
|---|---|---|---|---|
| All organizations | 152,596 | 58,657 | 57,510 | 36,429 |
| Healthcare | 82,887 | 30,816 | 28,753 | 23,318 |
| Science and technology | 57,801 | 21,427 | 25,705 | 10,669 |
| Other nonprofit organizations | 11,908 | 6,414 | 3,052 | 2,442 |
Note(s):
These data exclude nonprofit universities and colleges and federally funded research and development centers administered by nonprofit organizations. Detail may not add to total because of rounding.
Source(s):
National Center for Science and Engineering Statistics and Census Bureau, Nonprofit Research Activities FY 2020 module of the 2021 Annual Business Survey.
Data Source, Limitations, and Availability
The NPRA FY 2020 module of the 2021 Annual Business Survey was conducted in 2021 with a sample of 8,000 nonprofit organizations representing 48,500 total eligible nonprofit organizations in the United States. Higher education institutions and nonprofit-administered federally funded research and development centers (FFRDCs) are not included in this survey, as these populations are already included in NCSES’s Higher Education R&D Survey and FFRDC R&D Survey. The fiscal year referred to throughout this report was the nonprofit organizations’ fiscal year; for the majority (62%) of organizations reporting R&D performance, this fiscal year ended in either September or December of 2020.
The response rate was 83%. The estimates in this InfoBrief are based on responses from a sample of the population and may differ from actual values because of sampling variability or other factors. As a result, apparent differences between the estimates for two or more groups may not be statistically significant. All comparative statements in this InfoBrief have undergone statistical testing and are significant at the 90% confidence level unless otherwise noted. The variances of estimates in this report were calculated using the successive difference replication method.
The full set of data tables for FY 2020 are available at https://ncses.nsf.gov/pubs/nsf23317. For more information, please contact the author.
Notes
1All amounts in this report are shown in current dollars.
2For the latest statistics from National Patterns of R&D Resources on total U.S. R&D performance and sources of funding, see National Center for Science and Engineering Statistics (NCSES). 2022. National Patterns of R&D Resources: 2019–20 Data Update. Data Tables NSF 22-320. Alexandria, VA: National Science Foundation. Available at https://ncses.nsf.gov/pubs/nsf22320. The estimate from National Patterns of R&D Resources for nonprofit R&D performance in calendar year 2020 was $28.5 billion, or 4.0% of the U.S. total.
3Historic estimates of nonprofit organization R&D from 1953–2020 and details about their creation are available in the National Patterns of R&D Resources: 2019–20 Data Update, available at https://ncses.nsf.gov/pubs/nsf22320. Information on the Annual Business survey is available at https://www.nsf.gov/statistics/srvyabs/.
4National Center for Science and Engineering Statistics (NCSES). 2022. Nonprofit Research Activities: Fiscal Year 2016. NSF 22-338. Alexandria, VA: National Science Foundation. Available at https://ncses.nsf.gov/pubs/nsf22338/.
5The remaining sources include state and local government funding, funding from individual donors, and all other sources not included in the named categories.
6For higher education R&D expenditures by field, see table 3 in National Center for Science and Engineering Statistics (NCSES). 2021. Higher Education Research and Development: Fiscal Year 2020. NSF 22-311. Alexandria, VA: National Science Foundation. Available at https://ncses.nsf.gov/pubs/nsf22311.
7See table 4 in the FY 2020 data tables at https://ncses.nsf.gov/pubs/nsf23317 for the full breakdown of R&D expenditures by field.
8Employee numbers were reported both as total headcounts and as full-time equivalents (FTE). Headcounts represent every individual employed by the organization during FY 2020 regardless of their total hours worked. The FTE counts convert the headcounts to a total of full-time equivalent employees using the following calculation: 1 FTE equals 40 hours per week for 52 weeks per year. If an employee works 20 hours per week, they count as half of an FTE. See tables 8 and 9 in the FY 2020 data tables for more details on headcounts (https://ncses.nsf.gov/pubs/nsf23317).
9See the Technical Notes to the FY 2020 data tables at for details on the survey frame and exclusions (https://ncses.nsf.gov/pubs/nsf23317).
Suggested Citation
Britt R; National Center for Science and Engineering Statistics (NCSES). 2022. U.S. Nonprofits Spent $28 Billion on R&D Activities in FY 2020. NSF 23-316. Alexandria, VA: National Science Foundation. Available at https://ncses.nsf.gov/pubs/nsf23316.
Contact Us
NCSES
National Center for Science and Engineering Statistics
Directorate for Social, Behavioral and Economic Sciences
National Science Foundation
2415 Eisenhower Avenue, Suite W14200
Alexandria, VA 22314
Tel: (703) 292-8780
FIRS: (800) 877-8339
TDD: (800) 281-8749
E-mail: ncsesweb@nsf.gov
NSF 23-316
|December 28, 2022