 An official website of the United States government

Businesses Invested $32.5 Billion in Assets to Support Their R&D Activities in the United States in 2020
In 2020, businesses invested $32.5 billion in assets such as buildings, equipment, and software to support their U.S. research and development activities, according to the Business Enterprise Research and Development Survey (BERD) developed and cosponsored by the National Center for Science and Engineering Statistics (NCSES) within the National Science Foundation (NSF) and by the Census Bureau, which collected and tabulated the data. Manufacturing companies accounted for $19.7 billion (61%) and nonmanufacturing companies for $12.8 billion (39%) of these capital expenditures for R&D. These capital expenditures are separate from the $537.6 billion in 2020 U.S. business R&D performance from the same BERD survey (Wolfe 2022).
Capital expenditures are payments for the acquisition or improvement of long-lived assets used by a business in its operations. Businesses that performed or funded R&D had $686.4 billion in total capital expenditures in the United States in 2020 (table 1). Of this total, $288.8 billion was spent by manufacturing companies (42%) and $397.6 billion (58%) was spent by nonmanufacturers.
U.S. capital expenditures by business R&D performers, total and for domestic R&D, by selected industry and company size: 2020
* = amount < $500,000; D = data withheld to avoid disclosing operations of individual companies; i = more than 50% of the estimate is a combination of imputation and reweighting to account for nonresponse; na = not applicable.
NAICS = 2017 North American Industry Classification System.
a The Business Enterprise Research and Development Survey does not include companies with fewer than 10 domestic employees.
Note(s):
Detail may not add to total because of rounding. Industry classification is based on the dominant business code for domestic R&D performance, where available. For companies that did not report business codes, the classification used for sampling was assigned. Statistics are representative of companies located in the United States that performed or funded $50,000 or more of R&D and are not comparable with estimates published for years prior to 2018. The "undistributed" column shown in prior years is no longer necessary because of processing improvements implemented beginning in 2015.
Source(s):
National Center for Science and Engineering Statistics and Census Bureau, Business Enterprise Research and Development Survey, 2020.
R&D Capital Expenditures by Type of Asset
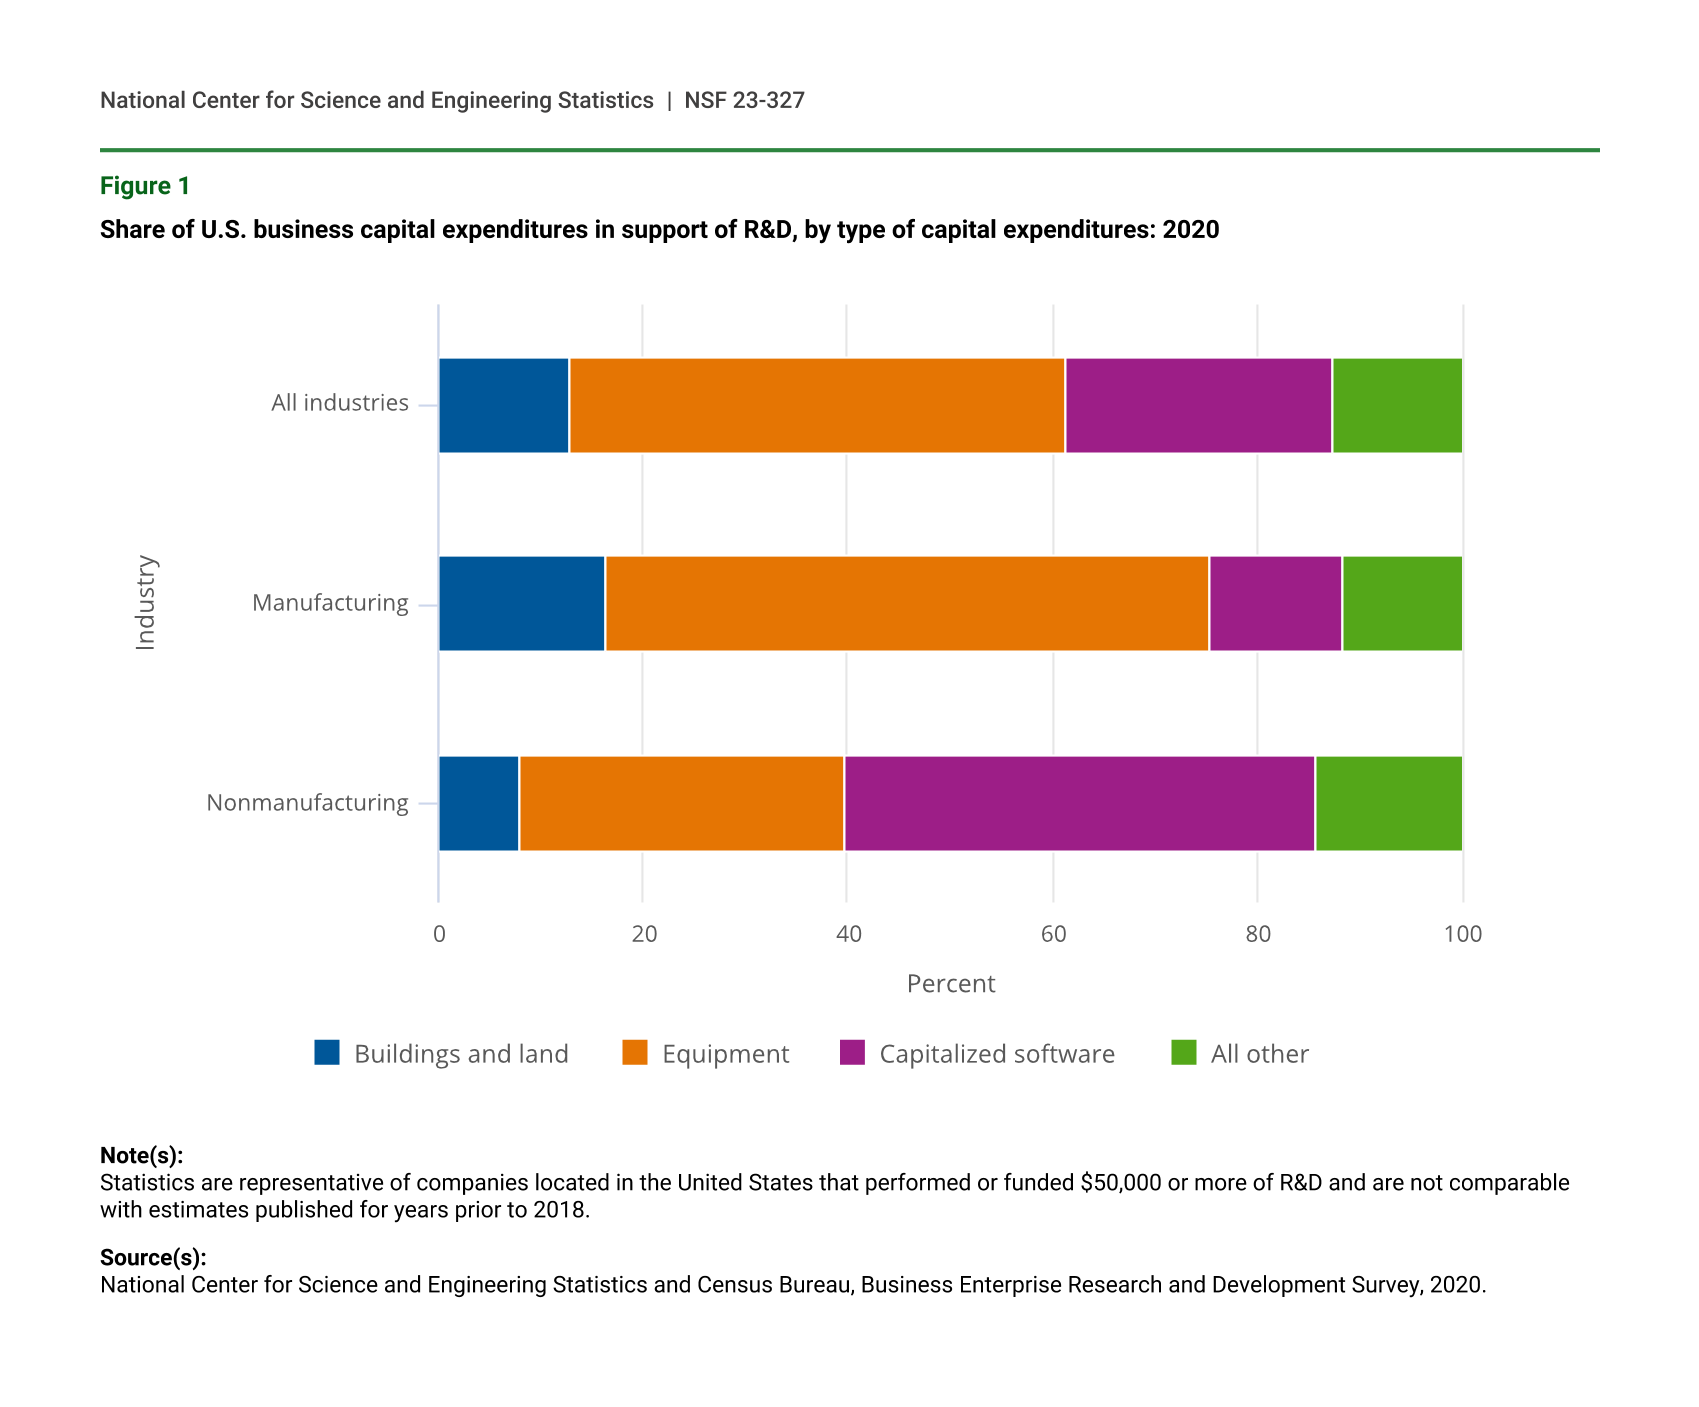
BERD estimates capital expenditures for R&D in five types of assets: land acquisition, buildings and land improvements, equipment, capitalized software, and all other (which includes intangible assets such as patents). Of the $32.5 billion of R&D capital expenditures, equipment accounted for almost half ($15.7 billion), followed by capitalized software ($8.4 billion). Buildings and land improvements and “all other” each accounted for $4.1 billion of capital expenditures for R&D. About $0.1 billion was devoted to land acquisition in support of R&D.
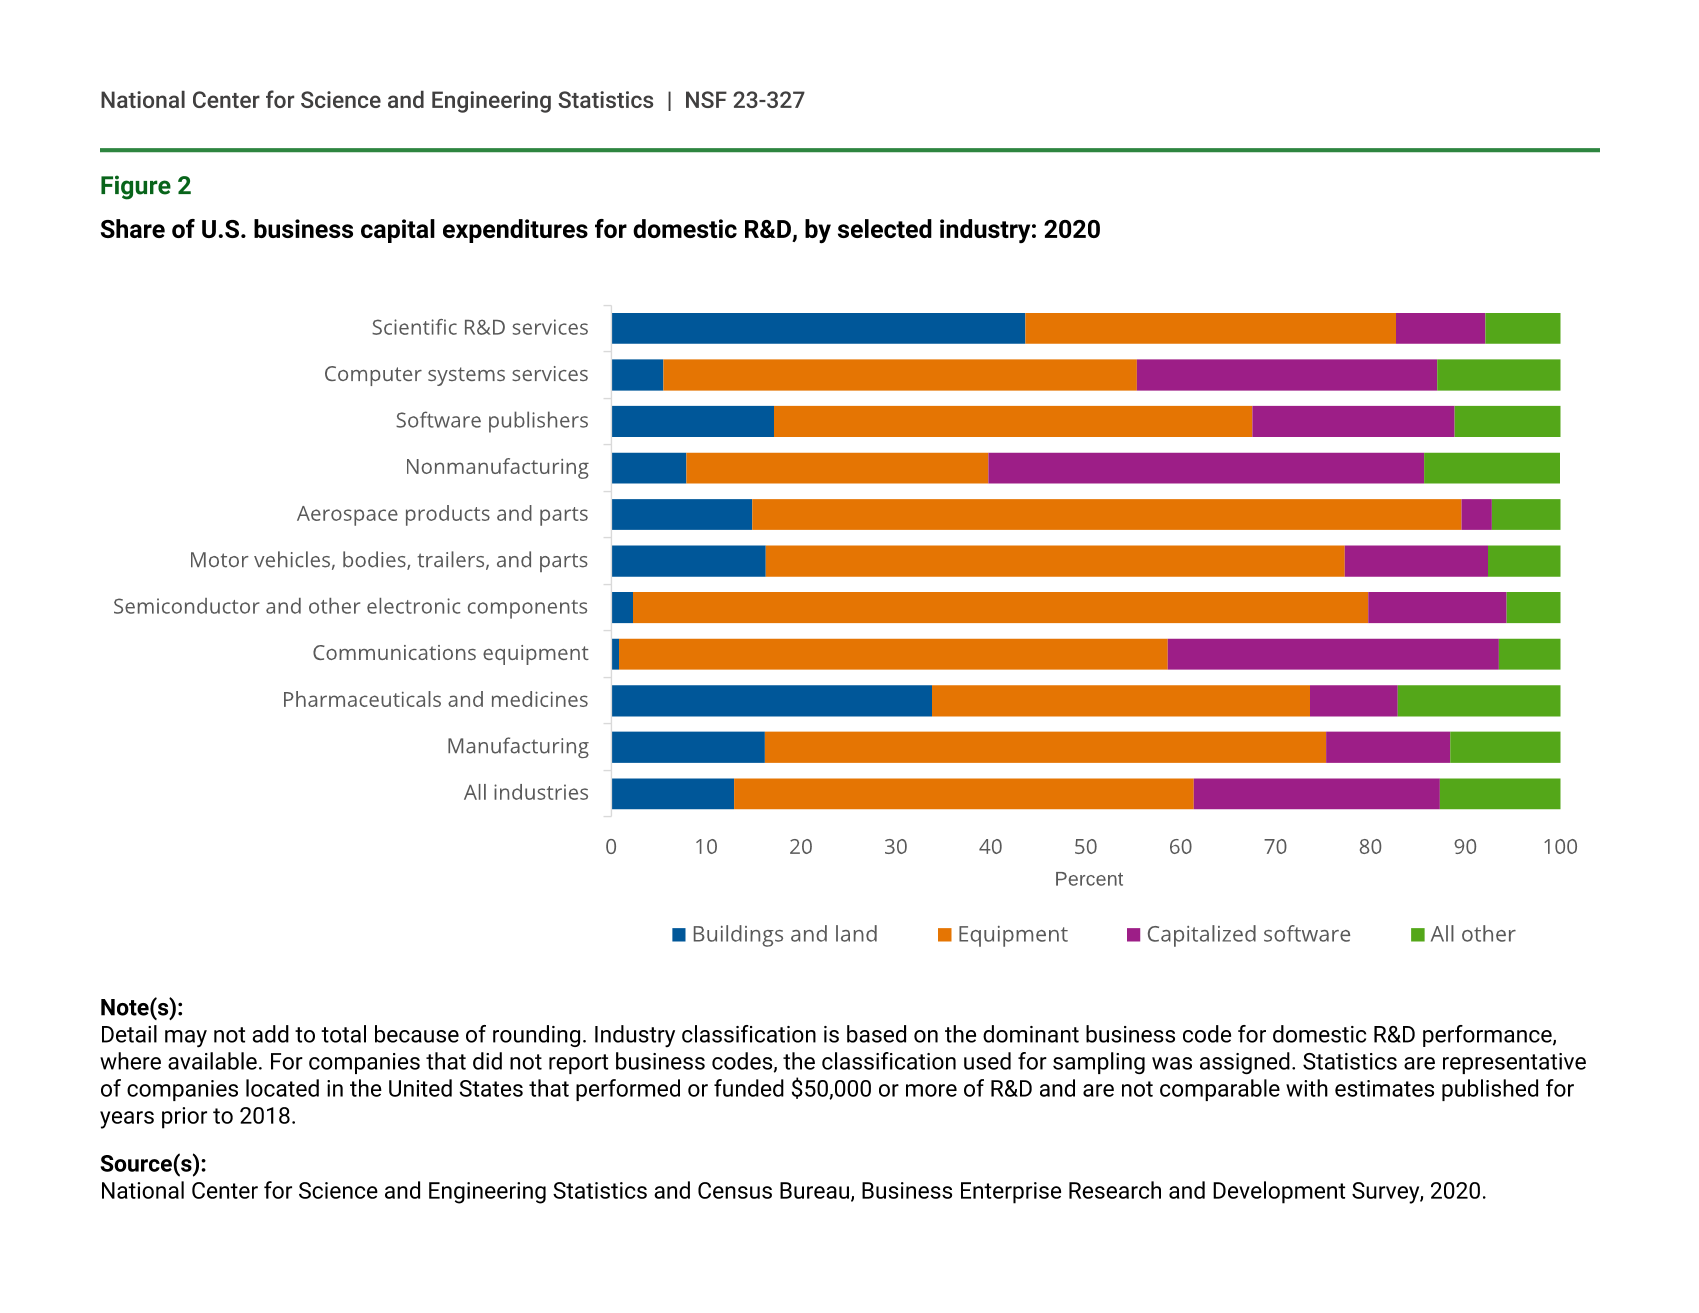
Figure 1 shows that the types of assets supporting U.S. business R&D differ for manufacturing vs. nonmanufacturing sectors. Manufacturing industries as a whole invested primarily in equipment (59%), with the next largest category being buildings and land (16%). The largest category for nonmanufacturing industries was capitalized software (46%), followed by equipment (32%). Figure 2 shows these categories by selected industries. Notably, semiconductor and other electronic component manufacturing (North American Industry Classification System [NAICS] code 3344) and aerospace product and parts manufacturing (NAICS 3364) each had a share of over 70% for equipment expenditures (table 1).
Share of U.S. business capital expenditures in support of R&D, by type of capital expenditures: 2020
| Industry | Buildings and land | Equipment | Capitalized software | All other |
|---|---|---|---|---|
| All industries | 12.9 | 48.4 | 26.0 | 12.7 |
| Manufacturing | 16.2 | 59.1 | 13.1 | 11.6 |
| Nonmanufacturing | 7.9 | 31.8 | 45.9 | 14.3 |
Note(s):
Statistics are representative of companies located in the United States that performed or funded $50,000 or more of R&D and are not comparable with estimates published for years prior to 2018.
Source(s):
National Center for Science and Engineering Statistics and Census Bureau, Business Enterprise Research and Development Survey, 2020.
Share of U.S. business capital expenditures for domestic R&D, by selected industry: 2020
Note(s):
Detail may not add to total because of rounding. Industry classification is based on the dominant business code for domestic R&D performance, where available. For companies that did not report business codes, the classification used for sampling was assigned. Statistics are representative of companies located in the United States that performed or funded $50,000 or more of R&D and are not comparable with estimates published for years prior to 2018.
Source(s):
National Center for Science and Engineering Statistics and Census Bureau, Business Enterprise Research and Development Survey, 2020.
Intensity Measures by Industry
As shown in the last column of table 1, in 2020, U.S. R&D capital expenditures accounted for 5% of the $686.4 billion in total U.S. capital expenditures by businesses that performed or funded R&D. The balance of capital expenditures supports other supply chain activities such as manufacturing, the provision of services, and other business operations. Interestingly, the overall share of domestic R&D to domestic sales of R&D performers is also about 5% (Wolfe 2022). Furthermore, industries with relatively large shares of R&D capital expenditures also have relatively higher R&D-to-sales intensities (figure 3).
For some industries, such as chemical manufacturing (NAICS 325) and pharmaceutical and medicine manufacturing (NAICS 3254), the R&D capital expenditure intensity is of a similar magnitude to the R&D-to-sales intensity, as can be seen in figure 3, where the values are close to the diagonal reference line. However, for the software publishers industry (NAICS 5112), the R&D intensity measured as R&D-to-sales ratio is about three times its R&D capital expenditure intensity. The R&D-to-sales share is also higher relative to R&D capital expenditure intensity for another R&D-intensive service industry, scientific research and development services (NAICS 5417), though by a smaller factor. These two intensities, alongside labor costs-based intensities examined in Moris and Shackelford (2022), provide a fuller picture of the relative importance of labor and capital inputs in different industries’ R&D. This understanding can in turn help researchers and policymakers evaluate and explain the impact of changing economic conditions and policy measures on business R&D and innovation.
U.S. R&D capital expenditures as share of capital expenditures and R&D-to-sales share, by selected industry: 2020
NAICS = 2017 North American Industry Classification System.
Note(s):
Codes shown in scatter plot refer to NAICS industry classification codes; see table data source. The diagonal is a reference line where the horizontal values (x-axis) are the same as the vertical values (y-axis). Industry classification is based on the dominant business code for domestic R&D performance, where available. For companies that did not report business codes, the classification used for sampling was assigned. Statistics are representative of companies located in the United States that performed or funded $50,000 or more of R&D and are not comparable with estimates published for years prior to 2018.
Source(s):
National Center for Science and Engineering Statistics and Census Bureau, Business Enterprise Research and Development Survey, 2020.
Survey Information and Data Availability
In this InfoBrief, money amounts are expressed in current U.S. dollars and are not adjusted for inflation. A company is defined as a business organization located in the United States, either U.S. owned or a U.S. affiliate of a foreign parent company, with one or more establishments under common ownership or control.
The sample for BERD was selected to represent all for-profit, nonfarm companies that were publicly or privately held, had 10 or more employees in the United States, and performed or funded R&D either domestically or abroad. Industry classification of businesses in BERD was based on the dominant business activity for domestic R&D performance, where available. Units that did not report business activity codes for R&D are assigned an industry using administrative payroll data.
Beginning in survey year 2018, companies that performed or funded less than $50,000 of R&D were excluded from tabulation. In prior years, companies that performed or funded any amount of R&D were tabulated. This change has affected the comparability of these estimates to those published in prior years, though at the same time the excluded companies in aggregate represented a very small share of total R&D expenditures in prior years (Wolfe 2022).
The statistics from the survey are based on a sample and are subject to sampling and nonsampling errors. (See “Technical Notes” in the reports with the data tables at https://www.nsf.gov/statistics/srvybrds/).
References
Annual Capital Expenditures Survey (ACES). 2020. Available at https://www.census.gov/programs-surveys/aces/data/tables.html. See Table 1a under the 2021 release.
Moris F, Shackelford B; National Center for Science and Engineering Statistics (NCSES). 2023. Labor Costs Account for Over Two-Thirds of U.S. Business R&D Performance in 2020. NSF 23-322. Alexandria, VA: National Science Foundation. Available at https://ncses.nsf.gov/pubs/nsf23322.
Wolfe R; National Center for Science and Engineering Statistics (NCSES). 2022. Businesses Spent Over a Half Trillion Dollars for R&D Performance in the United States. NSF 22-343. Alexandria, VA: National Science Foundation. Available at https://ncses.nsf.gov/pubs/nsf22343.
Notes
1Although BERD estimates separately U.S. R&D performance and the capital expenditures discussed here, these two measures should not be summed unless data users subtract depreciation expenses from domestic R&D performance by type of cost, which is available under "Data" at https://www.nsf.gov/statistics/srvyberd/. BERD measures R&D performance in terms of current costs or expenses, which include labor costs, materials and supplies, expensed equipment (not capitalized), leased facilities and equipment, and expenses for depreciation and amortization on property, plant, and equipment. R&D performance expenditures are dominated by labor costs, in comparison with current costs associated with facilities or equipment such as rental expenses or expensed equipment. This situation is particularly the case for service industries. For example, in 2020, the R&D of the information sector (NAICS 51) (which includes the software services industry) is rather labor-intensive with over 80% of the sector’s R&D performance accounted for by labor costs, compared with 69% for all industries (Moris and Shackelford 2023).
2Businesses also can acquire assets by merging with or purchasing other businesses. Assets acquired through mergers and acquisitions are not included in the BERD estimates.
3As a reference point, the Census Bureau’s Annual Capital Expenditures Survey (ACES), a separate survey covering all U.S.-located businesses (regardless of R&D activity), estimated $1,706.4 billion in 2020 in total domestic capital expenditures for structures and equipment (ACES 2020). The ACES “equipment” category includes capitalized software. Further, ACES includes organizations that are out of scope for BERD, such as nonprofits and businesses with fewer than 10 employees, whereas BERD includes capital expenditures that are excluded by ACES, such as land and intangible assets like patents.
4Land acquisition is combined with buildings and land improvements in a category named “buildings and land” in the analysis below.
5Along the diagonal reference line, the horizontal values (x-axis) are the same as the vertical values (y-axis).
Suggested Citation
Moris F, Shackelford B; National Center for Science and Engineering Statistics (NCSES). 2023. Businesses Invested $32.5 Billion in Assets to Support Their R&D Activities in the United States in 2020. NSF 23-327. Alexandria, VA: National Science Foundation. Available at https://ncses.nsf.gov/pubs/nsf23327.
Contact Us
NCSES
National Center for Science and Engineering Statistics
Directorate for Social, Behavioral and Economic Sciences
National Science Foundation
2415 Eisenhower Avenue, Suite W14200
Alexandria, VA 22314
Tel: (703) 292-8780
FIRS: (800) 877-8339
TDD: (800) 281-8749
E-mail: ncsesweb@nsf.gov
NSF 23-327
|March 17, 2023