 An official website of the United States government

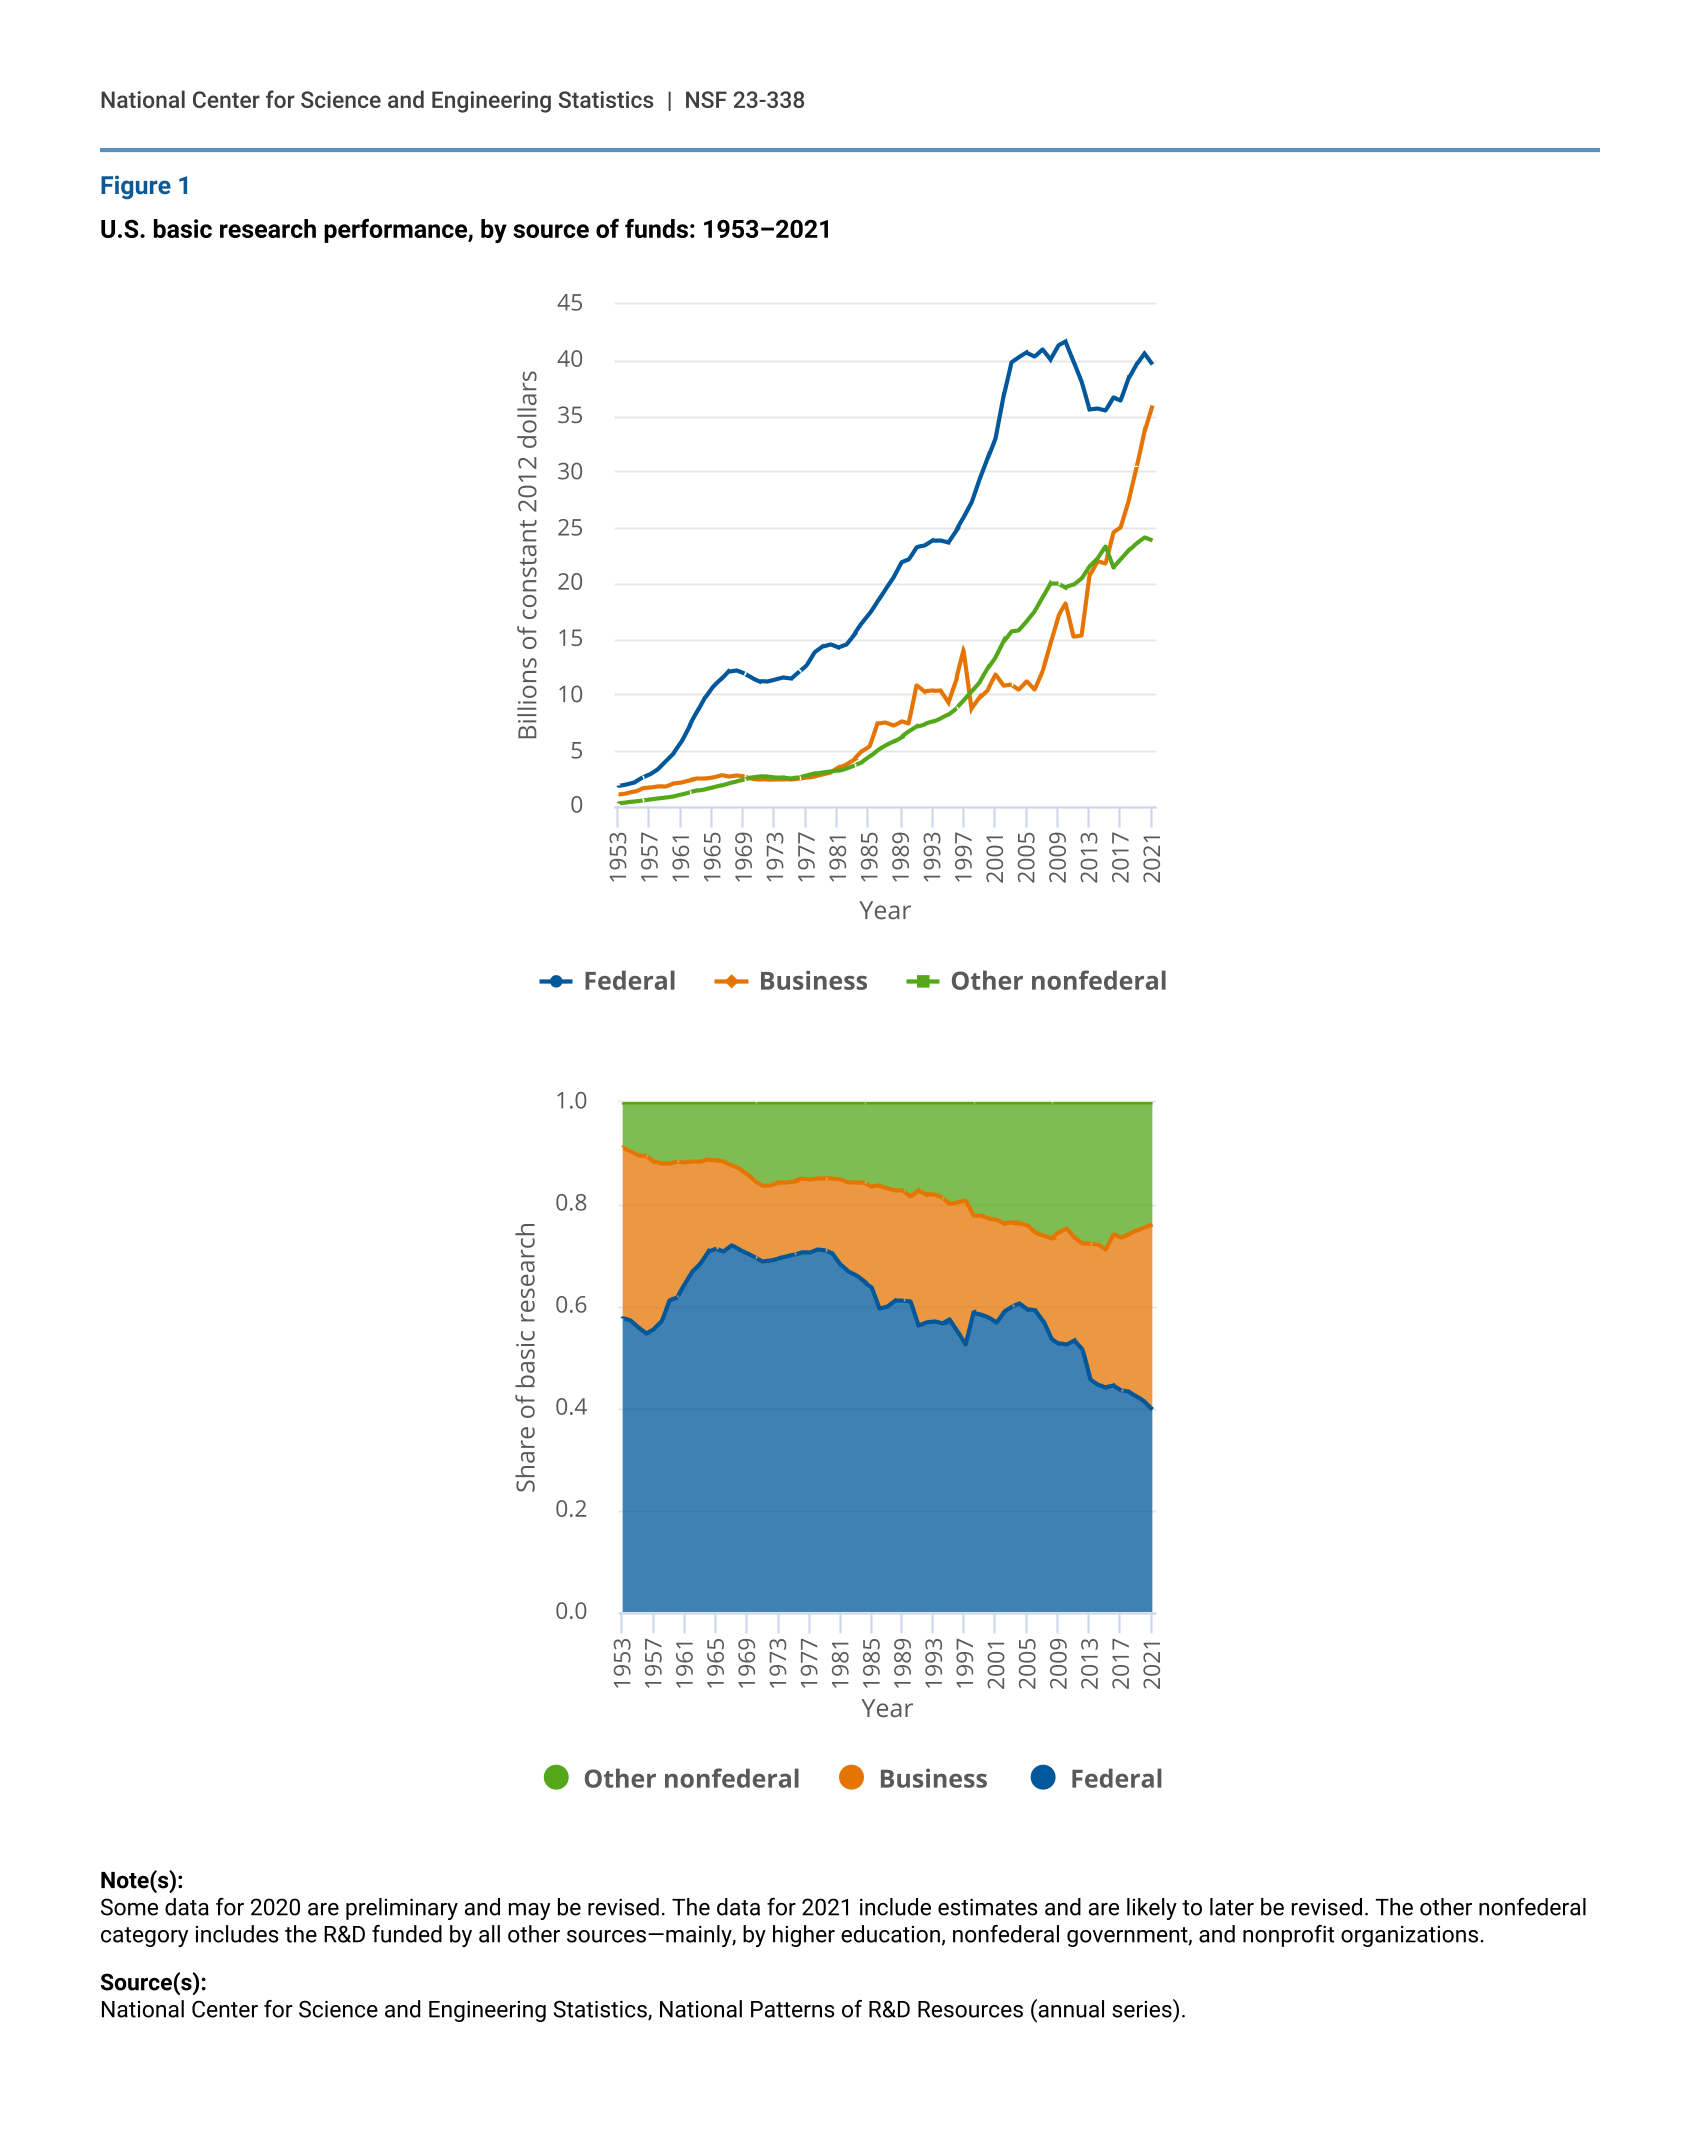
Business Sector Increases Funding for Basic Research
U.S. basic research performance, by source of funds: 1953–2021
| Year | Federal | Business | Other nonfederal |
|---|---|---|---|
| 1953 | 1.84 | 1.07 | 0.28 |
| 1954 | 1.99 | 1.16 | 0.34 |
| 1955 | 2.15 | 1.30 | 0.40 |
| 1956 | 2.56 | 1.63 | 0.49 |
| 1957 | 2.85 | 1.69 | 0.60 |
| 1958 | 3.32 | 1.80 | 0.70 |
| 1959 | 4.05 | 1.77 | 0.80 |
| 1960 | 4.77 | 2.06 | 0.90 |
| 1961 | 5.78 | 2.15 | 1.06 |
| 1962 | 7.16 | 2.32 | 1.25 |
| 1963 | 8.40 | 2.47 | 1.42 |
| 1964 | 9.69 | 2.48 | 1.54 |
| 1965 | 10.68 | 2.59 | 1.70 |
| 1966 | 11.34 | 2.80 | 1.87 |
| 1967 | 12.11 | 2.63 | 2.09 |
| 1968 | 12.22 | 2.73 | 2.25 |
| 1969 | 11.93 | 2.63 | 2.40 |
| 1970 | 11.54 | 2.45 | 2.59 |
| 1971 | 11.23 | 2.42 | 2.68 |
| 1972 | 11.18 | 2.38 | 2.65 |
| 1973 | 11.36 | 2.42 | 2.58 |
| 1974 | 11.52 | 2.40 | 2.59 |
| 1975 | 11.44 | 2.36 | 2.53 |
| 1976 | 12.04 | 2.46 | 2.56 |
| 1977 | 12.66 | 2.58 | 2.73 |
| 1978 | 13.83 | 2.71 | 2.90 |
| 1979 | 14.34 | 2.86 | 3.02 |
| 1980 | 14.54 | 3.04 | 3.11 |
| 1981 | 14.24 | 3.46 | 3.17 |
| 1982 | 14.49 | 3.77 | 3.41 |
| 1983 | 15.38 | 4.20 | 3.68 |
| 1984 | 16.35 | 4.88 | 3.96 |
| 1985 | 17.24 | 5.34 | 4.45 |
| 1986 | 18.36 | 7.42 | 5.04 |
| 1987 | 19.44 | 7.51 | 5.45 |
| 1988 | 20.48 | 7.24 | 5.78 |
| 1989 | 21.82 | 7.64 | 6.20 |
| 1990 | 22.08 | 7.40 | 6.69 |
| 1991 | 23.22 | 10.87 | 7.14 |
| 1992 | 23.34 | 10.29 | 7.38 |
| 1993 | 23.79 | 10.35 | 7.56 |
| 1994 | 23.82 | 10.40 | 7.90 |
| 1995 | 23.64 | 9.34 | 8.22 |
| 1996 | 24.68 | 11.35 | 8.78 |
| 1997 | 25.86 | 13.94 | 9.52 |
| 1998 | 27.20 | 8.77 | 10.31 |
| 1999 | 29.28 | 9.73 | 11.12 |
| 2000 | 31.14 | 10.42 | 12.31 |
| 2001 | 32.99 | 11.78 | 13.34 |
| 2002 | 36.69 | 10.79 | 14.73 |
| 2003 | 39.75 | 10.91 | 15.69 |
| 2004 | 40.22 | 10.46 | 15.77 |
| 2005 | 40.64 | 11.23 | 16.58 |
| 2006 | 40.32 | 10.45 | 17.47 |
| 2007 | 40.98 | 12.10 | 18.70 |
| 2008 | 40.06 | 14.61 | 19.97 |
| 2009 | 41.28 | 17.00 | 19.99 |
| 2010 | 41.66 | 18.15 | 19.63 |
| 2011 | 39.91 | 15.18 | 19.84 |
| 2012 | 38.11 | 15.30 | 20.43 |
| 2013 | 35.56 | 20.68 | 21.53 |
| 2014 | 35.65 | 21.95 | 22.25 |
| 2015 | 35.47 | 21.74 | 23.29 |
| 2016 | 36.64 | 24.52 | 21.38 |
| 2017 | 36.35 | 25.00 | 22.14 |
| 2018 | 38.35 | 27.35 | 22.93 |
| 2019 | 39.62 | 30.33 | 23.58 |
| 2020 | 40.61 | 33.61 | 24.11 |
| 2021 | 39.64 | 35.96 | 23.81 |
| Year | Federal | Business | Other nonfederal |
|---|---|---|---|
| 1953 | 0.5767 | 0.3351 | 0.0881 |
| 1954 | 0.5713 | 0.3324 | 0.0964 |
| 1955 | 0.5579 | 0.3369 | 0.1053 |
| 1956 | 0.5465 | 0.3490 | 0.1045 |
| 1957 | 0.5550 | 0.3288 | 0.1162 |
| 1958 | 0.5695 | 0.3096 | 0.1209 |
| 1959 | 0.6122 | 0.2668 | 0.1210 |
| 1960 | 0.6173 | 0.2664 | 0.1163 |
| 1961 | 0.6433 | 0.2389 | 0.1178 |
| 1962 | 0.6678 | 0.2160 | 0.1162 |
| 1963 | 0.6835 | 0.2007 | 0.1158 |
| 1964 | 0.7066 | 0.1811 | 0.1123 |
| 1965 | 0.7132 | 0.1732 | 0.1136 |
| 1966 | 0.7082 | 0.1747 | 0.1171 |
| 1967 | 0.7197 | 0.1561 | 0.1242 |
| 1968 | 0.7105 | 0.1589 | 0.1306 |
| 1969 | 0.7038 | 0.1548 | 0.1414 |
| 1970 | 0.6960 | 0.1477 | 0.1562 |
| 1971 | 0.6878 | 0.1480 | 0.1642 |
| 1972 | 0.6897 | 0.1468 | 0.1635 |
| 1973 | 0.6945 | 0.1479 | 0.1576 |
| 1974 | 0.6975 | 0.1454 | 0.1571 |
| 1975 | 0.7006 | 0.1444 | 0.1550 |
| 1976 | 0.7058 | 0.1441 | 0.1501 |
| 1977 | 0.7048 | 0.1434 | 0.1517 |
| 1978 | 0.7114 | 0.1394 | 0.1492 |
| 1979 | 0.7093 | 0.1413 | 0.1494 |
| 1980 | 0.7028 | 0.1470 | 0.1502 |
| 1981 | 0.6825 | 0.1657 | 0.1518 |
| 1982 | 0.6686 | 0.1740 | 0.1573 |
| 1983 | 0.6610 | 0.1807 | 0.1583 |
| 1984 | 0.6489 | 0.1938 | 0.1573 |
| 1985 | 0.6378 | 0.1976 | 0.1645 |
| 1986 | 0.5958 | 0.2407 | 0.1635 |
| 1987 | 0.6001 | 0.2317 | 0.1683 |
| 1988 | 0.6114 | 0.2160 | 0.1726 |
| 1989 | 0.6118 | 0.2143 | 0.1739 |
| 1990 | 0.6104 | 0.2045 | 0.1851 |
| 1991 | 0.5631 | 0.2637 | 0.1732 |
| 1992 | 0.5691 | 0.2509 | 0.1800 |
| 1993 | 0.5705 | 0.2483 | 0.1812 |
| 1994 | 0.5656 | 0.2470 | 0.1875 |
| 1995 | 0.5738 | 0.2268 | 0.1995 |
| 1996 | 0.5507 | 0.2533 | 0.1960 |
| 1997 | 0.5244 | 0.2826 | 0.1930 |
| 1998 | 0.5876 | 0.1896 | 0.2228 |
| 1999 | 0.5842 | 0.1941 | 0.2218 |
| 2000 | 0.5780 | 0.1935 | 0.2285 |
| 2001 | 0.5678 | 0.2027 | 0.2295 |
| 2002 | 0.5898 | 0.1734 | 0.2368 |
| 2003 | 0.5991 | 0.1645 | 0.2365 |
| 2004 | 0.6053 | 0.1575 | 0.2373 |
| 2005 | 0.5937 | 0.1641 | 0.2422 |
| 2006 | 0.5909 | 0.1531 | 0.2560 |
| 2007 | 0.5710 | 0.1685 | 0.2605 |
| 2008 | 0.5367 | 0.1957 | 0.2675 |
| 2009 | 0.5274 | 0.2172 | 0.2554 |
| 2010 | 0.5245 | 0.2284 | 0.2471 |
| 2011 | 0.5326 | 0.2026 | 0.2648 |
| 2012 | 0.5160 | 0.2072 | 0.2767 |
| 2013 | 0.4572 | 0.2659 | 0.2769 |
| 2014 | 0.4464 | 0.2749 | 0.2787 |
| 2015 | 0.4406 | 0.2701 | 0.2893 |
| 2016 | 0.4439 | 0.2971 | 0.2590 |
| 2017 | 0.4354 | 0.2995 | 0.2651 |
| 2018 | 0.4327 | 0.3086 | 0.2587 |
| 2019 | 0.4236 | 0.3243 | 0.2521 |
| 2020 | 0.4130 | 0.3418 | 0.2452 |
| 2021 | 0.3988 | 0.3617 | 0.2395 |
Note(s):
Some data for 2020 are preliminary and may be revised. The data for 2021 include estimates and are likely to later be revised. The other nonfederal category includes the R&D funded by all other sources—mainly, by higher education, nonfederal government, and nonprofit organizations.
Source(s):
National Center for Science and Engineering Statistics, National Patterns of R&D Resources (annual series).
Expenditures on the performance of basic research funded by the business sector have increased dramatically over the past 2 decades. Based on the institutions that performed the work, funding from the business sector for basic research has increased from $10.4 billion in 2000 to an estimated $36.0 billion in 2021 in constant 2012 dollars. Although federal funding for basic research performance increased in real terms from $31.1 billion in 2000 to $40.6 billion in 2005, little has changed since. Subsequently, federally funded basic research performance has essentially remained near or below $40 billion. The longer-term trends in funding shares follow a similar pattern of decreased relative importance of the federal government as a funding source. From 1961–70, on average the federal government funded 70% of basic research performance and the business sector funded less than 20%. The latest estimate for 2021 indicates that the federal government funded 40% of basic research and the business sector was responsible for 36% of basic research funding. Prior to 2016, the 1950s were the last time that business funded 30% or more of basic research performance.
Suggested citation: Anderson G; National Center for Science and Engineering Statistics (NCSES). 2023. Business Sector Increases Funding for Basic Research. NSF 23-338. Alexandria, VA: National Science Foundation. Available at https://ncses.nsf.gov/pubs/nsf23338/.
NSF 23-338
|June 13, 2023