 An official website of the United States government

Federally Funded R&D Declines as a Share of GDP and Total R&D
NSF 23-339
|June 13, 2023
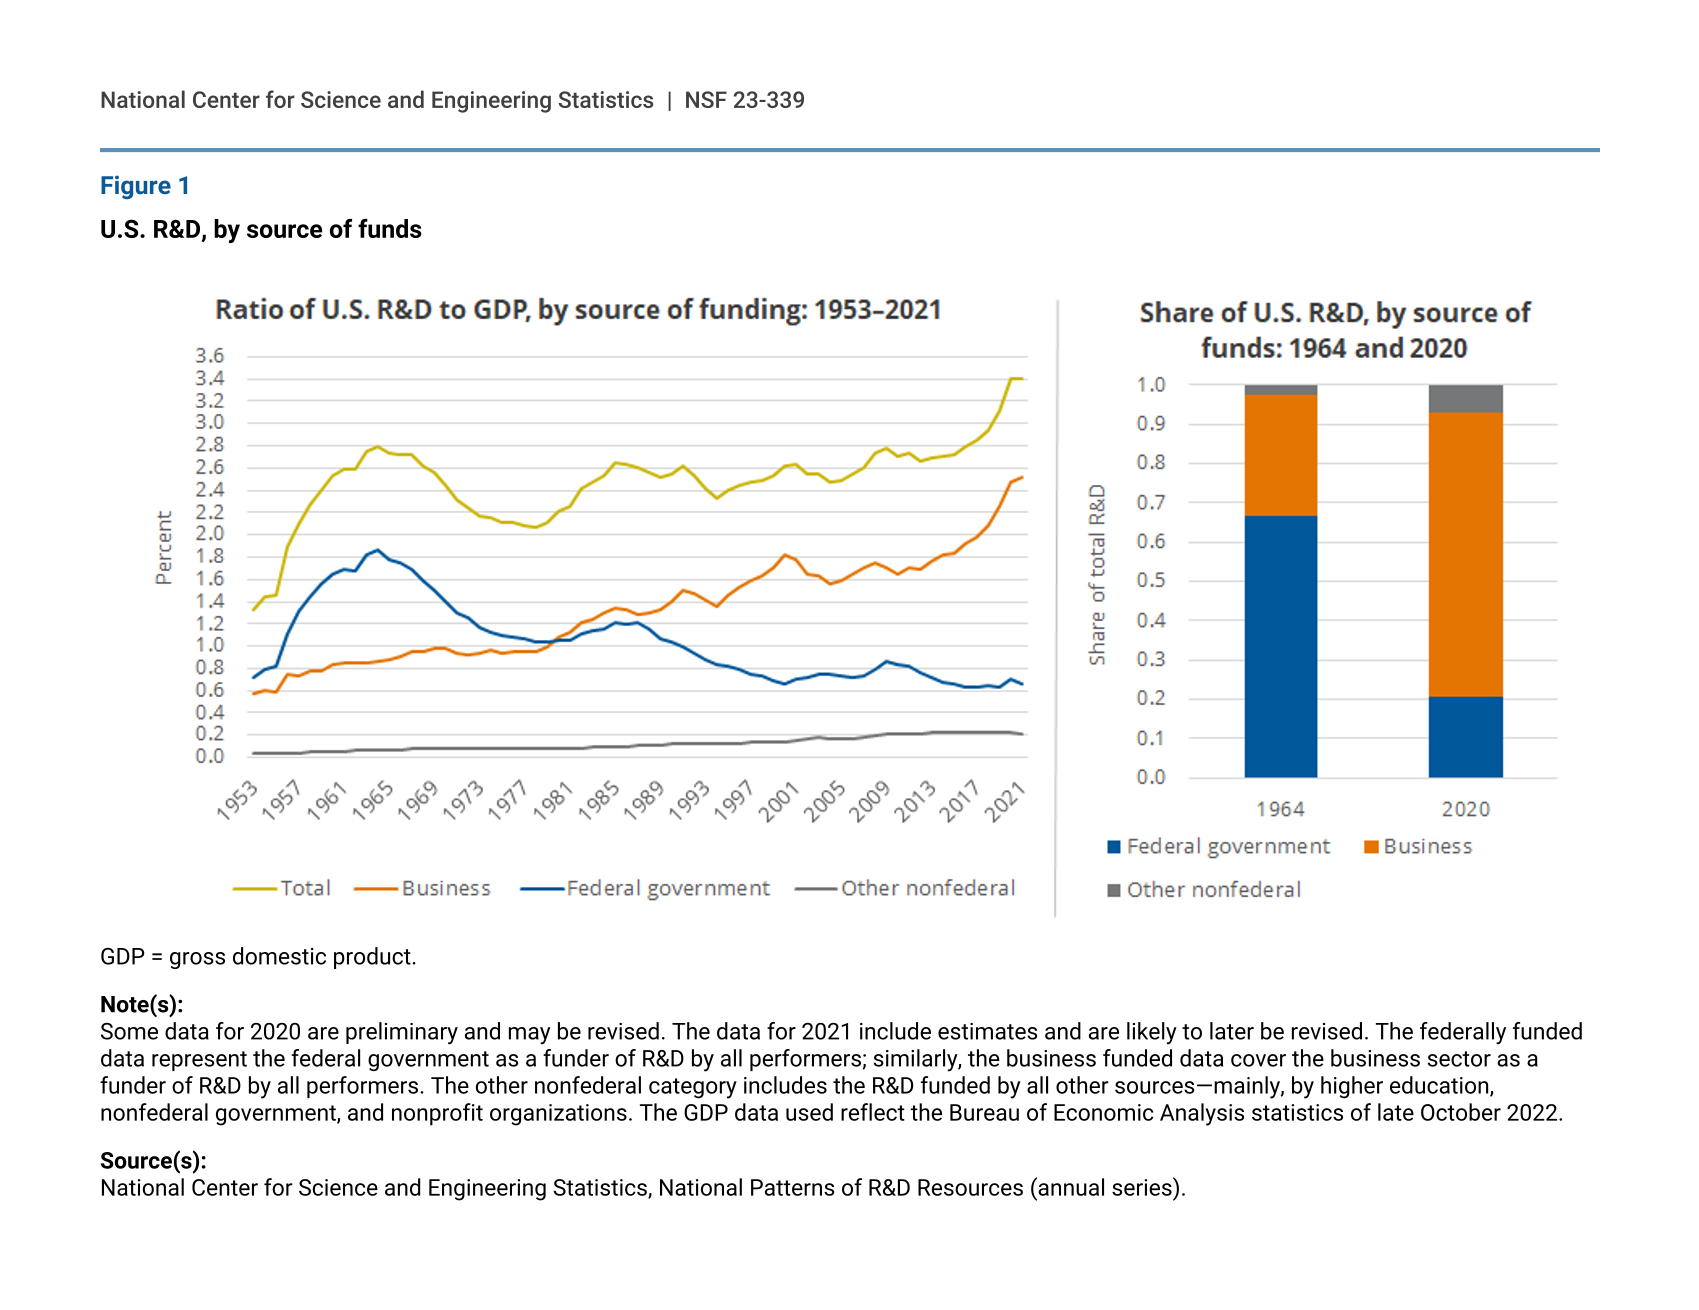
U.S. R&D, by source of funds
GDP = gross domestic product.
Note(s):
Some data for 2020 are preliminary and may be revised. The data for 2021 include estimates and are likely to later be revised. The federally funded data represent the federal government as a funder of R&D by all performers; similarly, the business funded data cover the business sector as a funder of R&D by all performers. The other nonfederal category includes the R&D funded by all other sources—mainly, by higher education, nonfederal government, and nonprofit organizations. The GDP data used reflect the Bureau of Economic Analysis statistics of late October 2022.
Source(s):
National Center for Science and Engineering Statistics, National Patterns of R&D Resources (annual series).
The ratio of U.S. research and development (R&D) to gross domestic product (GDP), at 3.40% in 2021, exceeded 3% for the first time in 2019. However, the decades between the previous peak, 1964, and recent years have witnessed notable changes in the funding sources for domestic R&D. In 1964, federal R&D expenditures accounted for 1.86% of GDP and 67% of all domestic R&D. At that time, business funding for R&D accounted for just 0.86% of the overall economy and 31% of R&D. By 2020, U.S. businesses accounted for 73% of domestic R&D, which amounted to 2.47% of the value of domestically produced goods and services. In the same period, the federally funded shares of R&D had fallen to 21% of domestic R&D and 0.70% of U.S. GDP.
Suggested citation: Anderson G, Moris F; National Center for Science and Engineering Statistics (NCSES). 2023. Federally Funded R&D Declines as a Share of GDP and Total R&D. NSF 23-339. Alexandria, VA: National Science Foundation. Available at https://ncses.nsf.gov/pubs/nsf23339/.
NSF 23-339
|June 13, 2023