 An official website of the United States government

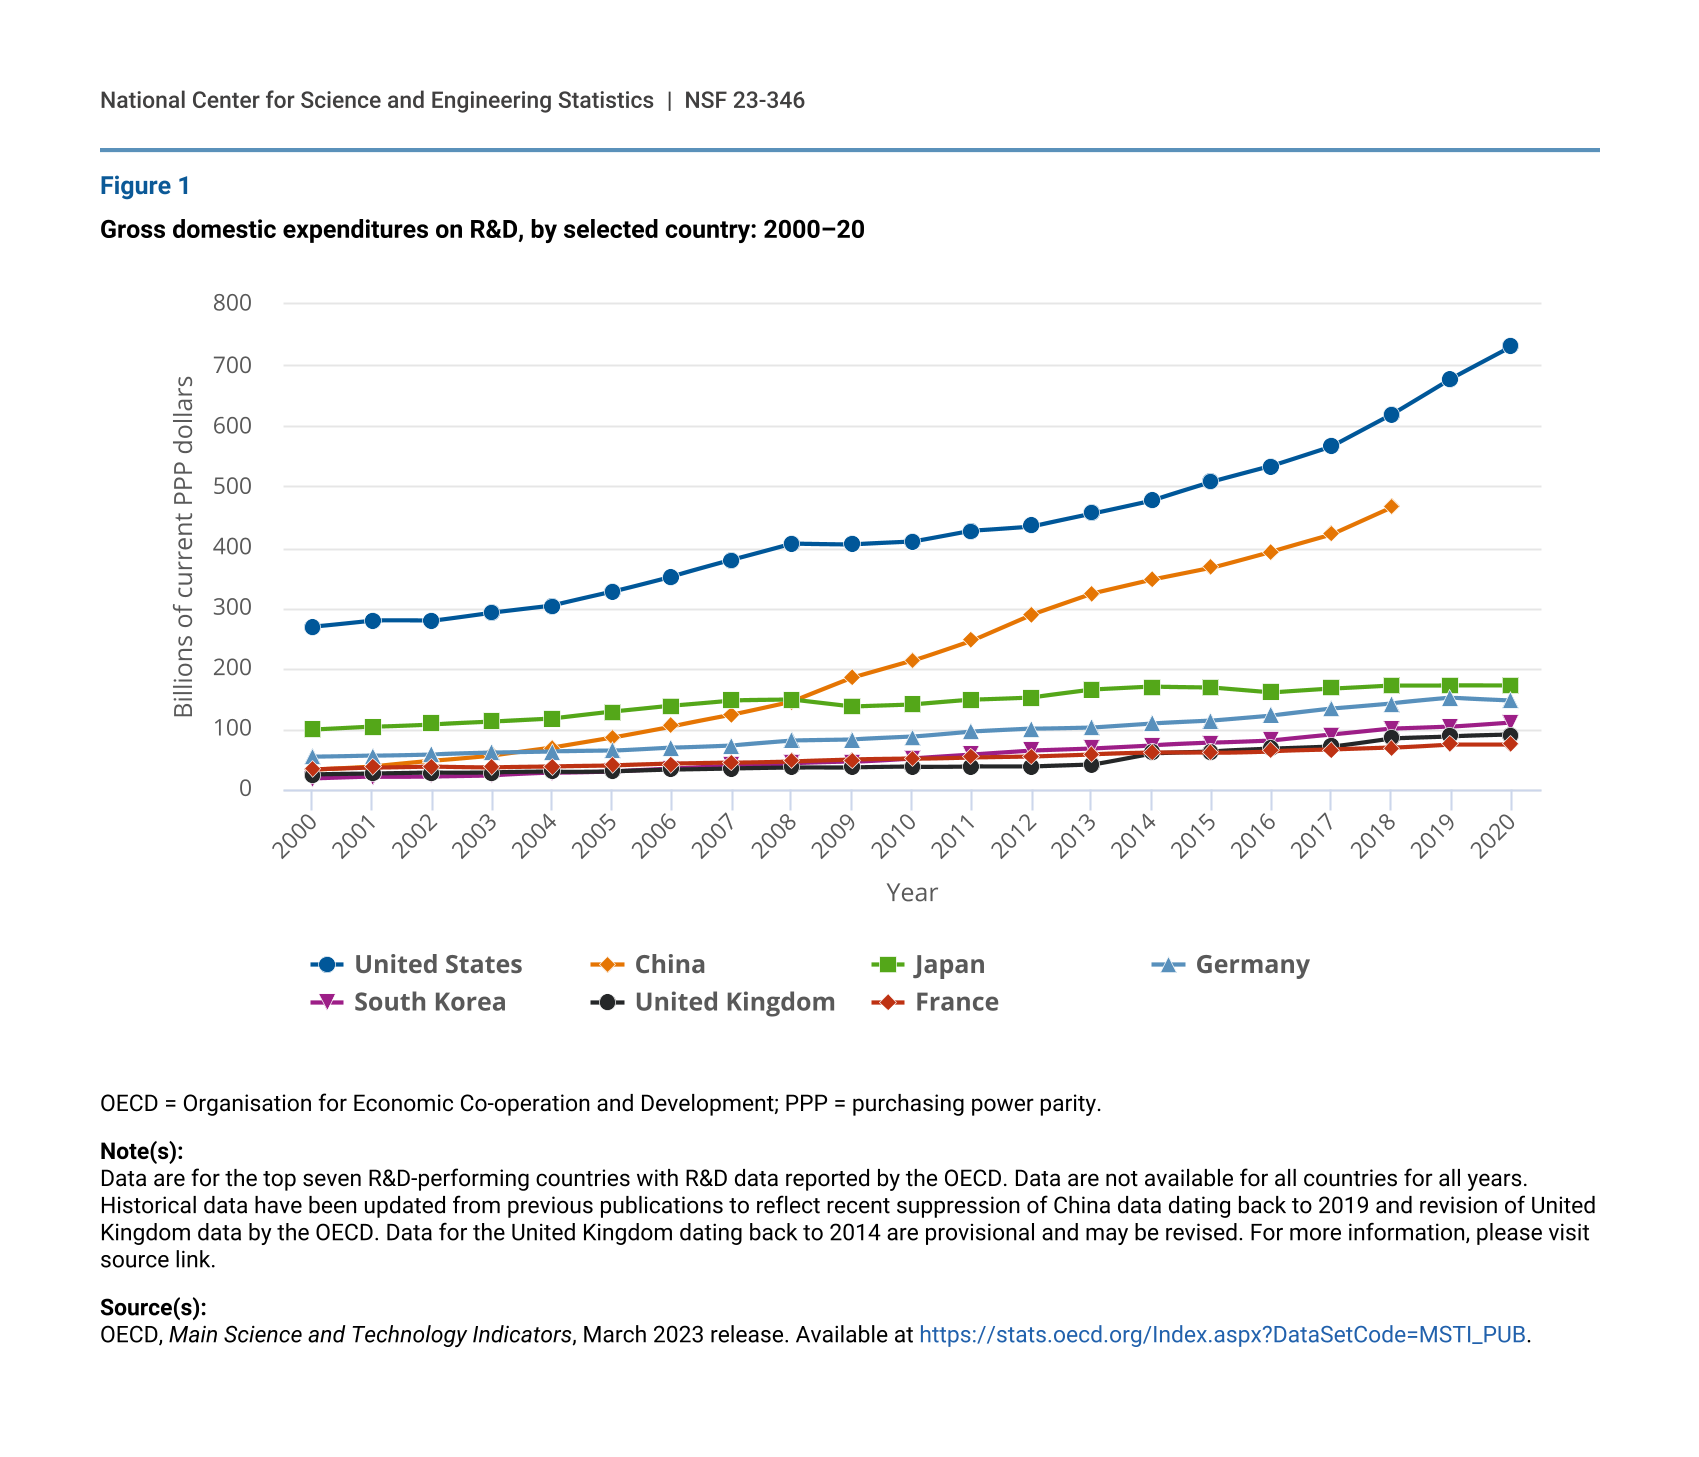
United States Exceeds $700 Billion in Gross Domestic Expenditures on R&D in 2020
Gross domestic expenditures on R&D, by selected country: 2000–20
| Year | United States | China | Japan | Germany | South Korea | United Kingdom | France |
|---|---|---|---|---|---|---|---|
| 2000 | 268.6 | 32.9 | 98.9 | 53.9 | 18.5 | 25.1 | 33.3 |
| 2001 | 279.1 | 38.4 | 103.9 | 56.2 | 21.3 | 26.3 | 36.1 |
| 2002 | 278.4 | 47.8 | 108.2 | 58.6 | 22.5 | 27.9 | 38.3 |
| 2003 | 292.2 | 56.9 | 112.4 | 61.1 | 24.1 | 28.6 | 37.2 |
| 2004 | 303.8 | 69.7 | 117.4 | 63.0 | 27.9 | 29.4 | 38.2 |
| 2005 | 326.2 | 86.2 | 128.7 | 64.0 | 30.6 | 30.6 | 39.5 |
| 2006 | 351.7 | 104.8 | 138.8 | 69.6 | 35.4 | 33.3 | 42.4 |
| 2007 | 378.5 | 123.4 | 147.6 | 73.5 | 40.6 | 35.2 | 44.2 |
| 2008 | 405.4 | 145.2 | 148.7 | 81.2 | 43.9 | 36.5 | 46.6 |
| 2009 | 404.2 | 184.1 | 137.3 | 82.7 | 45.8 | 36.4 | 49.6 |
| 2010 | 408.5 | 212.2 | 140.5 | 87.0 | 52.1 | 37.5 | 50.9 |
| 2011 | 427.1 | 246.5 | 148.4 | 95.8 | 58.4 | 38.8 | 53.6 |
| 2012 | 434.4 | 289.2 | 152.3 | 100.5 | 64.9 | 38.5 | 55.1 |
| 2013 | 455.1 | 323.4 | 164.7 | 102.9 | 68.2 | 41.5 | 58.4 |
| 2014 | 477.0 | 346.3 | 169.6 | 109.6 | 73.1 | 60.4 | 60.6 |
| 2015 | 507.4 | 366.1 | 168.5 | 114.1 | 76.9 | 63.0 | 60.5 |
| 2016 | 533.5 | 393.0 | 160.3 | 122.5 | 80.8 | 67.1 | 63.7 |
| 2017 | 565.7 | 420.8 | 166.6 | 133.7 | 90.3 | 70.8 | 65.6 |
| 2018 | 618.1 | 465.3 | 172.0 | 142.3 | 100.3 | 84.9 | 68.7 |
| 2019 | 677.9 | NA | 172.2 | 151.1 | 104.0 | 87.8 | 74.6 |
| 2020 | 730.3 | NA | 171.7 | 147.0 | 111.1 | 90.1 | 74.9 |
OECD = Organisation for Economic Co-operation and Development; PPP = purchasing power parity.
Note(s):
Data are for the top seven R&D-performing countries with R&D data reported by the OECD. Data are not available for all countries for all years. Historical data have been updated from previous publications to reflect recent suppression of China data dating back to 2019 and revision of United Kingdom data by the OECD. Data for the United Kingdom dating back to 2014 are provisional and may be revised. For more information, please visit source link.
Source(s):
OECD, Main Science and Technology Indicators, March 2023 release. Available at https://stats.oecd.org/Index.aspx?DataSetCode=MSTI_PUB.
In 2020, the United States exceeded $700 billion in gross domestic expenditures on research and development (R&D). Based on internationally comparable estimates of R&D performance, the United States totaled $730 billion in domestic R&D expenditures in 2020, up 8% from 2019 ($678 billion). Other top performers include Japan ($172 billion), Germany ($147 billion), South Korea ($111 billion), the United Kingdom ($90 billion), and France ($75 billion).
China, the second-highest performer of domestic R&D in recent years, totaled $465 billion in 2018, the most recent year with estimates reported by the Organisation for Economic Co-operation and Development (OECD). In the same year, the United States totaled $618 billion in R&D expenditures, and the third-highest performer, Japan, totaled $172 billion. The March 2023 OECD estimates of gross domestic expenditures on R&D differ from those used in previous products from the National Center for Science and Engineering Statistics because of updates of the OECD source data.
Note: The March 2023 edition of the OECD Main Science and Technology Indicators revises certain data series previously published in Science and Engineering Indicators. Estimates for the United Kingdom dating back to 2014 were revised upward and marked as provisional, and estimates for China dating back to 2019 have been suppressed. For more information, visit the OECD Main Science and Technology Indicators database and select the information icon for China or the United Kingdom. All estimates are in current dollars adjusted by purchasing power parity.
Suggested citation: Rhodes A; National Center for Science and Engineering Statistics (NCSES). 2023. United States Exceeds $700 Billion in Gross Domestic Expenditures on R&D in 2020. NSF 23-346. Alexandria, VA: National Science Foundation. Available at https://ncses.nsf.gov/pubs/nsf23346.
NSF 23-346
|June 22, 2023