 An official website of the United States government

R&D Expenditures at U.S. Universities Increased by $8 Billion in FY 2022
Research and development spending by academic institutions totaled $97.8 billion in FY 2022, an increase of $8.0 billion from FY 2021 (table 1). R&D expenditures funded by federal sources accounted for $4.9 billion of the total increase. Universities’ internally funded R&D expenditures (institution funds) were $2.1 billion greater than in FY 2021, while university R&D funded by businesses increased by $587 million. The increases from these funding sources were the largest annual increases on record in current dollars. R&D expenditures funded by nonprofit organizations and by state and local governments also increased in FY 2022 by $382 million and $167 million, respectively. R&D funded by all other sources declined $50 million from FY 2021, due in part to more accurate tracking and reporting of funding sources by institutions in the University of California system. The reported total funding from “all other sources” at these 11 institutions was $234 million less than in FY 2021.
Higher education R&D expenditures, by source of funds: FYs 2010–22
Note(s):
Because of rounding, detail may not add to total. Includes all institutions surveyed in the fiscal years shown.
Source(s):
National Center for Science and Engineering Statistics, Higher Education Research and Development Survey.
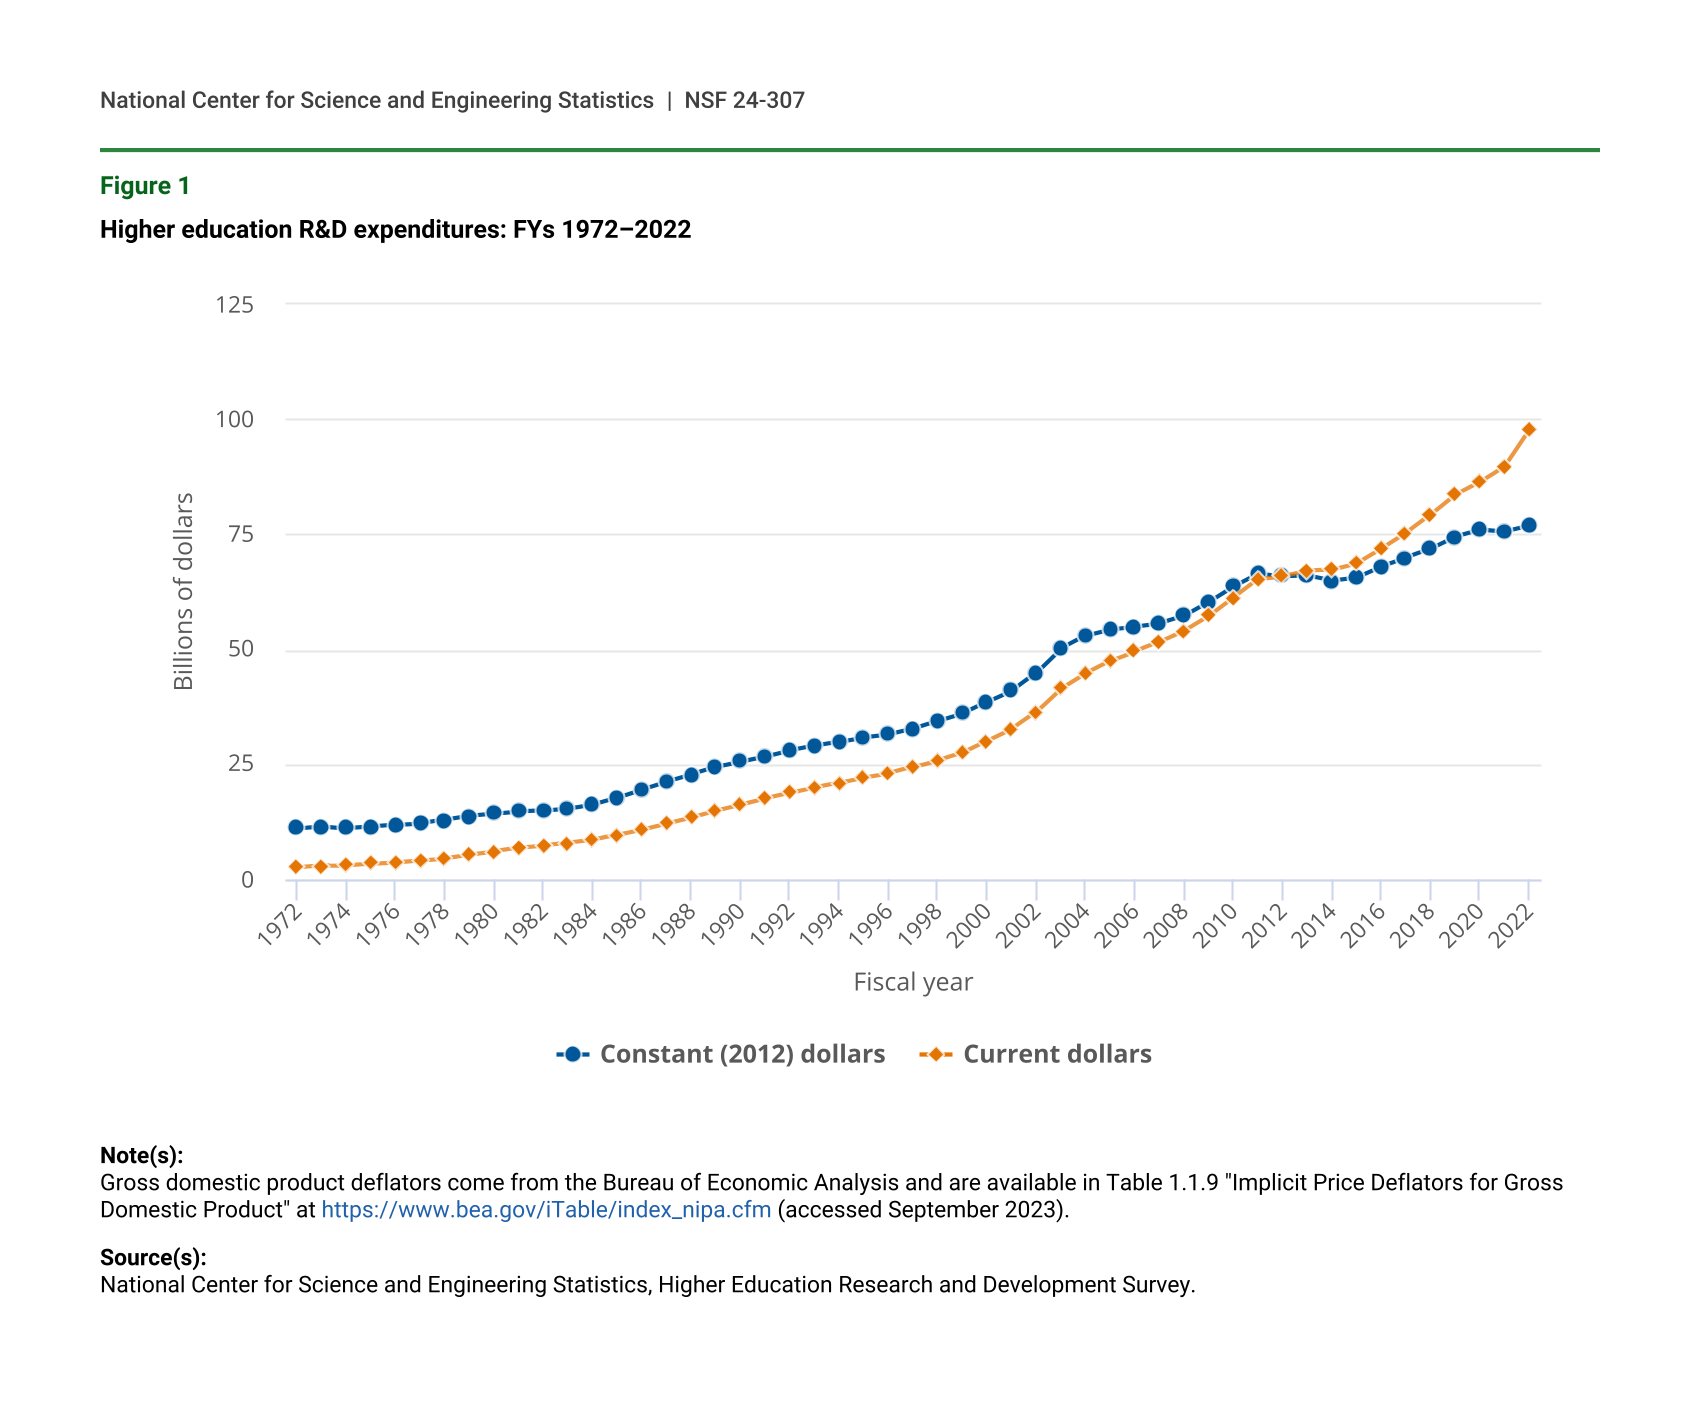
Higher education R&D since FY 2012 grew at an average annual rate of 4.0% in current dollars and 1.6% in constant dollars. Though, due to higher inflation, the difference between these percentages was largest during the FY 2020 to FY 2022 period as total R&D averaged 6.4% growth in current dollars but 0.6% growth in constant dollars (figure 1). The data discussed in this report are from the Higher Education Research and Development (HERD) Survey, sponsored by the National Center for Science and Engineering Statistics (NCSES) within the National Science Foundation. For more information on the survey, see “Data Sources, Limitations, and Availability.”
Higher education R&D expenditures: FYs 1972–2022
| Fiscal year | Constant (2012) dollars | Current dollars |
|---|---|---|
| 1972 | 11.1 | 2.6 |
| 1973 | 11.5 | 2.9 |
| 1974 | 11.1 | 3.0 |
| 1975 | 11.4 | 3.4 |
| 1976 | 11.8 | 3.7 |
| 1977 | 12.2 | 4.1 |
| 1978 | 12.9 | 4.6 |
| 1979 | 13.8 | 5.4 |
| 1980 | 14.3 | 6.1 |
| 1981 | 14.8 | 6.8 |
| 1982 | 14.9 | 7.3 |
| 1983 | 15.4 | 7.9 |
| 1984 | 16.3 | 8.6 |
| 1985 | 17.8 | 9.7 |
| 1986 | 19.6 | 10.9 |
| 1987 | 21.3 | 12.2 |
| 1988 | 22.8 | 13.5 |
| 1989 | 24.4 | 15.0 |
| 1990 | 25.6 | 16.3 |
| 1991 | 26.7 | 17.6 |
| 1992 | 28.0 | 18.8 |
| 1993 | 29.0 | 20.0 |
| 1994 | 29.9 | 21.0 |
| 1995 | 30.9 | 22.2 |
| 1996 | 31.5 | 23.1 |
| 1997 | 32.7 | 24.4 |
| 1998 | 34.4 | 25.9 |
| 1999 | 36.1 | 27.5 |
| 2000 | 38.6 | 30.1 |
| 2001 | 41.1 | 32.8 |
| 2002 | 44.9 | 36.4 |
| 2003 | 50.2 | 41.5 |
| 2004 | 52.9 | 44.8 |
| 2005 | 54.3 | 47.5 |
| 2006 | 55.0 | 49.6 |
| 2007 | 55.7 | 51.6 |
| 2008 | 57.3 | 54.1 |
| 2009 | 60.3 | 57.3 |
| 2010 | 63.7 | 61.3 |
| 2011 | 66.5 | 65.3 |
| 2012 | 65.9 | 65.9 |
| 2013 | 66.0 | 67.1 |
| 2014 | 64.9 | 67.3 |
| 2015 | 65.6 | 68.7 |
| 2016 | 68.0 | 71.9 |
| 2017 | 69.9 | 75.3 |
| 2018 | 71.8 | 79.2 |
| 2019 | 74.5 | 83.6 |
| 2020 | 76.0 | 86.4 |
| 2021 | 75.6 | 89.8 |
| 2022 | 76.9 | 97.8 |
Note(s):
Gross domestic product deflators come from the Bureau of Economic Analysis and are available in Table 1.1.9 "Implicit Price Deflators for Gross Domestic Product" at https://www.bea.gov/iTable/index_nipa.cfm (accessed September 2023).
Source(s):
National Center for Science and Engineering Statistics, Higher Education Research and Development Survey.
R&D Expenditures, by Source of Funding
Federally funded R&D at universities totaled almost $54 billion in FY 2022, which accounted for 55% of total expenditures (table 2). The Department of Health and Human Services (HHS), which includes the National Institutes of Health, supported the largest federal share of R&D at $30.3 billion. This amounted to 31% of total R&D at higher education institutions in FY 2022 and 56% of total federal R&D support. The Department of Defense (DOD) ($8.0 billion) and the National Science Foundation ($6.0 billion) accounted for most of the remaining federally funded expenditures, while three other agencies supported between $1.5 billion and $2.5 billion of university R&D in FY 2022: the Department of Energy (DOE) ($2.5 billion), the National Aeronautics and Space Administration (NASA) ($2.0 billion), and the Department of Agriculture (USDA) ($1.5 billion). All other federal agencies combined supported $3.6 billion of higher education R&D in FY 2022.
Higher education R&D expenditures, by source of funds: FY 2022
DOD = Department of Defense; DOE = Department of Energy; HHS = Department of Health and Human Services; NASA = National Aeronautics and Space Administration; NSF = National Science Foundation; USDA = Department of Agriculture.
Note(s):
Because of rounding, detail may not add to total. Other includes all other agencies reported. This table includes only institutions reporting $1 million or more in total R&D expenditures in FY 2021. Institutions reporting less than $1 million in total R&D expenditures in FY 2021 completed a shorter version of the survey form in FY 2022 that did not include the question on specific agency funding sources. Total expenditures from institutions reporting less than $1 million in R&D in FY 2022 was $162 million.
Source(s):
National Center for Science and Engineering Statistics, Higher Education Research and Development Survey.
Universities’ own funding ($24.5 billion) accounted for 25% of total R&D in FY 2022, which is similar to the percentage reported since 2016 (table 1). R&D expenditures funded by nonprofit organizations ($6.0 billion) and businesses ($5.7 billion) each supported around 6% of total R&D. State and local governments funded 5% or $4.9 billion, while all other sources funded 2.7% ($2.6 billion) of higher education R&D.
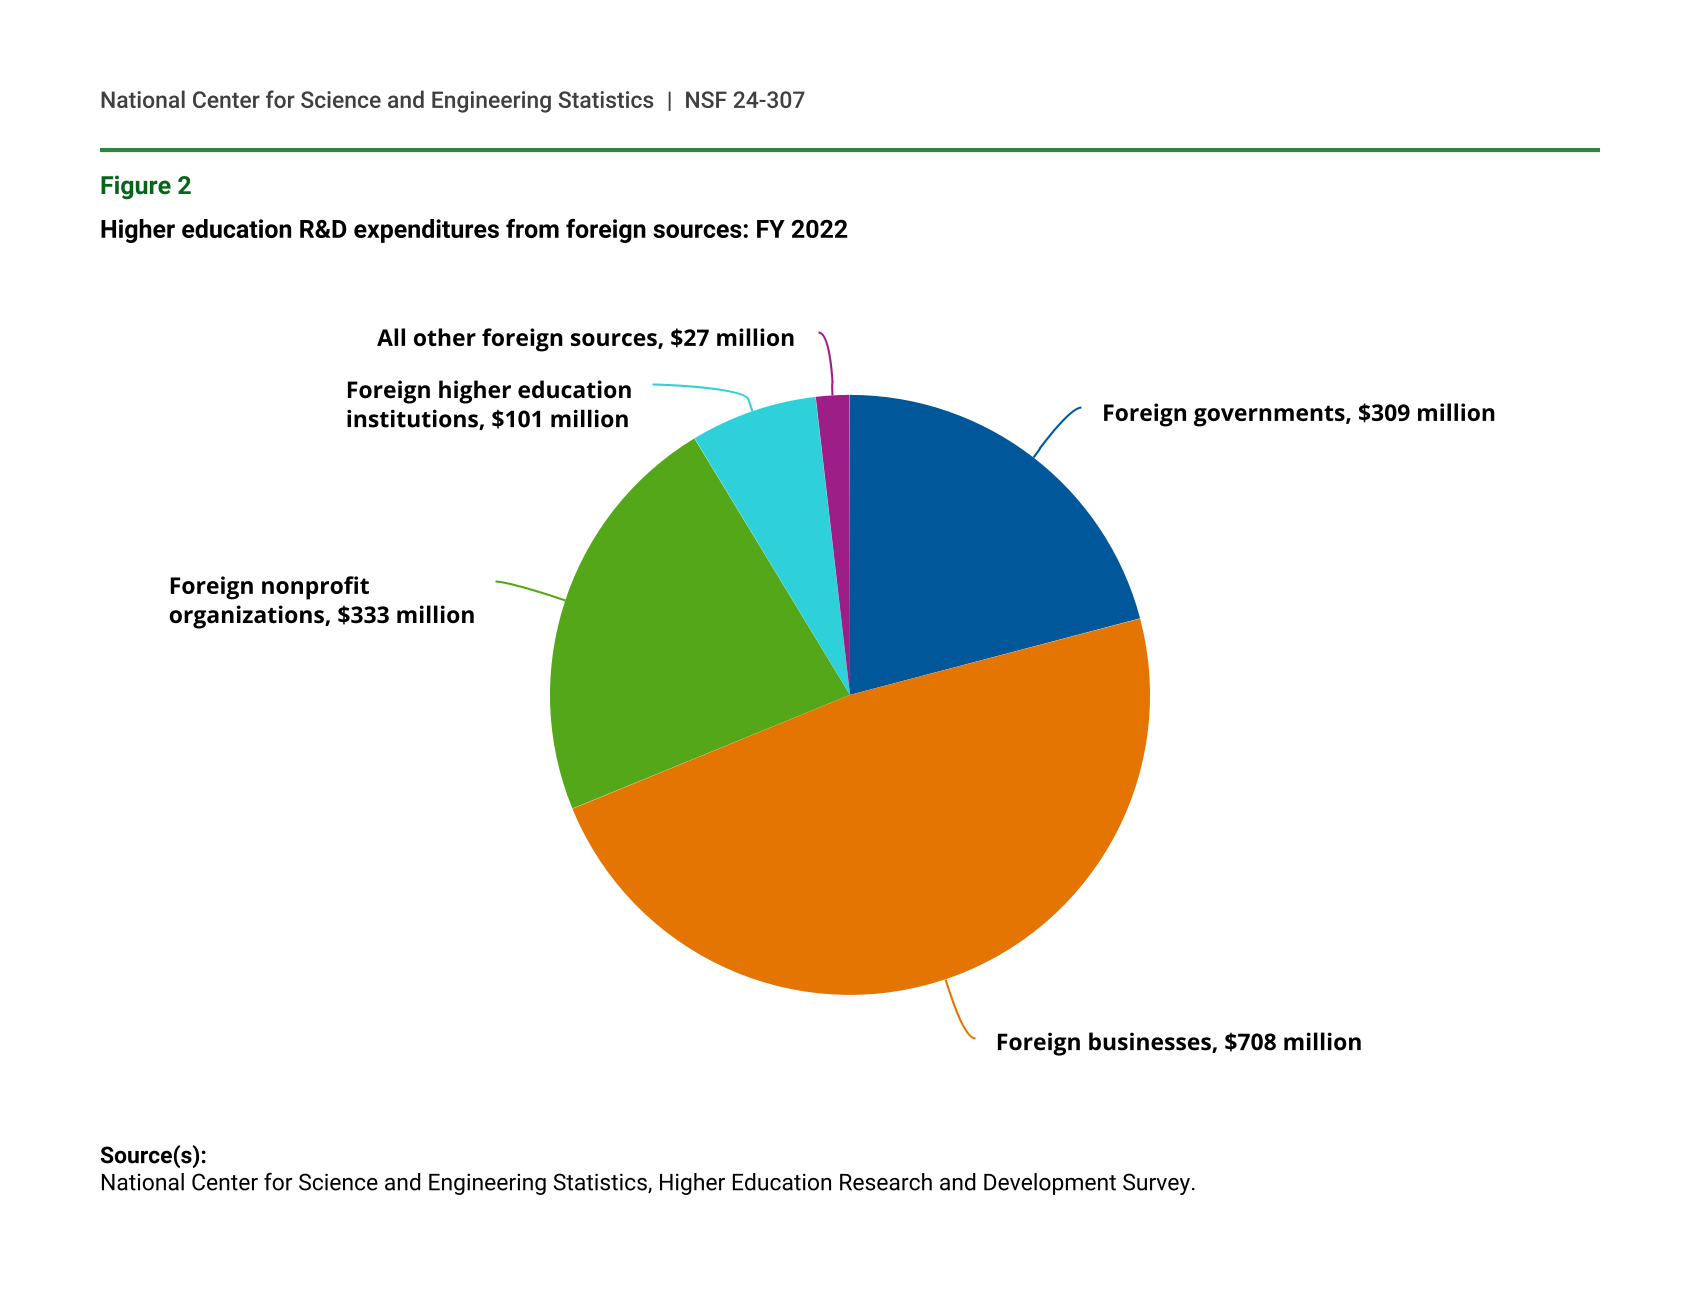
Foreign sources of R&D funding are also collected in the HERD Survey. About $1.5 billion in foreign funds supported R&D at higher education institutions in FY 2022 (figure 2). Almost half of the foreign-funded expenditures (48%) originated from foreign businesses, while 23% were funded by foreign nonprofits and 21% were funded by foreign governments. Foreign higher education institutions (7%) and all other sources (2%) accounted for the rest of university foreign-funded R&D in FY 2022. Virtually all of the foreign-funded R&D was performed by doctorate-awarding institutions. Private institutions ($766 million or 52% of the total) expended about $50 million more of the foreign-funded R&D dollars than public institutions ($714 million or 48% of the total).
Higher education R&D expenditures from foreign sources: FY 2022
| Source of foreign funds | R&D expenditures (current $millions) |
|---|---|
| Foreign governments | 309 |
| Foreign businesses | 708 |
| Foreign nonprofit organizations | 333 |
| Foreign higher education institutions | 101 |
| All other foreign sources | 27 |
Source(s):
National Center for Science and Engineering Statistics, Higher Education Research and Development Survey.
R&D Expenditures, by Field
R&D expenditures in all science fields combined increased by $5.9 billion (8.4%) in FY 2022, reaching $76.2 billion (table 3). Engineering R&D expenditures ($15.6 billion total) increased by 9.1% ($1.3 billion) and non-science and engineering R&D ($5.9 billion total) increased by 14.5% ($744 million). R&D expenditures in two life sciences subfields, health sciences ($31.9 billion total, $2.0 billion increase) and biological and biomedical sciences ($18.2 billion total, $1.6 billion increase), showed the largest dollar increases, accounting for 45% of the total university R&D growth in FY 2022.
Higher education R&D expenditures, by R&D field: FYs 2021–22
nec = not elsewhere classified; S&E = science and engineering.
Note(s):
This table includes only institutions reporting $1 million or more in total R&D expenditures in FY 2021. Institutions reporting less than $1 million in total R&D expenditures in FY 2021 completed a shorter version of the survey form in FY 2022 that did not include this question. Total expenditures from institutions reporting less than $1 million in R&D in FY 2022 was $162 million. Gross domestic product deflators come from the Bureau of Economic Analysis and are available in Table 1.1.9 "Implicit Price Deflators for Gross Domestic Product" at https://www.bea.gov/iTable/index_nipa.cfm (accessed September 2023).
Source(s):
National Center for Science and Engineering Statistics, Higher Education Research and Development Survey.
When adjusted for inflation, total university R&D increased by 1.8% in FY 2022. Several R&D subfields declined in inflation-adjusted dollars from FY 2021. Health sciences, which is the largest R&D field, was down 0.2%. Other fields with lower inflation-adjusted R&D expenditures in FY 2022 include materials science (down 6.5%), metallurgical and materials engineering (down 1.5%), and chemistry (down 0.4%). R&D fields “not elsewhere classified” within engineering, social sciences, and life sciences respectively declined between 1.2% and 3.8% in inflation-adjusted terms.
R&D Expenditures, by Type of Cost
Of the $97.7 billion in total FY 2022 R&D expenditures, higher education institutions identified $75.4 billion in direct costs and $22.3 billion in indirect costs (table 4). Salaries, wages, and fringe benefits paid to R&D personnel ($43.1 billion) accounted for the largest portion of direct costs. Other direct costs, including (but not limited to) travel, tuition, waivers, computer usage fees, supplies, and services, such as consulting, amounted to over $20.9 billion. Institutions also passed R&D funding totaling $8.5 billion to other universities ($4.7 billion) or other organizations excluding contractors or other vendors ($3.8 billion) as part of their FY 2022 direct costs. Among indirect costs, $16.1 billion of facilities and administrative costs were reimbursed from external R&D sponsors. Another $6.2 billion was identified as unrecovered indirect costs.,
Higher education R&D expenditures, by type of cost: FY 2022
Note(s):
This table includes only institutions reporting $1 million or more in total R&D expenditures in FY 2021. Institutions reporting less than $1 million in total R&D expenditures in FY 2021 completed a shorter version of the survey form in FY 2022 that did not include this question. Total expenditures from institutions reporting less than $1 million in R&D in FY 2022 was $162 million.
Source(s):
National Center for Science and Engineering Statistics, Higher Education Research and Development Survey.
Top University Research Performers
The top 30 institutions in terms of R&D expenditures accounted for 42% of the total spent on R&D within the higher education sector in FY 2022, which is consistent with the preceding years (table 5). Twenty-nine institutions reported at least $1 billion in R&D expenditures in FY 2022, compared with 21 institutions in FY 2020. Sixteen of the top 30 institutions were public, accounting for $21.8 billion in total R&D expenditures; 14 were private, accounting for $19.5 billion. Institutions with medical schools were well-represented in the top 30, with 27 reporting medical school R&D expenditures.
Thirty institutions reporting the largest FY 2022 R&D expenditures in all fields: FYs 2020–22
a Johns Hopkins University includes the Applied Physics Laboratory, with $2,056 million in total R&D expenditures in FY 2022.
b University of Maryland includes expenditures from University of Maryland, Baltimore and University of Maryland, College Park campuses. In FY 2019, the two campuses began reporting as one research unit to reflect their new strategic partnership. This relationship was codified through the University of Maryland Strategic Partnership Act passed by the Maryland General Assembly in 2016. Prior to 2019, both campuses reported to the Higher Education Research and Development Survey as separate institutions.
Note(s):
Because of rounding, detail may not add to total. Rankings are based on unrounded totals. This table reflects the leading 30 institutions for FY 2022; the institutions listed may not be in the top 30 of prior fiscal years.
Source(s):
National Center for Science and Engineering Statistics, Higher Education Research and Development Survey.
The same institutions were ranked in the top 30 in FY 2021 and FY 2022. Only three institutions changed more than 3 positions: New York University moved up 8 positions to number 15, Yale University moved down 6 positions to number 21, and Texas A&M University, College Station and Health Science Center moved from number 16 in FY 2021 to number 23 in FY 2022.
Data Sources, Limitations, and Availability
The higher education R&D expenditures data were collected from a census of 900 universities and colleges that grant a bachelor’s degree or higher and expended at least $150,000 in R&D in FY 2021. To reduce respondent burden, the HERD Survey requests abbreviated data (short form) from institutions reporting less than $1 million in R&D expenditures during the previous fiscal year. Except for the totals reported in table 1 and figure 1, all other totals shown in this report exclude expenditures from the 263 institutions that completed the short-form version of the survey. The institutions completing the short-form survey accounted for $162 million (0.2%) of total higher education R&D expenditures in FY 2022.
The fiscal year referred to throughout this report is the academic fiscal year. For most academic institutions, FY 2022 represents 1 July 2021 through 30 June 2022.
The amounts reported include all funds expended for activities specifically organized to produce research outcomes and either sponsored by an outside organization or separately accounted for using institution funds. R&D expenditures at university-administered federally funded research and development centers (FFRDCs) are collected in a separate survey, the FFRDC Research and Development Survey, available at https://ncses.nsf.gov/surveys/ffrdc-research-development/.
The full set of data tables and technical information from this survey are available at https://ncses.nsf.gov/surveys/higher-education-research-development/2022#data.
Notes
1Dollars adjusted for inflation (i.e., constant dollars) are based on the gross domestic product (GDP) implicit price deflator, currently in 2012 dollars, as published by the Bureau of Economic Analysis (BEA) at https://www.bea.gov/iTable/index_nipa.cfm, accessed on 1 September 2023. Note that GDP deflators are calculated on an economy-wide scale and do not explicitly focus on R&D.
2For more details on R&D expenditures funded by foreign sources, see table 15 at https://ncses.nsf.gov/surveys/higher-education-research-development/2022#data.
3See endnote 1 for constant dollar details.
4For more details on R&D expenditures passed through to subrecipients, see tables 4, 74–77, and 85 in the survey’s FY 2022 detailed data tables.
5For more information on the definitions and collection of these fields, see the HERD questionnaire and technical notes at https://ncses.nsf.gov/surveys/higher-education-research-development/2022#methodology.
6Unrecovered indirect cost means the difference between the amount charged to a federal award and the amount that could have been charged to a federal award under a nonfederal entity's approved negotiated indirect cost rate.
7For more details on R&D expenditures at institutions with medical schools, see table 72 in the survey’s FY 2022 detailed data tables.
Suggested Citation
Gibbons, MT; National Center for Science and Engineering Statistics (NCSES). 2023. R&D Expenditures at U.S. Universities Increased by $8 Billion in FY 2022. NSF 24-307. Alexandria, VA: National Science Foundation. Available at https://ncses.nsf.gov/pubs/nsf24307.
Contact Us
NCSES
National Center for Science and Engineering Statistics
Directorate for Social, Behavioral and Economic Sciences
National Science Foundation
2415 Eisenhower Avenue, Suite W14200
Alexandria, VA 22314
Tel: (703) 292-8780
FIRS: (800) 877-8339
TDD: (800) 281-8749
E-mail: ncsesweb@nsf.gov
NSF 24-307
|November 30, 2023