 An official website of the United States government

U.S. R&D Increased by $72 Billion in 2021 to $789 Billion; Estimate for 2022 Indicates Further Increase to $886 Billion
New data from the National Center for Science and Engineering Statistics (NCSES) within the National Science Foundation indicate that research and experimental development (R&D) performed in the United States totaled $789.1 billion in 2021 (table 1). The estimated total for 2022, based on performer-reported expectations, is $885.6 billion. Businesses reported a projected $84.1 billion increase in 2022 R&D performance above 2021. (All amounts and calculations are reported in current dollars unless otherwise noted.) Using previous NCSES data, researchers have documented a shift in corporate R&D away from research (basic and applied research combined), and noted the relevance of this shift to “policy discussions on the apparent decline in inventiveness and the associated slowdown in productivity growth.” In 2021, businesses funded $130 billion in research, which represented 22% of total business funding for R&D but 49% of total U.S. funding for research. Businesses performed $609 billion of R&D or 77% of total 2021 U.S. R&D.
The U.S. R&D system consists of the activities of a diverse group of R&D performers and sources of funding. Included here are private businesses, the federal government, nonfederal governments, higher education institutions, and other nonprofit organizations. The organizations that perform R&D often receive significant levels of outside funding, and organizations that fund R&D may also themselves be performers. The data for this InfoBrief derive mainly from NCSES surveys of the annual R&D expenditures of these performers and funders.
U.S. R&D expenditures, by performing sector and source of funding: 2010–22
FFRDC = federally funded research and development center.
a Some data for 2021 are preliminary and may later be revised.
b The data for 2022 include estimates and are likely to later be revised.
c Federal intramural includes expenditures of federal intramural R&D as well as costs associated with administering extramural R&D.
Note(s):
Data are based on annual reports by performers, except for the nonprofit sector. Expenditure levels for higher education, federal government, and nonfederal government performers are calendar year approximations based on fiscal year data.
Source(s):
National Center for Science and Engineering Statistics, National Patterns of R&D Resources (annual series).
The “Data Sources, Limitations, and Availability” section at the end of this InfoBrief summarizes the main data sources and methodology and provides further details on the data. Data cited in this report that do not appear in one of this InfoBrief’s tables or figures come from the companion data tables.
Preliminary 2022 Estimates and Current Trends in U.S. R&D Totals and National R&D Intensity
U.S. Total R&D
Year-over-year increases in U.S. total R&D expenditures averaged $19.1 billion (4.1% compound average growth rate [CAGR]) over the 2011–16 period. Beginning with the $50.4 billion increase in 2017–18, subsequent annual increases have been notable including $61.5 billion (2018–19), $51.3 billion (2019–20), and $72.2 billion (2020–21) averaging an 8.6% rate for 2016–21. For 2022, business R&D and total R&D performance are estimated to increase by $84.1 billion and $96.5 billion, respectively.
Annual change in U.S. R&D expenditures and gross domestic product, by performing sectors, 1990–2022
NA = not available.
FFRDCs = federally funded research and development centers
a Some data for 2021 are preliminary and may later be revised.
b The R&D data for 2022 include estimates and are likely to later be revised.
c Survey data on state internal R&D performance were not available prior to 2006; data for 2008 were not collected.
Note(s):
The longer term trend rates are calculated as compound annual growth rates.
Source(s):
National Center for Science and Engineering Statistics, National Patterns of R&D Resources (annual series).
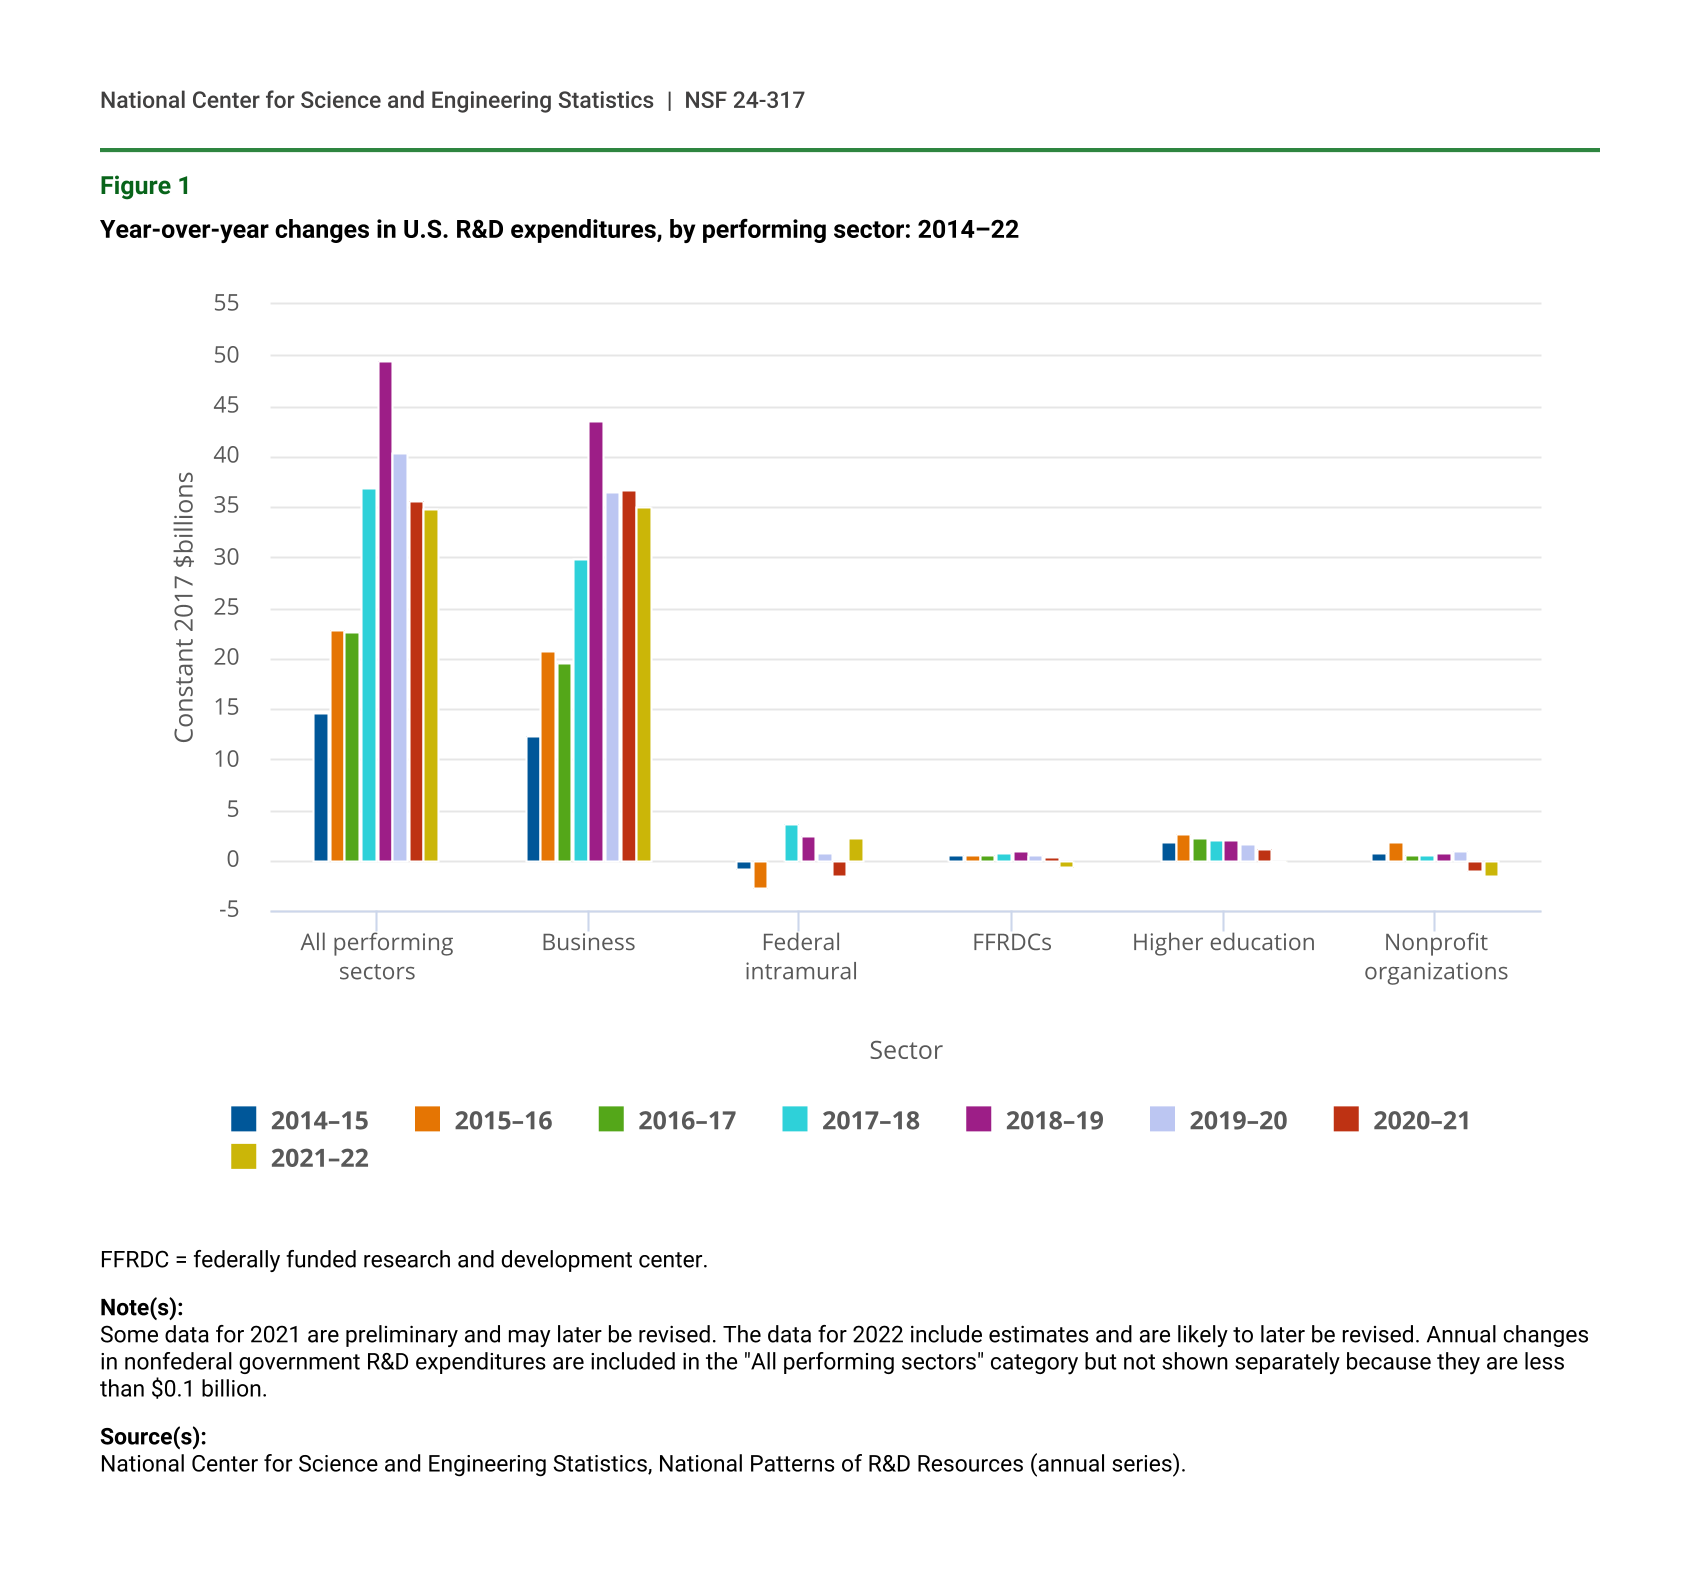
Adjusting for inflation, growth in U.S. total R&D averaged 4.4% annually over the 2011–21 period. By comparison, average annual growth of U.S. total R&D in the prior decade (2001–11) was lower at 2.2%. The estimate for 2022 shows inflation-adjusted R&D growing at 4.8% from the 2021 level. Comparisons in constant dollars demonstrate the effect of the recent inflationary episode on real R&D performance. In constant dollar terms, business R&D performance is estimated to increase by $35.0 billion over the 2021 level. Federal intramural R&D decreased in 2021 from the prior year total, but the estimated increase in 2022 (based on FY 2022 obligations and FY 2023 projections for federal intramural R&D), offsets the 2021 decline. For federally funded research and development centers (FFRDCs), nonfederal governments, and universities, the constant value of R&D performance is estimated to decline in 2022 (table 2, figure 1). For nonprofit organizations, the change in 2022 R&D is not statistically significant.
Year-over-year changes in U.S. R&D expenditures, by performing sector: 2014–22
| Sector | 2014–15 | 2015–16 | 2016–17 | 2017–18 | 2018–19 | 2019–20 | 2020–21 | 2021–22 |
|---|---|---|---|---|---|---|---|---|
| All performing sectors | 14.505 | 22.919 | 22.585 | 36.888 | 49.411 | 40.352 | 35.691 | 34.696 |
| Business | 12.260 | 20.691 | 19.466 | 29.792 | 43.394 | 36.501 | 36.747 | 34.982 |
| Federal intramural | -0.933 | -2.811 | -0.100 | 3.738 | 2.364 | 0.788 | -1.500 | 2.185 |
| FFRDCs | 0.595 | 0.609 | 0.549 | 0.758 | 0.968 | 0.599 | 0.328 | -0.616 |
| Higher education | 1.755 | 2.605 | 2.124 | 2.097 | 1.933 | 1.550 | 1.142 | -0.319 |
| Nonprofit organizations | 0.821 | 1.805 | 0.544 | 0.505 | 0.731 | 0.914 | -1.001 | -1.505 |
FFRDC = federally funded research and development center.
Note(s):
Some data for 2021 are preliminary and may later be revised. The data for 2022 include estimates and are likely to later be revised. Annual changes in nonfederal government R&D expenditures are included in the "All performing sectors" category but not shown separately because they are less than $0.1 billion.
Source(s):
National Center for Science and Engineering Statistics, National Patterns of R&D Resources (annual series).
R&D-to-GDP Ratio
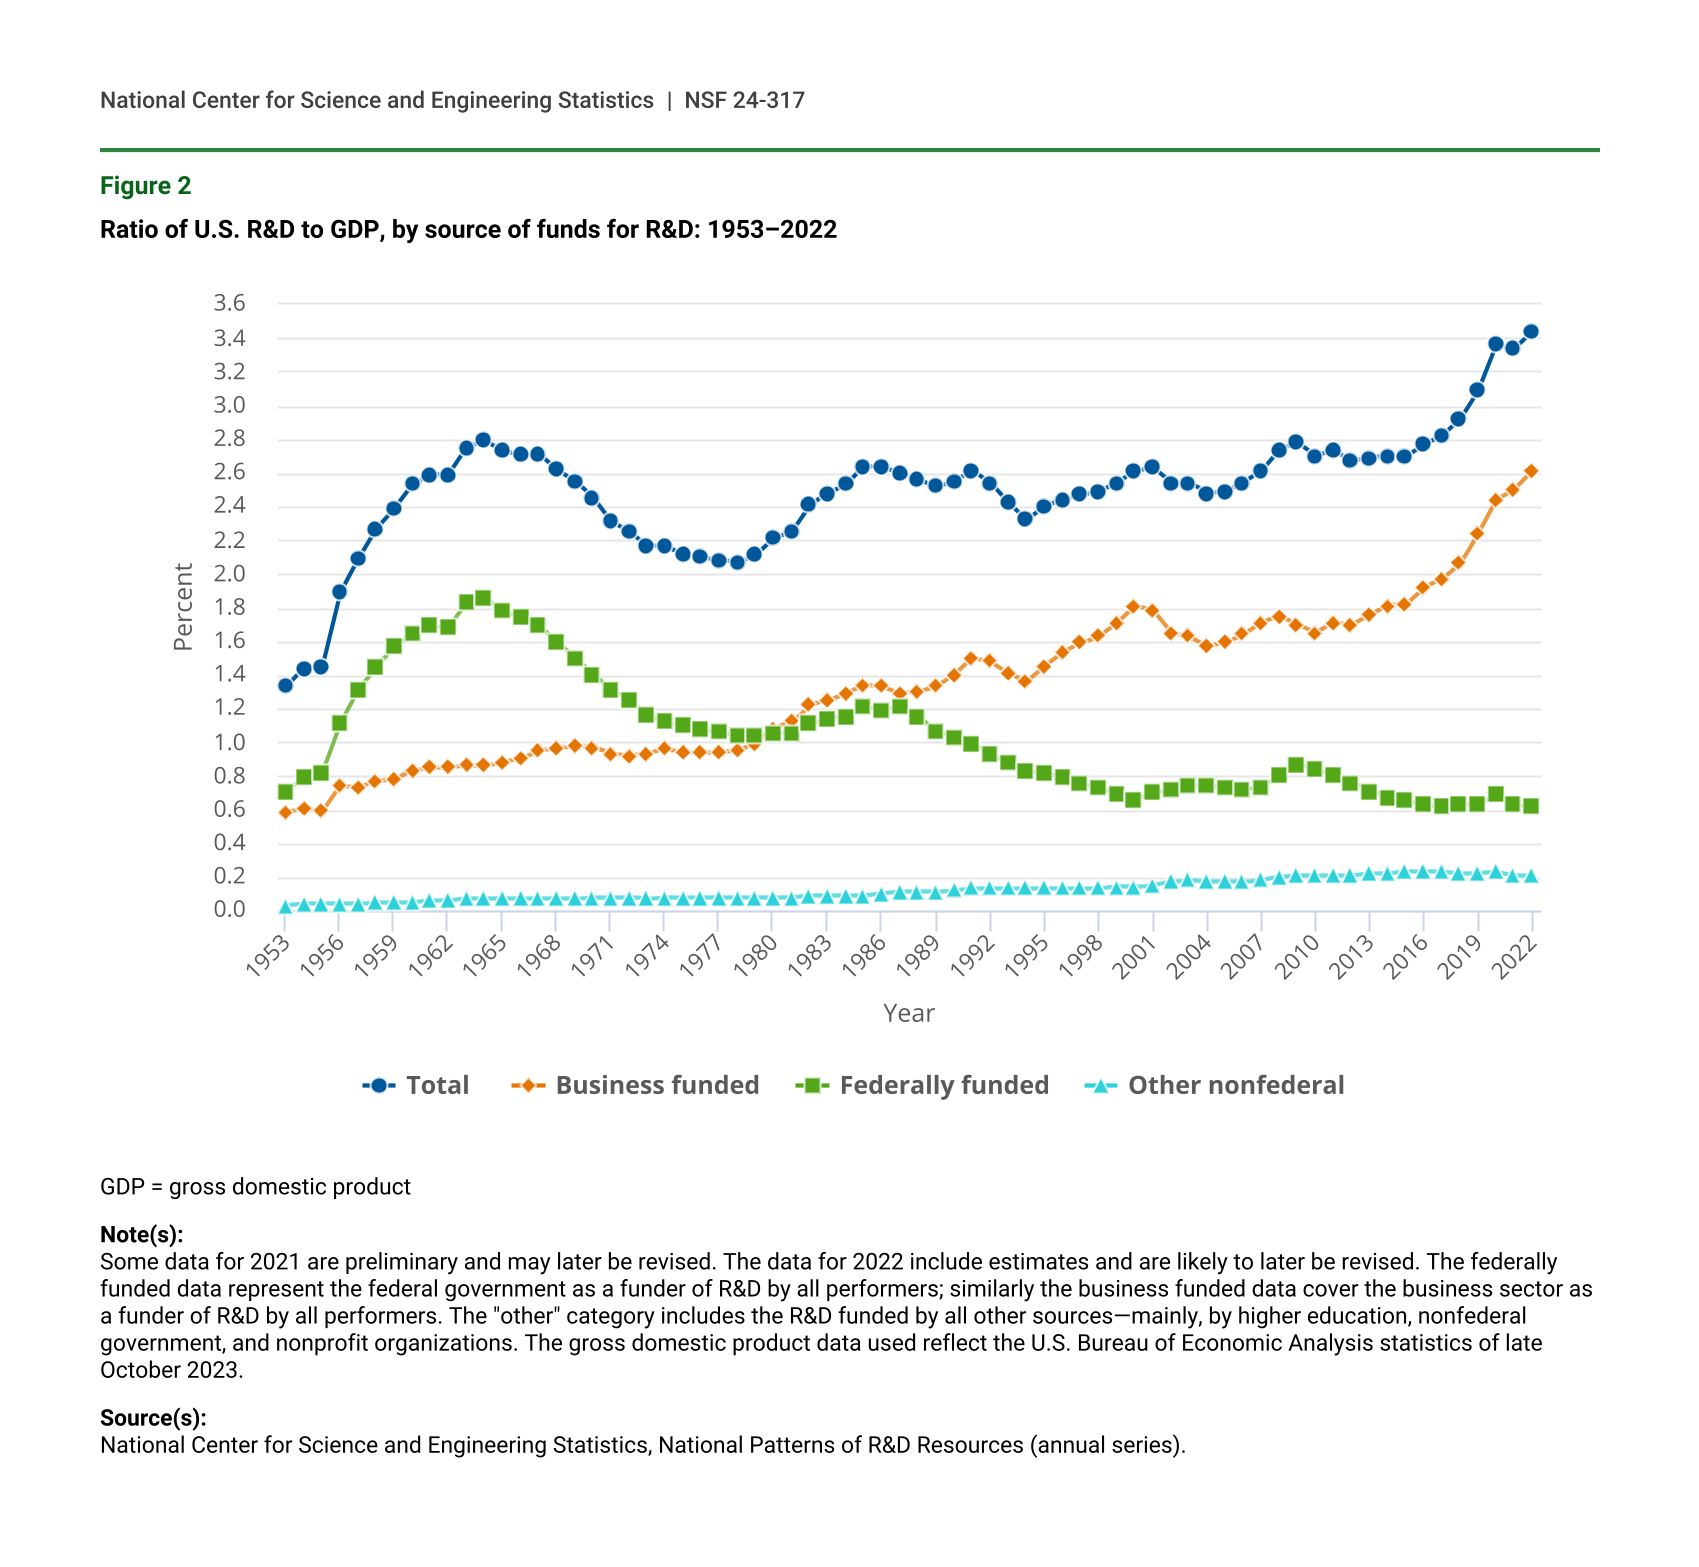
The ratio of total national R&D expenditures to gross domestic product (GDP) (i.e., R&D intensity) is widely used by national statistical offices and other policy analysts as an overall gauge of the relative priority of a nation’s R&D effort among multiple investment and consumption options. In this edition of the National Patterns series, the ratio of U.S. R&D to GDP was 3.34% in 2021 and is estimated to be 3.44% in 2022 (figure 2). Prior to 2019 when R&D intensity reached 3.09%, the highest U.S. ratios recorded were 2.79% in 1964, 2.78% in 2009, 2.77% again in 2016, 2.82% in 2017, and 2.92% in 2018. Reaching an R&D intensity level above 3.0% is widely regarded in the R&D policy community as a notable national achievement. The U.S. 2021 R&D to GDP ratio exceeded the Organisation for Economic Co-operation and Development average (2.72%). The U.S. ratio also exceeded that of other key R&D-performing nations, such as China (2.43%), France (2.22%), and the United Kingdom (2.91% [provisional]). Israel (5.56%) and South Korea (4.93%) had higher ratios than the United States, whereas Germany (3.13%) and Japan (3.30%) had similar ratios to the United States.
Ratio of U.S. R&D to GDP, by source of funds for R&D: 1953–2022
| Year | Total | Business funded | Federally funded | Other nonfederal |
|---|---|---|---|---|
| 1953 | 1.33 | 0.58 | 0.71 | 0.03 |
| 1954 | 1.44 | 0.61 | 0.79 | 0.04 |
| 1955 | 1.45 | 0.59 | 0.82 | 0.04 |
| 1956 | 1.89 | 0.74 | 1.11 | 0.04 |
| 1957 | 2.09 | 0.73 | 1.31 | 0.04 |
| 1958 | 2.27 | 0.77 | 1.45 | 0.05 |
| 1959 | 2.39 | 0.78 | 1.57 | 0.05 |
| 1960 | 2.53 | 0.83 | 1.64 | 0.05 |
| 1961 | 2.59 | 0.85 | 1.69 | 0.06 |
| 1962 | 2.59 | 0.85 | 1.68 | 0.06 |
| 1963 | 2.75 | 0.86 | 1.83 | 0.07 |
| 1964 | 2.79 | 0.86 | 1.86 | 0.07 |
| 1965 | 2.73 | 0.88 | 1.78 | 0.07 |
| 1966 | 2.71 | 0.90 | 1.74 | 0.07 |
| 1967 | 2.71 | 0.95 | 1.69 | 0.07 |
| 1968 | 2.62 | 0.96 | 1.59 | 0.07 |
| 1969 | 2.55 | 0.98 | 1.50 | 0.07 |
| 1970 | 2.45 | 0.97 | 1.40 | 0.08 |
| 1971 | 2.31 | 0.93 | 1.31 | 0.08 |
| 1972 | 2.25 | 0.92 | 1.25 | 0.08 |
| 1973 | 2.17 | 0.93 | 1.16 | 0.07 |
| 1974 | 2.16 | 0.96 | 1.12 | 0.08 |
| 1975 | 2.12 | 0.94 | 1.10 | 0.08 |
| 1976 | 2.10 | 0.94 | 1.08 | 0.08 |
| 1977 | 2.08 | 0.94 | 1.06 | 0.08 |
| 1978 | 2.07 | 0.95 | 1.04 | 0.08 |
| 1979 | 2.11 | 0.99 | 1.04 | 0.08 |
| 1980 | 2.21 | 1.08 | 1.05 | 0.08 |
| 1981 | 2.25 | 1.12 | 1.05 | 0.08 |
| 1982 | 2.41 | 1.22 | 1.11 | 0.09 |
| 1983 | 2.48 | 1.25 | 1.14 | 0.09 |
| 1984 | 2.53 | 1.29 | 1.15 | 0.09 |
| 1985 | 2.64 | 1.34 | 1.21 | 0.09 |
| 1986 | 2.63 | 1.33 | 1.19 | 0.10 |
| 1987 | 2.60 | 1.29 | 1.21 | 0.11 |
| 1988 | 2.56 | 1.30 | 1.15 | 0.11 |
| 1989 | 2.52 | 1.33 | 1.07 | 0.11 |
| 1990 | 2.55 | 1.40 | 1.03 | 0.12 |
| 1991 | 2.61 | 1.50 | 0.99 | 0.13 |
| 1992 | 2.54 | 1.48 | 0.93 | 0.13 |
| 1993 | 2.42 | 1.41 | 0.88 | 0.13 |
| 1994 | 2.32 | 1.36 | 0.83 | 0.13 |
| 1995 | 2.40 | 1.45 | 0.82 | 0.13 |
| 1996 | 2.44 | 1.53 | 0.79 | 0.13 |
| 1997 | 2.47 | 1.59 | 0.75 | 0.13 |
| 1998 | 2.49 | 1.63 | 0.73 | 0.13 |
| 1999 | 2.54 | 1.71 | 0.69 | 0.14 |
| 2000 | 2.61 | 1.81 | 0.66 | 0.14 |
| 2001 | 2.63 | 1.78 | 0.70 | 0.15 |
| 2002 | 2.54 | 1.65 | 0.72 | 0.17 |
| 2003 | 2.54 | 1.63 | 0.74 | 0.18 |
| 2004 | 2.48 | 1.57 | 0.74 | 0.17 |
| 2005 | 2.49 | 1.59 | 0.73 | 0.17 |
| 2006 | 2.54 | 1.64 | 0.72 | 0.17 |
| 2007 | 2.61 | 1.71 | 0.73 | 0.18 |
| 2008 | 2.74 | 1.75 | 0.80 | 0.20 |
| 2009 | 2.78 | 1.70 | 0.87 | 0.21 |
| 2010 | 2.70 | 1.65 | 0.84 | 0.21 |
| 2011 | 2.73 | 1.71 | 0.81 | 0.21 |
| 2012 | 2.67 | 1.70 | 0.76 | 0.21 |
| 2013 | 2.69 | 1.76 | 0.71 | 0.22 |
| 2014 | 2.70 | 1.81 | 0.67 | 0.22 |
| 2015 | 2.70 | 1.82 | 0.65 | 0.23 |
| 2016 | 2.77 | 1.92 | 0.63 | 0.23 |
| 2017 | 2.82 | 1.97 | 0.62 | 0.23 |
| 2018 | 2.92 | 2.06 | 0.63 | 0.22 |
| 2019 | 3.09 | 2.24 | 0.63 | 0.22 |
| 2020 | 3.36 | 2.44 | 0.69 | 0.23 |
| 2021 | 3.34 | 2.50 | 0.63 | 0.21 |
| 2022 | 3.44 | 2.61 | 0.62 | 0.21 |
GDP = gross domestic product
Note(s):
Some data for 2021 are preliminary and may later be revised. The data for 2022 include estimates and are likely to later be revised. The federally funded data represent the federal government as a funder of R&D by all performers; similarly the business funded data cover the business sector as a funder of R&D by all performers. The "other" category includes the R&D funded by all other sources—mainly, by higher education, nonfederal government, and nonprofit organizations. The gross domestic product data used reflect the U.S. Bureau of Economic Analysis statistics of late October 2023.
Source(s):
National Center for Science and Engineering Statistics, National Patterns of R&D Resources (annual series).
The extent to which the rising ratio of U.S. R&D to GDP is attributable to increased business funding of R&D is clear. Over the past decade (2011–21), business funding grew at an 8.3% rate while federal funding grew at a 1.5% rate and GDP grew at a 4.2% rate. Notably, the higher education sector’s funding of R&D grew at 6.1% over the same period.
Federally funded R&D as a percentage of GDP peaked in the 1960s at 1.86% in 1964 and generally has declined since. Since 2014, federal funding for R&D has remained at or below 0.70% of GDP. By contrast, business R&D funding in 2010 was 1.65% of GDP and increased to 2.50% by 2021.
Performers of R&D
Business
The business sector is by far the largest performer of U.S. R&D. In 2021, domestically performed business R&D accounted for $608.6 billion, or 77% of the $789.1 billion national R&D total (table 1 and table 3). The business sector’s predominance in national R&D performance has long been the case, with its annual share ranging between 69% and 77% since 2000.
Sales, R&D, R&D intensity, and employment for companies that performed or funded business R&D in the United States, by selected industry and company size: 2021
NAICS = North American Industry Classification System.
a Dollar values are for goods sold or services rendered by R&D-performing or R&D-funding companies located in the United States to customers outside of the company, including the U.S. federal government, foreign customers, and the company's foreign subsidiaries. Included are revenues from a company’s foreign operations and subsidiaries and from discontinued operations. If a respondent company is owned by a foreign parent company, sales to the parent company and to affiliates not owned by the respondent company are included. Excluded are intracompany transfers, returns, allowances, freight charges, and excise, sales, and other revenue-based taxes.
b All R&D is the cost of R&D paid for and performed by the respondent company and paid for by others outside of the company and performed by the respondent company.
c R&D intensity is the cost of domestic R&D paid for by the respondent company and others outside of the company and performed by the company divided by domestic net sales of companies that performed or funded R&D.
d Data recorded on 12 March represent employment figures for the year. Total employment at companies that performed or funded R&D.
e Headcounts of researchers, R&D managers, technicians, clerical staff, and others assigned to R&D groups.
f Only selected (NAICS 42, 51, 5413, 5415, 5417) nonmanufacturing sectors are sampled for the 1–9 employee population in the Annual Business Survey. Based on prior survey results, businesses with 1–9 employees in other nonmanufacturing subsectors are not believed to perform substantial amounts of R&D.
Note(s):
Detail may not add to total because of rounding. Industry classification was based on the dominant business code for domestic R&D performance, where available. For companies that did not report business codes, the classification used for sampling was assigned.
Source(s):
National Center for Science and Engineering Statistics and Census Bureau, Annual Business Survey, Business Enterprise Research and Development Survey, 2021.
R&D performed in the United States by businesses occurs widely in manufacturing and nonmanufacturing. In 2021, manufacturing companies of all sizes (1 employee to more than 25,000 employees) performed 53.7% of all business R&D (table 3). By contrast, microbusinesses (1–9 employees) in manufacturing industries account for just 12.2% of R&D performed by companies with fewer than 10 employees. The R&D sales intensity (42.5%) and R&D employment intensity (62.8%) are both greater for microbusinesses than for other businesses. Information (NAICS 51), including software publishing (5112), Computer systems design and related services (NAICS 5415), and scientific research and development services (NAICS 5417) account for 73.5% of nonmanufacturing industry R&D.
U.S. R&D expenditures, by performing sector, source of funds, and type of R&D: 2021
* = amount < $0.5 million; ** = small to negligible amount, included as part of the funding provided by nonprofit organizations.
FFRDC = federally funded research and development center.
Note(s):
Some data for 2021 are preliminary and may later be revised.
Source(s):
National Center for Science and Engineering Statistics, National Patterns of R&D Resources (annual series).
Higher Education
R&D performed in the United States by the higher education sector totaled $85.8 billion in 2021, or 11% of U.S. total R&D (table 1 and table 4). In the period 2000–21, the higher education share of U.S. total R&D ranged between 11% and 14%.
Adjusted for inflation, growth in this sector’s R&D performance averaged 1.7% annually during 2011–21, well behind U.S. total R&D growth (4.4%). For the preceding decade, growth in higher education R&D performance was a robust 4.1%. The annual percent change in 2010–20 varied; there was low growth or contraction in 2010–14 with a return to modest increases in 2015–20. The estimate for 2022 indicates a slight contraction (-0.4%) when measured in constant dollars as inflation outpaced an increase in the level of higher education R&D performance (table 2).
Federal Agencies and Federally Funded Research and Development Centers
The federal government performed $66.8 billion of the U.S. R&D total in 2021 (table 1 and table 3). This amount included $41.5 billion (5% of the U.S. total) performed by the intramural R&D facilities of federal agencies and $25.3 billion (3%) performed by the 43 federally funded research and development centers (FFRDCs). The federal share of U.S. R&D performance ranged between 11% and 13% in 2001–11. Subsequently, the federal share is estimated to decline to 8% in 2022. Measured in constant dollars, federal R&D performance is estimated to increase in 2022 after a modest decline in 2021 (table 2).
State Government
Nonprofit Organizations
R&D by Type of R&D
In 2021, basic research activities in all sectors accounted for $118.6 billion, or 15% of U.S. total R&D expenditures (table 5). Applied research was $144.0 billion, or 18% of the total. Most of the total of U.S. R&D expenditures was experimental development at $526.4 billion, or 67%.
U.S. R&D expenditures, by type of R&D: Selected years, 1970–2022
NA = not available.
FFRDC = federally funded research and development center.
a Some data for 2021 are preliminary and may later be revised.
a The data for 2022 include estimates and are likely to later be revised.
Note(s):
Data throughout the span of time reported here are consistently based on Organisation for Economic Co-operation and Development Frascati Manual definitions for basic research, applied research, and experimental development. Prior to 2010, however, some changes had been introduced in the questionnaires of the sectoral expenditure surveys to improve the accuracy of respondents' classification of their R&D by type. Accordingly, small percentage changes in the historical data may not be meaningful.
Source(s):
National Center for Science and Engineering Statistics, National Patterns of R&D Resources (annual series).
The higher education sector accounted for just under half (46%) of basic research performance in 2021 (table 5). The business sector was the second-largest basic research performer (34%). Business was the majority performer (62%) of the $144.0 billion of applied research in 2021; higher education was second at 16%. Federal intramural performers plus FFRDCs accounted for 15% of the applied research total. Business continued to dominate development performance, accounting for 91% of the U.S. total $526.4 billion of that category in 2021.
Federal funding accounted for 40% of the $118.6 billion of basic research in 2021 (table 4). But federal funds were less prominent for applied research (29% of $144.0 billion) and experimental development (11% of $526.4 billion). The business sector provided the greatest share of funding for applied research (61%) and the predominant share for experimental development (88%). Notably, it also accounted for a sizable share (36%) of funding for basic research.
Over the 2011–21 period, the split of U.S. total R&D expenditures among the three types of R&D did not largely change. The share of applied research ranged between 18% and 21% throughout the period (table 5). Similarly, the share of basic research remained in the 15%–17% range. Experimental development’s share ranged between 62% and 67%. Adjusting for inflation, about $27 billion more in basic research was performed in 2021 than in 2011, $41 billion more in applied research, and $182 billion more in experimental development.
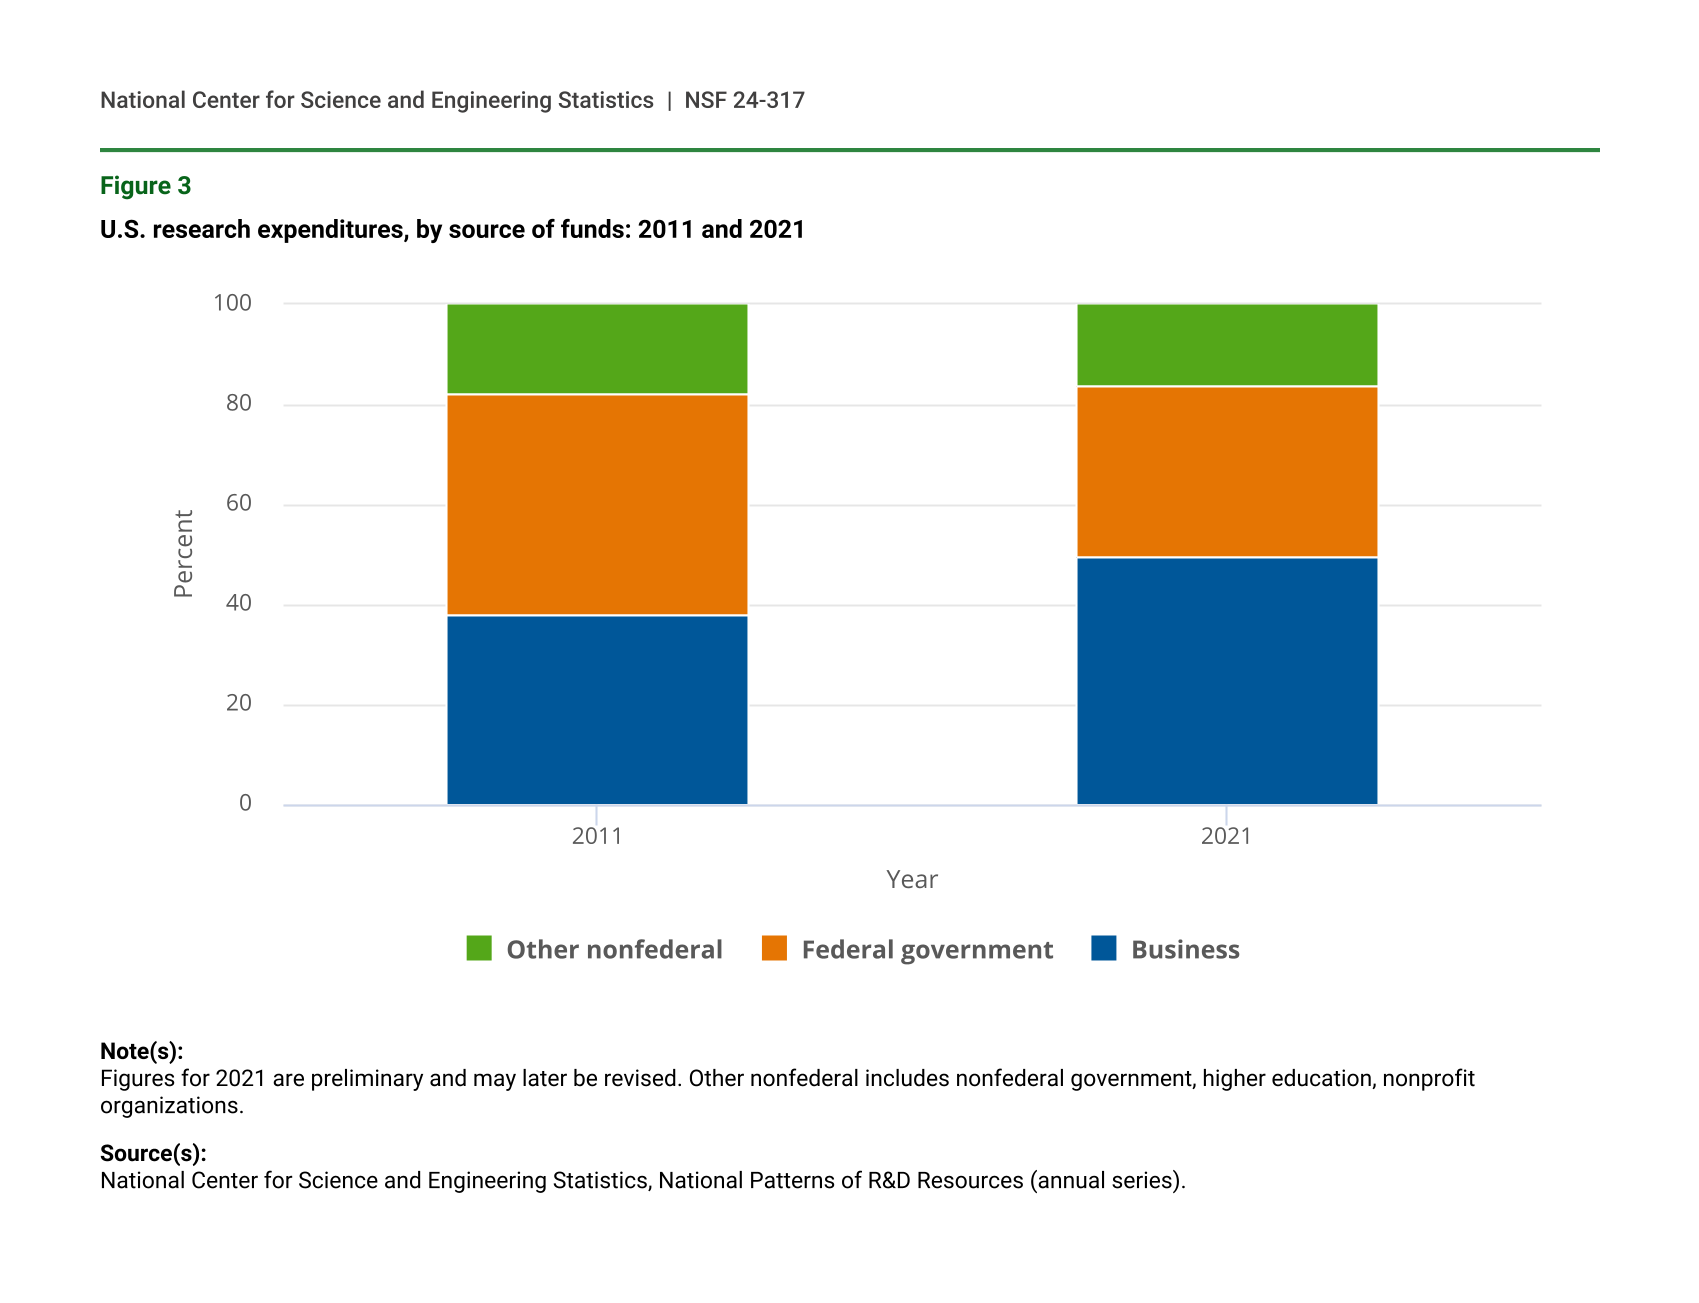
U.S. research expenditures, by source of funds: 2011 and 2021
| Year | Business | Federal government | Other nonfederal |
|---|---|---|---|
| 2011 | 37.8 | 44.2 | 18.0 |
| 2021 | 49.5 | 34.1 | 16.4 |
Note(s):
Figures for 2021 are preliminary and may later be revised. Other nonfederal includes nonfederal government, higher education, nonprofit organizations.
Source(s):
National Center for Science and Engineering Statistics, National Patterns of R&D Resources (annual series).
Social scientists have noted important differences in the nature, role, and impact of research (basic and applied combined) and experimental development. Additionally, the shifting in the relative roles of performers and funders by sector—particularly among business, government, and higher education—is of great interest (table 6, figure 3). In 2021, business expenditures on R&D performed by domestic businesses, higher education institutions, governments, and nonprofit organizations totaled $591.0 billion, divided between $461.0 billion (78%) on experimental development and $130.0 billion (22%) on research (table 7). These business expenditures on research funded 49% of total U.S. research in 2021, up from 38% in 2011 (figure 3). Over the same period, the federally funded share of U.S. total research declined from 44% in 2011 to 34% in 2021. Comparably, the federally funded share of basic research fell from 53% in 2011 to 40% in 2021.
R&D performance also demonstrates the enhanced role of business in the domestic research system. In 2011, businesses performed 18% of U.S. basic research and 39% of total research, but the sector’s share of basic and total research rose to 34% and 49%, respectively, by 2021. The share of U.S. basic research performed by higher education institutions—historically, the nation’s largest basic research performer—declined from 54% in 2011 to 46% in 2021. In absolute terms, higher education basic research performance increased from $40 billion to $54 billion during this period. The increased relative role of the business sector as a funder and performer of basic and applied research is remarkable.
U.S. R&D expenditures by type of R&D and source of funds: Selected years, 1970–2022
a Some data for 2021 are preliminary and may later be revised.
b The R&D data for 2022 include estimates and are likely to later be revised.
Note(s):
Other nonfederal includes nonfederal government, higher education, and nonprofit organizations.
Source(s):
National Center for Science and Engineering Statistics, National Patterns of R&D Resources (annual series).
U.S. business R&D expenditures, by type of R&D: 1970–2022
a Some data for 2021 are preliminary and may later be revised.
b The R&D data for 2022 include estimates and are likely to later be revised.
Source(s):
National Center for Science and Engineering Statistics, National Patterns of R&D Resources (annual series).
Data Sources, Limitations, and Availability
The statistics on U.S. R&D presented in this report derive mainly from integrating the data on R&D expenditures and funding collected by NCSES’s annual national surveys of the organizations that perform and fund the vast majority of U.S. R&D. These surveys cover each of four sectors of the economy: higher education, government, business enterprise, and nonprofit organizations. In some cases, the primary data from these surveys are adjusted to enable consistent integration of the statistics across these separately conducted surveys. The 2022 business R&D data is based on respondents’ projected R&D costs and will be revised when actual R&D costs are collected in the following year. In addition, preliminary or otherwise estimated values may be used where final data from one or more of the surveys are not yet available but can reasonably be estimated. Estimates in this InfoBrief are based on census and sample survey data which are subject to nonsampling error. Sample-survey–based estimates are also subject to sampling error. All comparative statements in this InfoBrief have undergone statistical testing and are significant at the 90% confidence level except statements reliant on modeled estimates.
The R&D surveys include NCSES’s annual surveys of business R&D (the Business Enterprise Research and Development Survey for 2019–21, the preceding Business Research and Development Survey for 2017–18, the Business R&D and Innovation Survey for 2008–16, and the Survey of Industrial R&D for 2007 and earlier years). In addition, the business R&D totals include the R&D expenditures reported by “micro” companies (defined as companies with fewer than 10 employees) through NCSES surveys fielded for 2016 and forward (the 2016 Business R&D and Innovation Survey—Microbusiness and the Annual Business Survey (ABS) since 2017). Other NCSES survey data sources are the Higher Education Research and Development Survey (for FYs 2010–20), the preceding Survey of R&D Expenditures at Universities and Colleges (FY 2009 and earlier years), the Survey of Federal Funds for Research and Development (FYs 2020–21 and earlier years), and the FFRDC Research and Development Survey (FY 2020 and earlier years). Amounts for the R&D performed by nonprofit organizations with funding from the nonprofit sector and from business sources are estimated based on data and parameters from the FY 2021 Nonprofit Research Activities (NPRA) module of the ABS, the 2016 NPRA Survey, and the 1996–97 Survey of R&D Funding and Performance by Nonprofit Organizations.
A full set of detailed statistical tables and methodology information for the National Patterns data are available at https://ncses.nsf.gov/data-collections/national-patterns/2021-2022. For further information and questions, contact the author.
Notes
1Research and experimental development (R&D) comprise creative and systematic work undertaken in order to increase the stock of knowledge—including knowledge of humankind, culture, and society—and to devise new applications of available knowledge. Basic research is experimental or theoretical work undertaken primarily to acquire new knowledge of the underlying foundations of phenomena and observable facts, without any particular application or use in view. Applied research is original investigation undertaken in order to acquire new knowledge; directed primarily toward a specific, practical aim or objective. Experimental development is systematic work, drawing on knowledge gained from research and practical experience and producing additional knowledge, which is directed to producing new products or processes or to improving existing products or processes. See Organisation for Economic Co-Operation and Development (OECD). 2015. Frascati Manual 2015: Guidelines for Collecting and Reporting Data on Research and Experimental Development. The Measurement of Scientific, Technological and Innovation Activities, OECD Publishing: Paris. Available at https://doi.org/10.1787/9789264239012-en.
2For example, see Mowery DC. 2009. Plus ca change: Industrial R&D in the ‘Third Industrial Revolution.’ Industrial and Corporate Change 18 (1): 1–50 and Arora A, Belenzon S, and Patacconi A. 2018. The Decline of Science in Corporate R&D. Strategic Management Journal 39 (1): 3–32.
3Arora A, Belenzon S, and Sheer L. 2021. Knowledge Spillovers and Corporate Investment in Scientific Research. American Economic Review, 111 (3): 871–898.
4Percentages in this report are calculated based on unrounded data.
5All growth rate calculations are reported using compound annual growth rates unless otherwise noted.
6In this report, dollars adjusted for inflation (i.e., constant dollars) are based on the gross domestic product (GDP) implicit price deflator (currently in 2017 dollars) as published by the Bureau of Economic Analysis (BEA) at https://www.bea.gov/iTable/index_nipa.cfm. Note that GDP deflators are calculated on an economy-wide scale and do not explicitly focus on R&D.
7Inflation measured by the Consumer Price Index (CPI) for 2014–20 ranged between 0.1% and 2.4%. Inflation was 4.7% and 8.0% in 2021 and 2022, respectively (https://www.minneapolisfed.org/about-us/monetary-policy/inflation-calculator/consumer-price-index-1913-). While the CPI is a more commonly known inflation measure, as noted above and in accordance with international standards for R&D reporting, dollars in this report are adjusted for inflation using the GDP implicit price deflator.
8Due to sample variability in the data for the business R&D component, the calculated R&D-to-GDP ratios for 1964, 2009, and 2017 are not significantly different from one another at a 90% confidence level. Additionally, non-U.S. R&D-to-GDP ratios are adjusted for net R&D capital accumulation.
9See Organisation for Economic Co-Operation and Development, OECD Main Science and Technology Indicators Database, September 2023. Available at https://www.oecd.org/sti/msti.htm.
10North American Industry Classification System (NAICS).
11Additional statistics on R&D performed in the United States by the business sector are available at https://ncses.nsf.gov/surveys/annual-business-survey/ and https://ncses.nsf.gov/surveys/business-enterprise-research-development/. See also:
Britt R; National Center for Science and Engineering Statistics (NCSES). 2023. Business R&D Performance in the United States Tops $600 Billion in 2021. NSF 23-350. Alexandria, VA: National Science Foundation. Available at http://ncses.nsf.gov/pubs/nsf23350.
Kindlon A; National Center for Science and Engineering Statistics (NCSES). 2023. Microbusinesses Performed $6.1 Billion of R&D in the United States in 2021. NSF 24-302. Alexandria, VA: National Science Foundation. Available at https://ncses.nsf.gov/pubs/nsf24302.
12The data on higher education R&D reported by National Patterns differ from the underlying survey data in several respects. First, National Patterns translates the Higher Education R&D (HERD) Survey’s primary data in academic fiscal years to calendar year equivalents. Second, National Patterns reports higher education R&D expenditures that are adjusted to remove the double-counting of pass-through funding included in HERD Survey source data. For further details on this topic, see “Technical Notes” at https://ncses.nsf.gov/data-collections/national-patterns/2021-2022#technical-notes.
13The number of FFRDCs reflects that NCSES was informed in June 2021 that the Green Bank Observatory separated from the National Radio Astronomy Observatory in October 2016 to become an independent institution; both retained FFRDC status. The Master Government List of FFRDCs was subsequently updated to reflect this change.
14The most recent data on nonprofit organization R&D come from the FY 2021 Nonprofit Research Activities (NPRA) module of the ABS and the 2016 NPRA Survey. Data for nonprofit organization R&D, 2017–19 are estimated based on the 2016 and 2020 data as revised in the 2021 survey. The availability of NPRA survey data allowed for improved measurement of nonprofit R&D performance over the 2017–22 period, resulting in minor changes to previously published estimates. For 1998–2015, data for nonprofit organization R&D funded by the federal government come from the NCSES annual Survey of Federal Funds for Research and Development; data for that funded by businesses and by the nonprofit sector itself are estimated, based on parameters from the 1996–97 Survey of Research and Development Funding and Performance by Nonprofit Organizations.
15Estimates of the type of R&D by source of funding are based on survey responses for federal funding by type of R&D and modeled using nonfederal funding sources of total R&D and the total nonfederally funded R&D by type. Because of this estimation procedure, comparisons of R&D type by funding source are not supported by statistical testing. National Patterns of R&D uses the general term “estimates” to describe survey estimates, modeled estimates, and projections. Results that combine these techniques are also called estimates because survey estimates are their major component.
16For example, see Arora A, Belenzon S, and Sheer L. 2021. Knowledge Spillovers and Corporate Investment in Scientific Research. American Economic Review 111 (3): 871–898 or Mezzanotti F and Simcoe T; National Bureau of Economic Research. 2023. Research and/or Development? Financial Frictions and Innovation Investment. Working Paper No. 31521.
17For further details on the correspondence between sectors used to measure R&D and those used in the System of National Accounts, please see the Frascati Manual 2015: Guidelines for Collecting and Reporting Data on Research and Experimental Development (https://doi.org/10.1787/9789264239012-en).
18Estimates from the NCSES business and nonprofit organization R&D surveys mentioned are all derived from sample data and thereby contain sampling error. Consequently, estimates of total U.S. R&D also contain sampling error. For more information on this topic and other surveys used in the National Patterns tabulations, see the “Technical Notes” at https://ncses.nsf.gov/data-collections/national-patterns/2021-2022#technical-notes.
Suggested Citation
Anderson G; National Center for Science and Engineering Statistics (NCSES). 2024. U.S. R&D Increased by $72 Billion in 2021 to $789 Billion; Estimate for 2022 Indicates Further Increase to $886 Billion. NSF 24-317. Alexandria, VA: National Science Foundation. Available at https://ncses.nsf.gov/pubs/nsf24317/.
Contact Us
NCSES
National Center for Science and Engineering Statistics
Directorate for Social, Behavioral and Economic Sciences
National Science Foundation
2415 Eisenhower Avenue, Suite W14200
Alexandria, VA 22314
Tel: (703) 292-8780
FIRS: (800) 877-8339
TDD: (800) 281-8749
E-mail: ncsesweb@nsf.gov
NSF 24-317
|January 22, 2024