 An official website of the United States government

FY 2022 Federal Science and Engineering Support to Selected Types of Minority-Serving Institutions
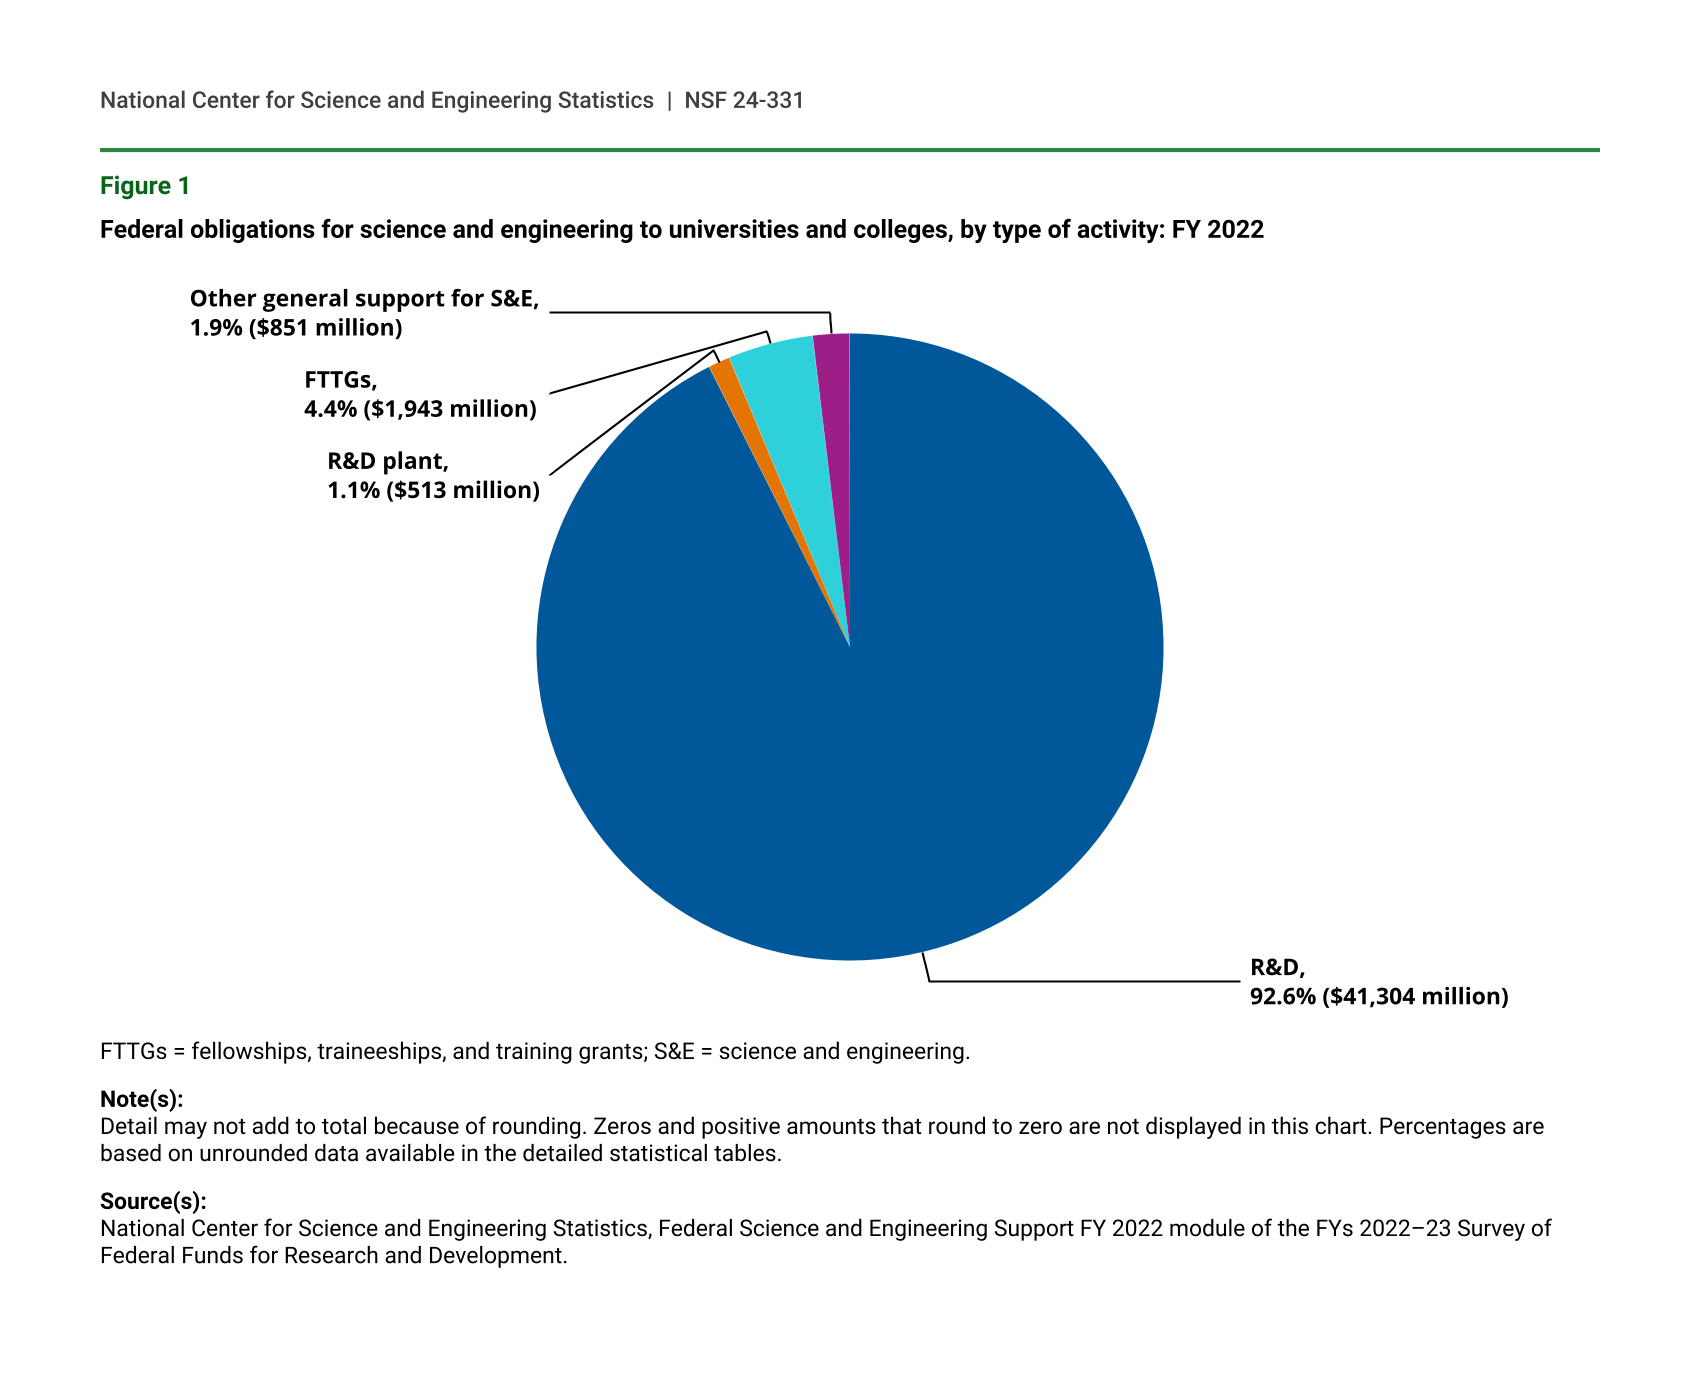
Federal agency funding to higher education institutions for science and engineering (S&E) support is composed of five types of activities: research and experimental development (R&D); R&D plant; facilities and equipment for instruction in S&E; fellowships, traineeships, and training grants (FTTGs); and other general support for S&E. Across all types of higher education institutions, obligations for R&D make up the largest component of S&E support (93%) (figure 1).
Federal obligations for science and engineering to universities and colleges, by type of activity: FY 2022
| Type of support | Percent | $millions |
|---|---|---|
| R&D | 92.6 | 41,304 |
| R&D plant | 1.1 | 513 |
| Facilities and equipment for S&E instruction | * | 18 |
| FTTGs | 4.4 | 1,943 |
| Other general support for S&E | 1.9 | 851 |
FTTGs = fellowships, traineeships, and training grants; S&E = science and engineering.
Note(s):
Detail may not add to total because of rounding. Zeros and positive amounts that round to zero are not displayed in this chart. Percentages are based on unrounded data available in the detailed statistical tables.
Source(s):
National Center for Science and Engineering Statistics, Federal Science and Engineering Support FY 2022 module of the FYs 2022–23 Survey of Federal Funds for Research and Development.
The shares of federal S&E support vary across types of institutions of higher education. Although some types of institutions may have a larger share of support in the form of R&D, others may have a larger share of FTTGs or other general support for S&E, as these latter types of funding activities are designed to build future capacity for R&D. From a science policy perspective, understanding where federal funds are distributed not only for R&D but also for other types of S&E support provides insight into where the federal government is focused on building capacity for S&E.
Although data in this InfoBrief are from FY 2022, the FY 2025 president’s budget request presents an initiative to build support for R&D at minority-serving institutions. For example, “The Budget supports workforce development in science, technology, engineering, and math…with an emphasis on emerging research institutions and historically underserved communities.” And goes on to note, “Multiple agencies are also supporting and building R&D capacity at Historically Black Colleges and Universities, Tribally Controlled Colleges and Universities, and Minority-Serving Institutions.”
This InfoBrief provides details on federal obligations for S&E support by type of activity and by federal agency for selected sets of minority-serving institutions, specifically, high-Hispanic-enrollment institutions (HHEs), high-American Indian-enrollment institutions (HAIEs), tribal colleges and universities (TCUs), historically Black colleges and universities (HBCUs), and women’s colleges and universities (WCUs). These data come from the FY 2022 Survey of Federal Science and Engineering Support to Universities, Colleges, and Nonprofit Institutions—now the Federal S&E Support module within the Survey of Federal Funds for Research and Development (Federal Funds for R&D)—conducted by the National Center for Science and Engineering Statistics (NCSES) within the U.S. National Science Foundation (NSF). In FY 2022, a total of 1,089 higher education institutions received federal obligations for S&E support.
High-Hispanic-Enrollment Institutions
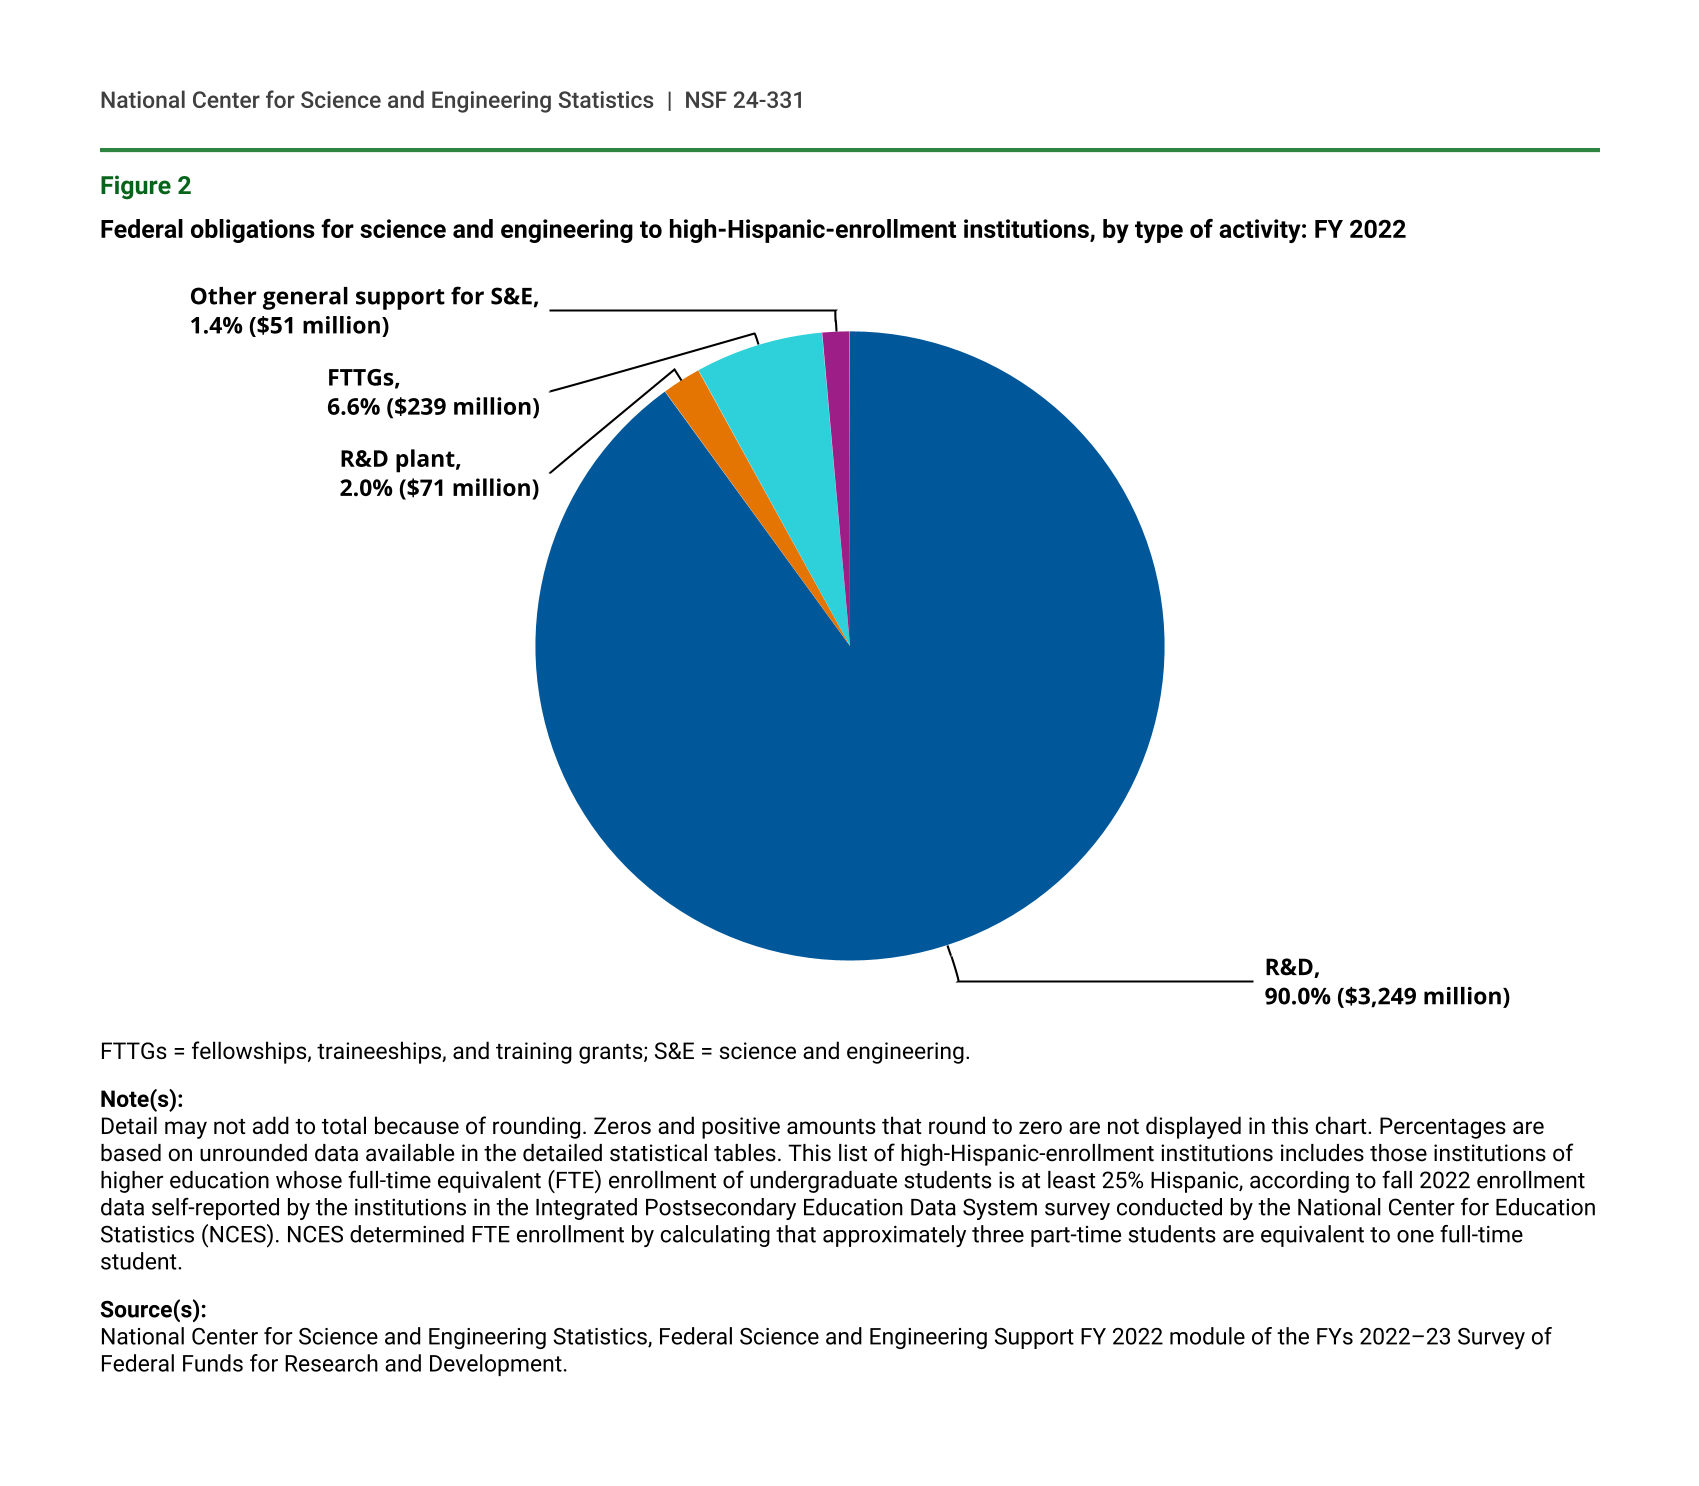
In FY 2022, there were 186 HHEs, which in total received $3.6 billion in federal obligations for S&E support (figure 2). Federal support to HHEs for R&D totaled $3.2 billion, or 90% of total federal S&E support to HHEs, whereas federal support to HHEs for FTTGs accounted for $239 million, or 7% of their S&E total. The shares of R&D and FTTGs support to HHEs varies only slightly from the shares given to all higher education institutions, as many of the top HHE recipient institutions are considered high-performing R&D institutions. For instance, the shares of R&D and FTTGs for all institutions are 93% and 4% respectively, whereas the shares for R&D and FTTGs for HHEs are 90% and 7%, respectively. The top 10 HHE recipient institutions are all within the top 100 institutions out of 1,089 total recipient institutions in FY 2022. For example, the University of Arizona is the largest recipient of federal S&E support among all HHEs, and it also ranks 35th for federal obligations among all higher education institutions.
Federal obligations for science and engineering to high-Hispanic-enrollment institutions, by type of activity: FY 2022
| Type of support | Percent | $millions |
|---|---|---|
| R&D | 90.0 | 3249 |
| R&D plant | 2.0 | 71 |
| Facilities and equipment for S&E instruction | * | * |
| FTTGs | 6.6 | 239 |
| Other general support for S&E | 1.4 | 51 |
FTTGs = fellowships, traineeships, and training grants; S&E = science and engineering.
Note(s):
Detail may not add to total because of rounding. Zeros and positive amounts that round to zero are not displayed in this chart. Percentages are based on unrounded data available in the detailed statistical tables. This list of high-Hispanic-enrollment institutions includes those institutions of higher education whose full-time equivalent (FTE) enrollment of undergraduate students is at least 25% Hispanic, according to fall 2022 enrollment data self-reported by the institutions in the Integrated Postsecondary Education Data System survey conducted by the National Center for Education Statistics (NCES). NCES determined FTE enrollment by calculating that approximately three part-time students are equivalent to one full-time student.
Source(s):
National Center for Science and Engineering Statistics, Federal Science and Engineering Support FY 2022 module of the FYs 2022–23 Survey of Federal Funds for Research and Development.
In FY 2022, more than half of all S&E support to HHEs was obligated by the Department of Health and Human Services (HHS), with $1.9 billion to 99 institutions (table 1). However, federal agency funding was concentrated within a handful of institutions. For example, 86% of HHS funding to HHEs was concentrated in the 20 institutions that received the most overall S&E obligations. NSF was the second-leading federal agency to obligate funding to support S&E at HHEs, with $911 million to 153 institutions. The top 20 institutions accounted for 68% of all NSF obligations to HHEs. The Department of Defense (DOD) was the third-leading funder of S&E support to HHEs, with $383 million to 55 institutions. The top 20 institutions accounted for 78% of all DOD obligations to HHEs.
Federal obligations for science and engineering to high-Hispanic-enrollment institutions, ranked by total amount received, by agency: FY 2022
DHS = Department of Homeland Security; DOC = Department of Commerce; DOD = Department of Defense; DOE = Department of Energy; DOI = Department of the Interior; DOT = Department of Transportation; ED = Department of Education; EPA = Environmental Protection Agency; HHE = high Hispanic enrollment; HHS = Department of Health and Human Services; NASA = National Aeronautics and Space Administration; NSF = National Science Foundation; USDA = Department of Agriculture.
a Includes obligations from the following agencies: the Department of Justice, the Nuclear Regulatory Commission, and the Social Security Administration.
b Excludes obligations for the university's foundation or auxiliary organization or some campuses or branches as those are not HHE institutions.
Note(s):
Detail may not add to total because of rounding. Institution order is based on total actual dollars received before amounts are rounded; institutions receiving the same amount of actual dollars are listed alphabetically. Only those agencies that had obligations in the variables represented by this table appear in the table. This list of HHE institutions includes those institutions of higher education whose full-time equivalent (FTE) enrollment of undergraduate students is at least 25% Hispanic, according to fall 2022 enrollment data self-reported by the institutions in the Integrated Postsecondary Education Data System survey conducted by the National Center for Education Statistics (NCES). NCES determined FTE enrollment by calculating that approximately three part-time students are equivalent to one full-time student.
Source(s):
National Center for Science and Engineering Statistics, Federal Science and Engineering Support FY 2022 module of the FYs 2022–23 Survey of Federal Funds for Research and Development.
High-American Indian-Enrollment Institutions
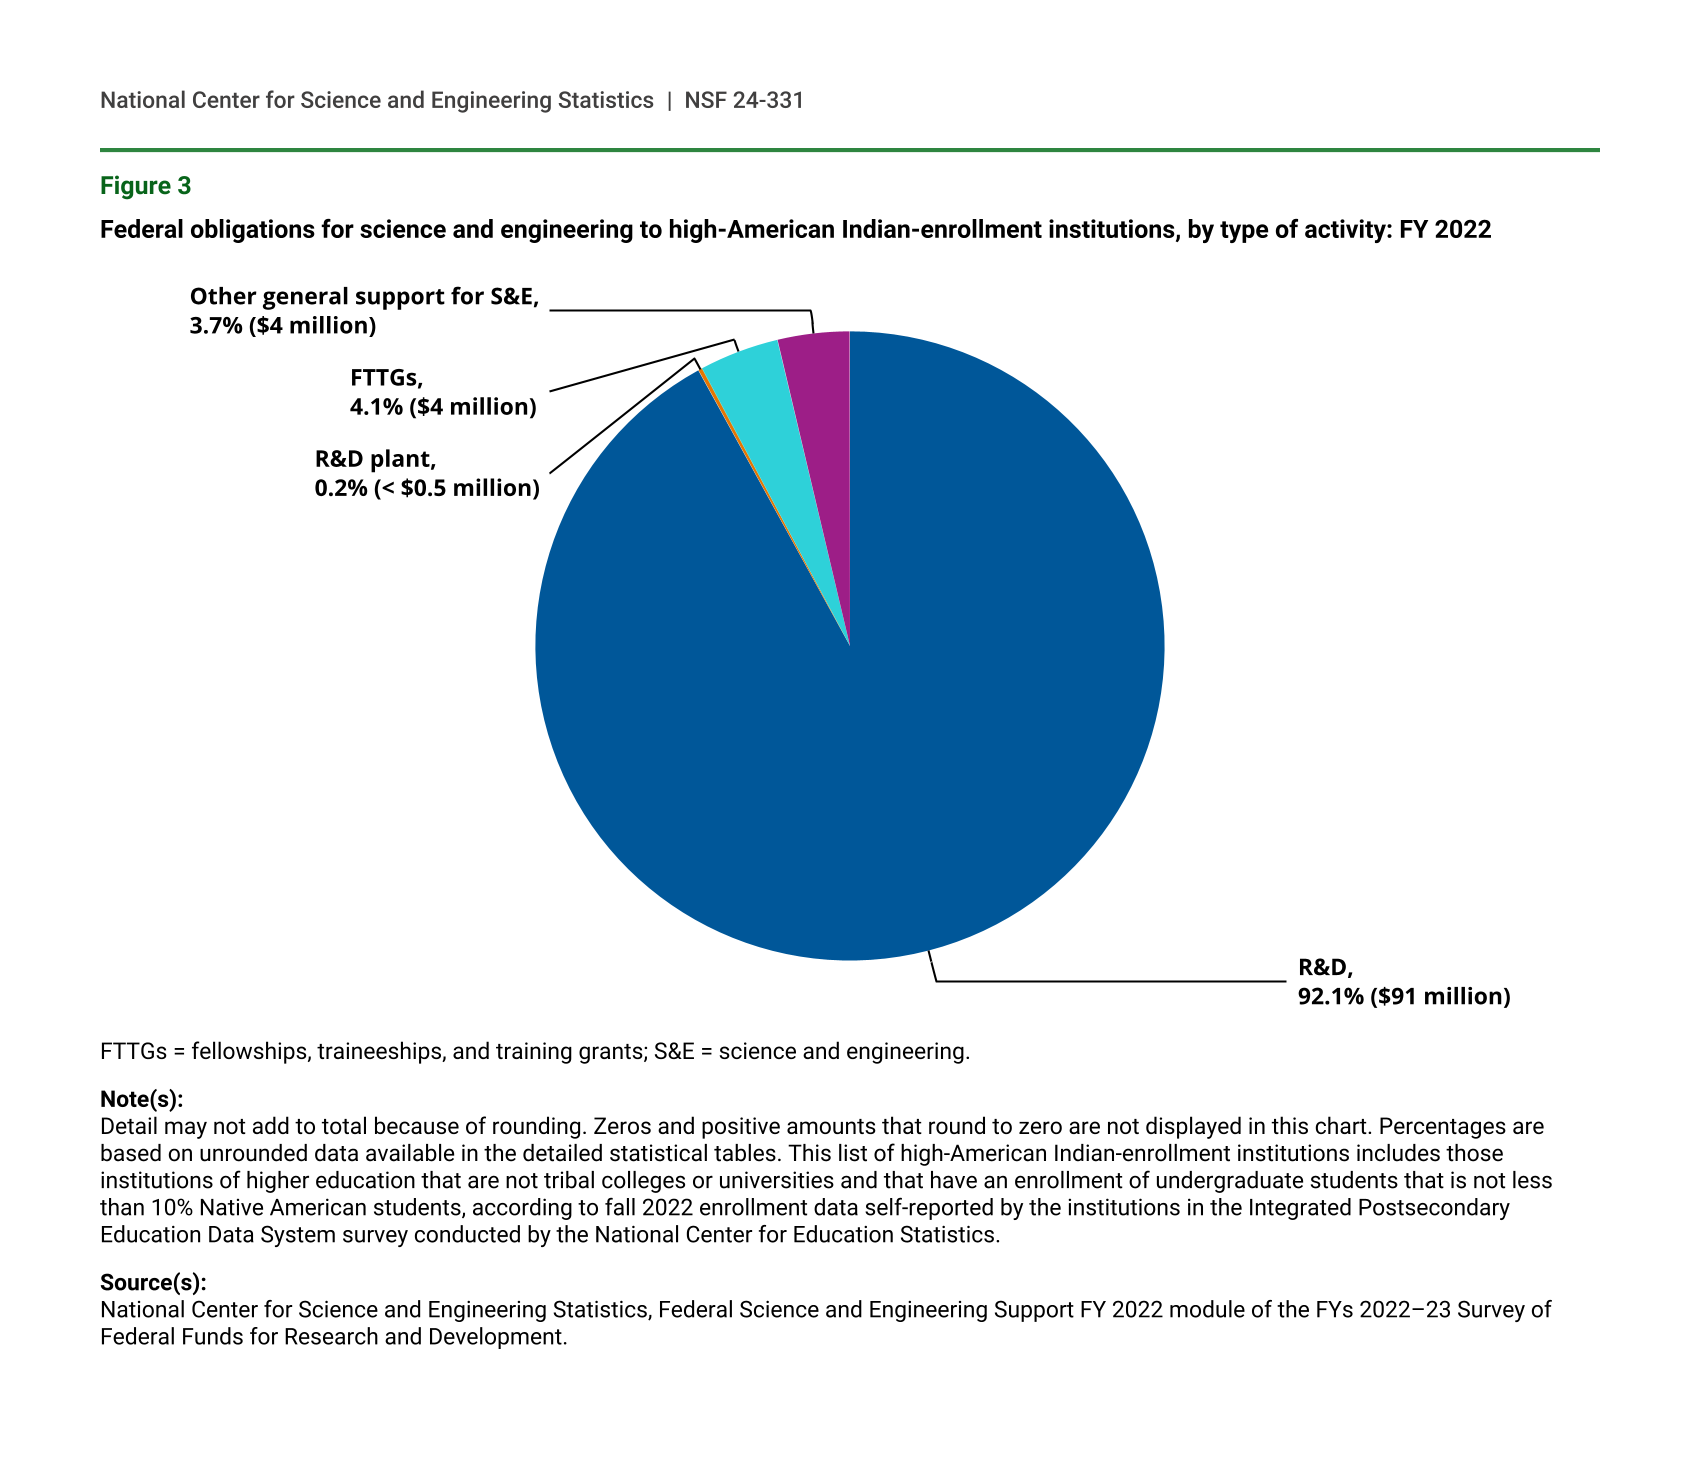
In FY 2022, five institutions were designated as HAIEs, which in total received $99 million in federal obligations for S&E support (figure 3). Federal support to HAIEs for R&D totaled $91 million, or 92% of total federal S&E support to all HAIEs. FTTG support to HAIEs accounted for $4 million, or 4% of total federal S&E support to HAIEs. However, federal funding to HAIEs was highly concentrated: the University of Alaska, Fairbanks accounted for 92% of all federal S&E support to HAIEs in FY 2022. NSF was the leading funding agency to HAIEs with $43 million, with 95% of these funds obligated to the University of Alaska, Fairbanks (table 2). The University of Alaska, Fairbanks ranked as 114 in federal S&E support out of all 1,089 recipient institutions.
Federal obligations for science and engineering to high-American Indian-enrollment institutions, by type of activity: FY 2022
| Type of support | Percent | $millions |
|---|---|---|
| R&D | 92.1 | 91 |
| R&D plant | 0.2 | * |
| Facilities and equipment for S&E instruction | 0.0 | 0 |
| FTTGs | 4.1 | 4 |
| Other general support for S&E | 3.7 | 4 |
FTTGs = fellowships, traineeships, and training grants; S&E = science and engineering.
Note(s):
Detail may not add to total because of rounding. Zeros and positive amounts that round to zero are not displayed in this chart. Percentages are based on unrounded data available in the detailed statistical tables. This list of high-American Indian-enrollment institutions includes those institutions of higher education that are not tribal colleges or universities and that have an enrollment of undergraduate students that is not less than 10% Native American students, according to fall 2022 enrollment data self-reported by the institutions in the Integrated Postsecondary Education Data System survey conducted by the National Center for Education Statistics.
Source(s):
National Center for Science and Engineering Statistics, Federal Science and Engineering Support FY 2022 module of the FYs 2022–23 Survey of Federal Funds for Research and Development.
Federal obligations for science and engineering to high-American Indian-enrollment institutions, ranked by total amount received, by agency: FY 2022
DOC = Department of Commerce; DOD = Department of Defense; DOI = Department of the Interior; HAIE = high American Indian enrollment; HHS = Department of Health and Human Services; NASA = National Aeronautics and Space Administration; NSF = National Science Foundation; USDA = Department of Agriculture.
a Excludes obligations for the university's foundation or auxiliary organization or some campuses or branches as those are not HAIE institutions.
Note(s):
Detail may not add to total because of rounding. Institution order is based on total actual dollars received before amounts are rounded. Only those agencies that had obligations in the variables represented by this table appear in the table. This list of HAIE institutions includes those institutions of higher education that are not tribal colleges or universities and that have an enrollment of undergraduate students that is not less than 10% Native American students, according to fall 2022 enrollment data self-reported by the institutions in the Integrated Postsecondary Education Data System survey conducted by the National Center for Education Statistics.
Source(s):
National Center for Science and Engineering Statistics, Federal Science and Engineering Support FY 2022 module of the FYs 2022–23 Survey of Federal Funds for Research and Development.
Tribal Colleges and Universities
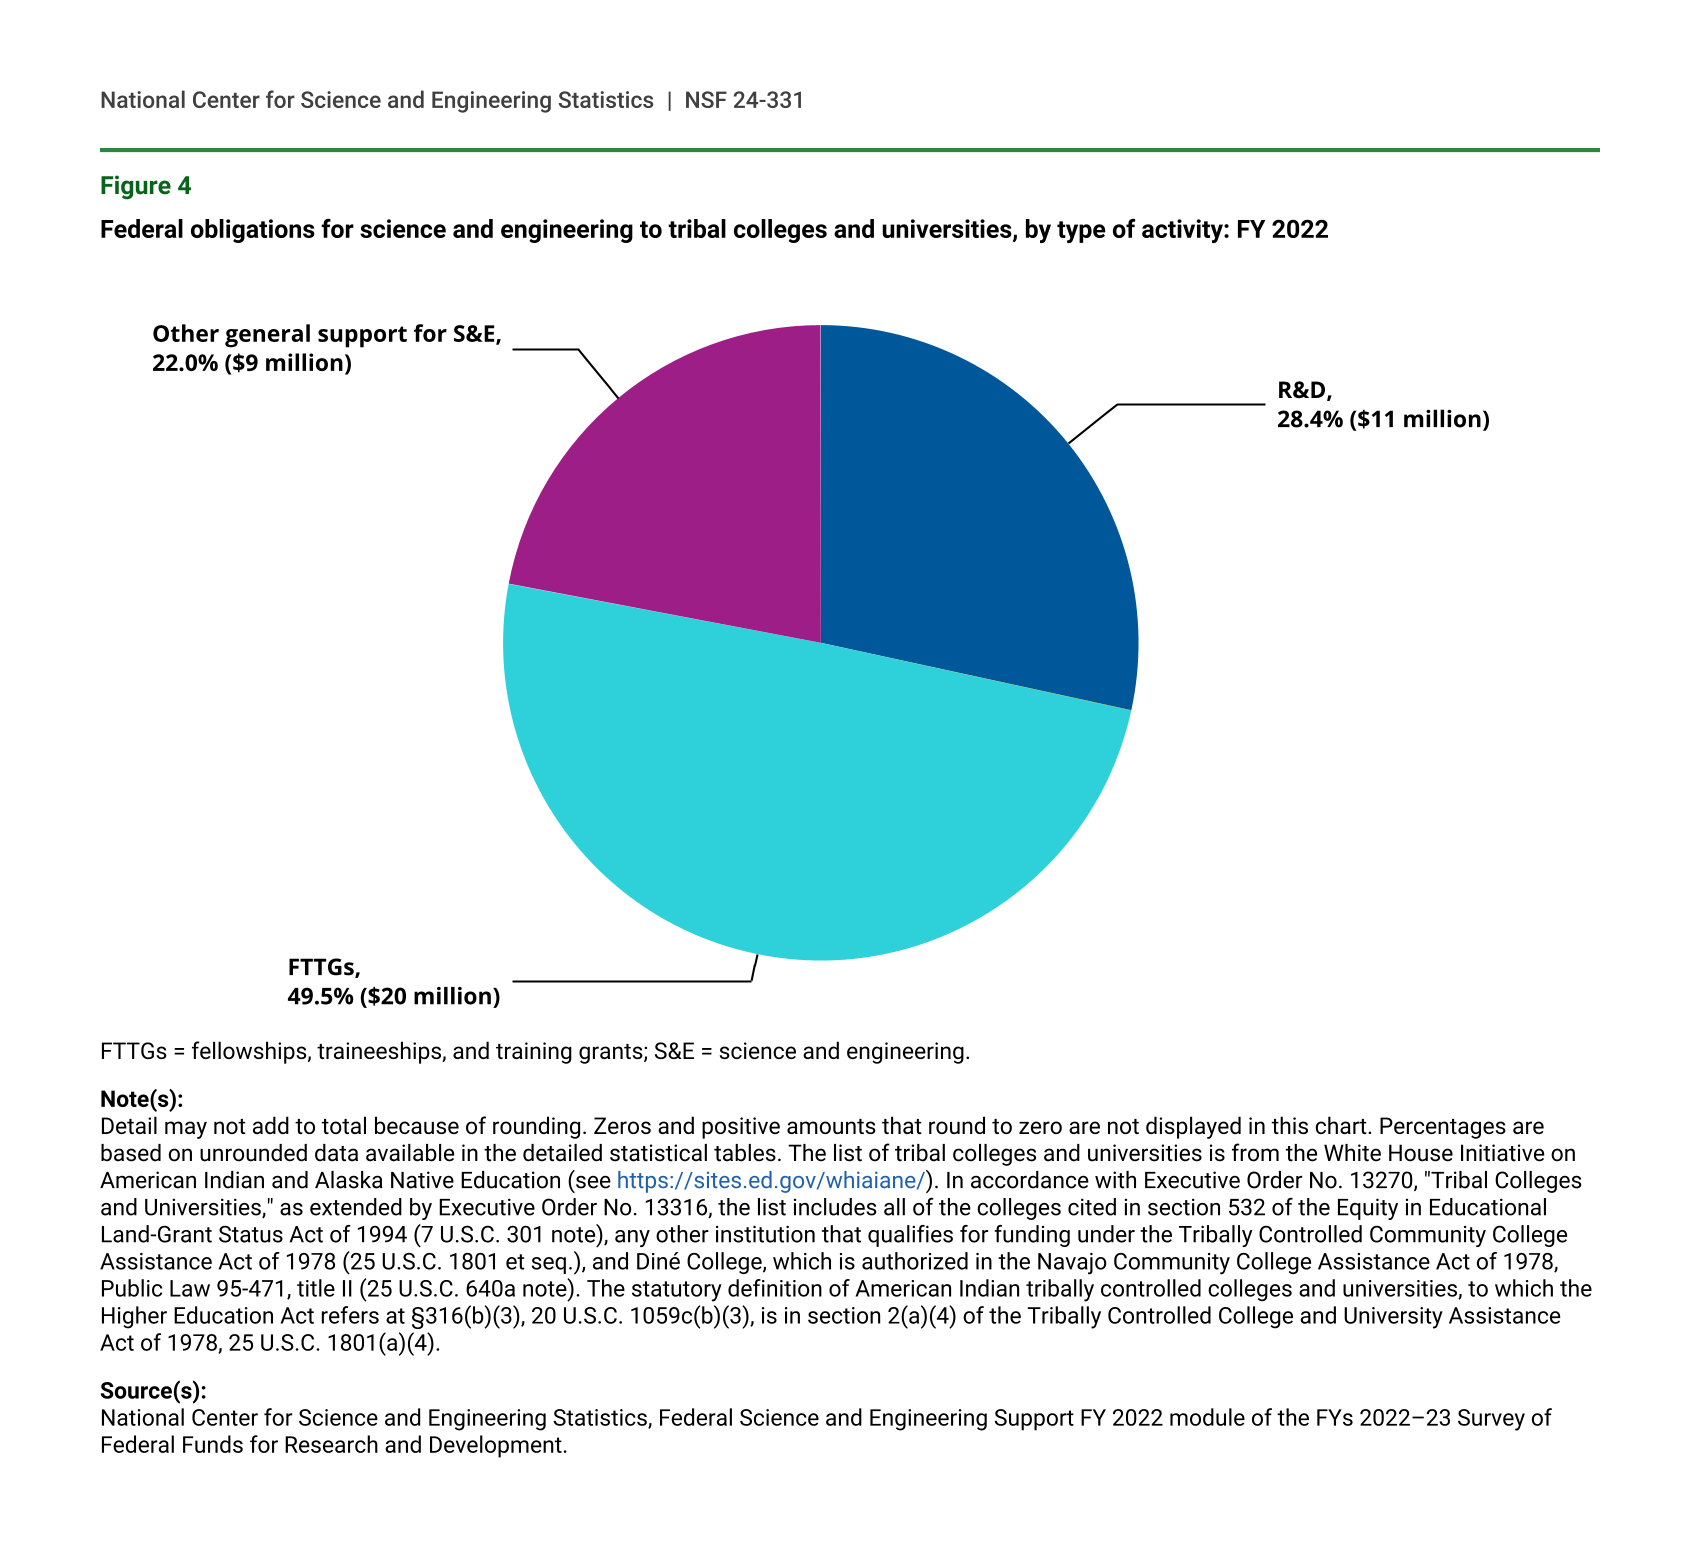
Although the distribution ratios of federal S&E support to HAIEs in total resembled those to all higher education institutions in FY 2022, the distribution ratios to TCUs were very different. Total federal S&E support to 33 TCUs was $40 million, 50% ($20 million) of these funds were for FTTGs (figure 4). Federal obligations to TCUs for R&D accounted for 28% ($11 million) and those for all other general support for S&E accounted for 22% ($9 million), demonstrating a focus on building further capacity for S&E in TCUs, compared with the distribution of activity types to all institutions of higher education.
Federal obligations for science and engineering to tribal colleges and universities, by type of activity: FY 2022
| Type of support | Percent | $millions |
|---|---|---|
| R&D | 28.4 | 11 |
| R&D plant | 0.0 | 0 |
| Facilities and equipment for S&E instruction | 0.0 | 0 |
| FTTGs | 49.5 | 20 |
| Other general support for S&E | 22.0 | 9 |
FTTGs = fellowships, traineeships, and training grants; S&E = science and engineering.
Note(s):
Detail may not add to total because of rounding. Zeros and positive amounts that round to zero are not displayed in this chart. Percentages are based on unrounded data available in the detailed statistical tables. The list of tribal colleges and universities is from the White House Initiative on American Indian and Alaska Native Education (see https://sites.ed.gov/whiaiane/). In accordance with Executive Order No. 13270, "Tribal Colleges and Universities," as extended by Executive Order No. 13316, the list includes all of the colleges cited in section 532 of the Equity in Educational Land-Grant Status Act of 1994 (7 U.S.C. 301 note), any other institution that qualifies for funding under the Tribally Controlled Community College Assistance Act of 1978 (25 U.S.C. 1801 et seq.), and Diné College, which is authorized in the Navajo Community College Assistance Act of 1978, Public Law 95-471, title II (25 U.S.C. 640a note). The statutory definition of American Indian tribally controlled colleges and universities, to which the Higher Education Act refers at §316(b)(3), 20 U.S.C. 1059c(b)(3), is in section 2(a)(4) of the Tribally Controlled College and University Assistance Act of 1978, 25 U.S.C. 1801(a)(4).
Source(s):
National Center for Science and Engineering Statistics, Federal Science and Engineering Support FY 2022 module of the FYs 2022–23 Survey of Federal Funds for Research and Development.
In FY 2022, NSF was the lead funding agency in support of S&E activities to TCUs with obligations of $22 million, or 54% of all federal S&E support to these institutions. NSF funded 17 of the 33 TCUs (table 3). Comparatively, the Department of Agriculture (USDA) followed with $14 million, or 35% of all S&E support to tribal colleges and universities. However, USDA provided funding to 32 of the 33 TCUs. HHS accounted for $2 million to four TCUs, DOD obligated funds to three TCUs totaling $2 million, and the Department of Commerce funded one TCU at $543 thousand.
Federal obligations for science and engineering to tribal colleges and universities, ranked by total amount received, by agency: FY 2022
DOC = Department of Commerce; DOD = Department of Defense; HHS = Department of Health and Human Services; NSF = National Science Foundation; USDA = Department of Agriculture.
a Excludes obligations for the university's foundation or auxiliary organization or some campuses or branches as those are not tribal colleges and universities.
Note(s):
Detail may not add to total because of rounding. Institution order is based on total actual dollars received before amounts are rounded. Only those agencies that had obligations in the variables represented by this table appear in the table. The list of tribal colleges and universities is from the White House Initiative on American Indian and Alaska Native Education (see https://sites.ed.gov/whiaiane/). In accordance with Executive Order No. 13270, "Tribal Colleges and Universities," as extended by Executive Order No. 13316, the list includes all of the colleges cited in section 532 of the Equity in Educational Land-Grant Status Act of 1994 (7 U.S.C. 301 note), any other institution that qualifies for funding under the Tribally Controlled Community College Assistance Act of 1978 (25 U.S.C. 1801 et seq.), and Diné College, which is authorized in the Navajo Community College Assistance Act of 1978, Public Law 95-471, title II (25 U.S.C. 640a note). The statutory definition of American Indian tribally controlled colleges and universities, to which the Higher Education Act refers at §316(b)(3), 20 U.S.C. 1059c(b)(3), is in section 2(a)(4) of the Tribally Controlled College and University Assistance Act of 1978, 25 U.S.C. 1801(a)(4).
Source(s):
National Center for Science and Engineering Statistics, Federal Science and Engineering Support FY 2022 module of the FYs 2022–23 Survey of Federal Funds for Research and Development.
Historically Black Colleges and Universities
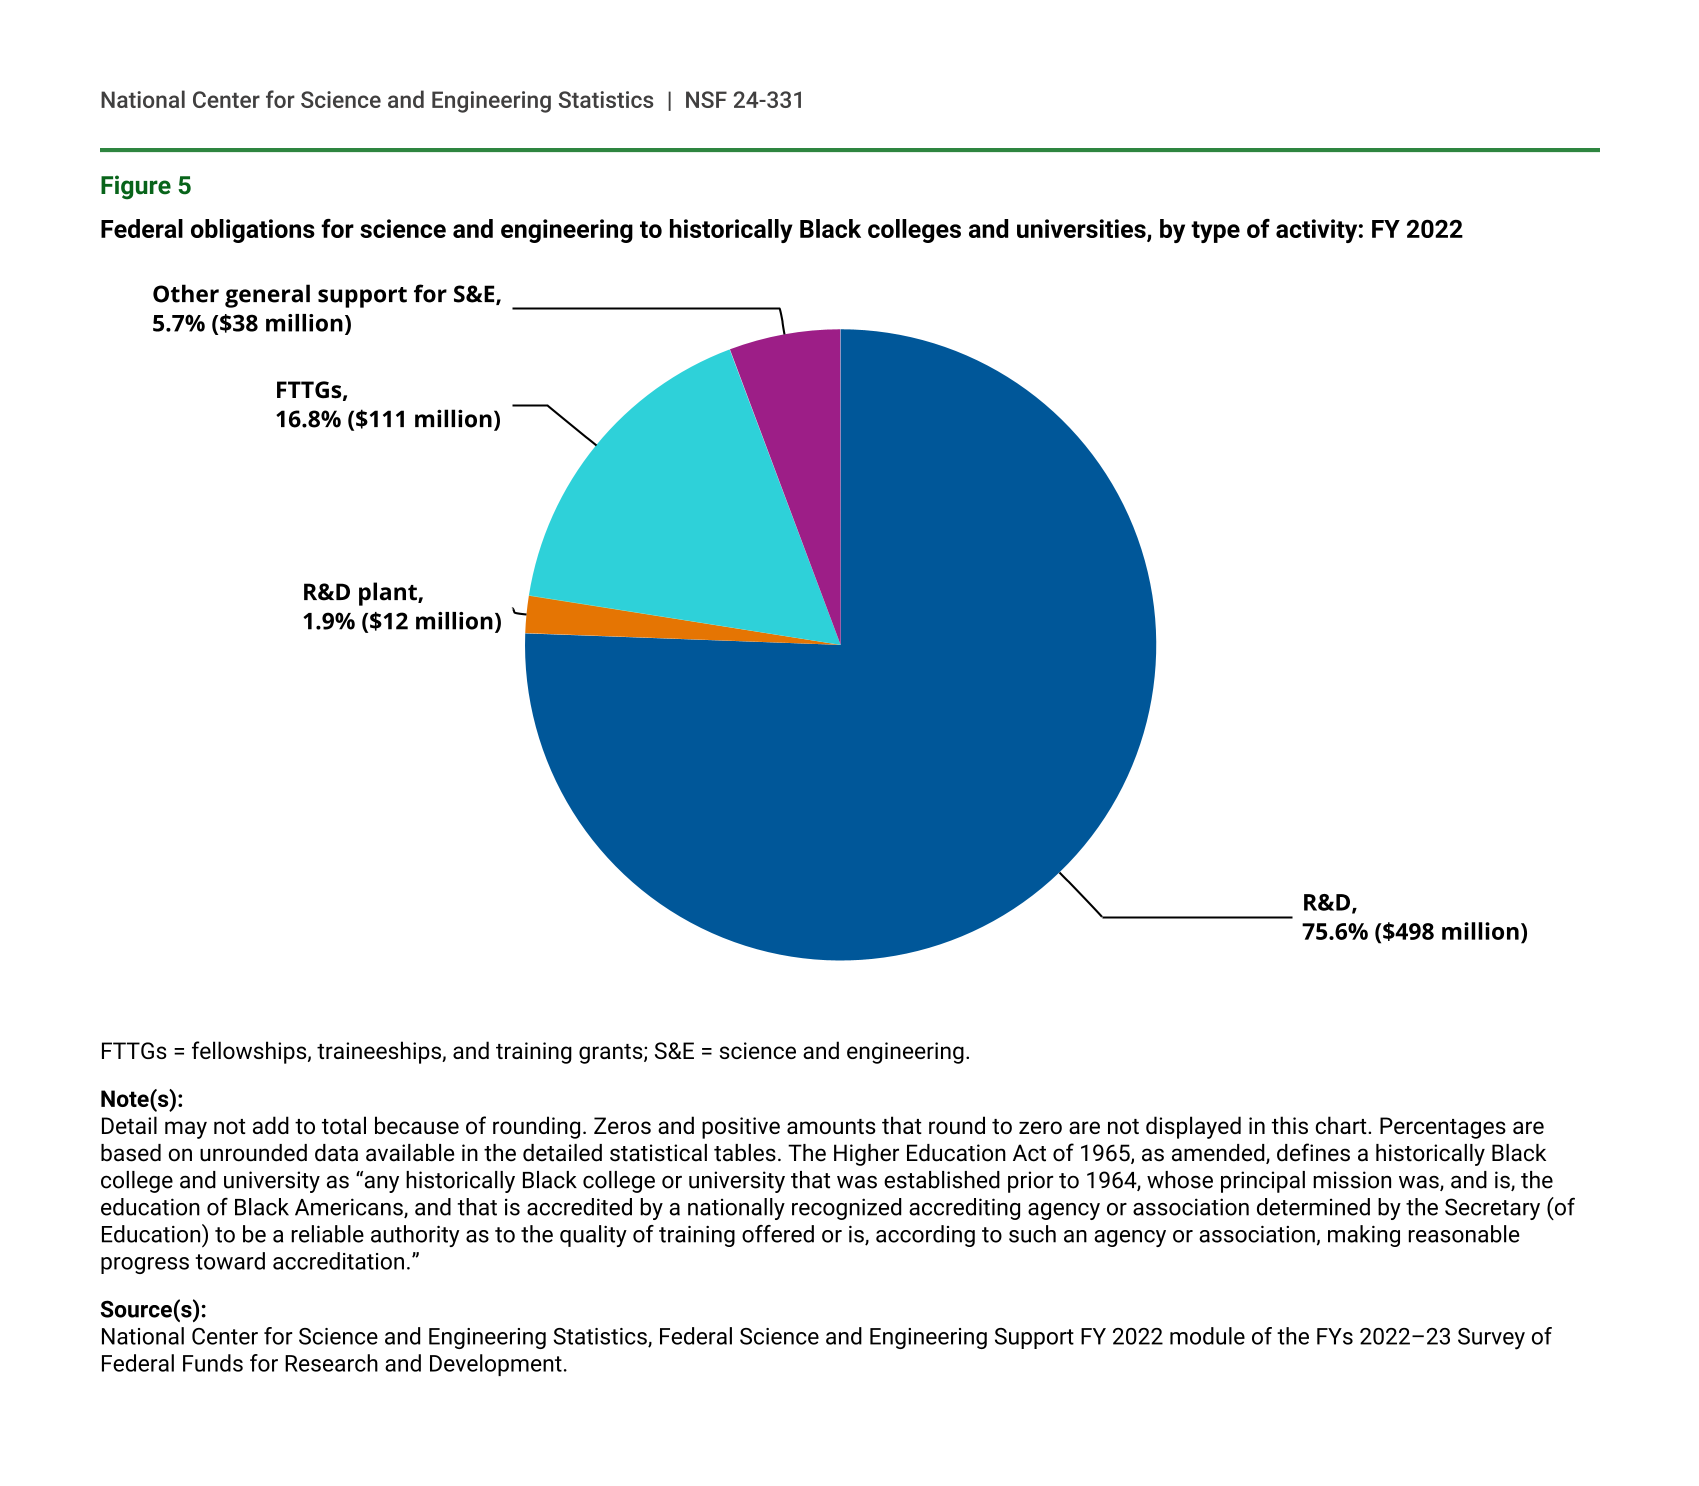
FY 2022, federal agencies obligated funds to 59 HBCUs totaling $658 million. Federal support to HBCUs for R&D totaled $498 million, or 76% of total S&E support to HBCUs, whereas FTTGs to HBCUs accounted for $111 million, or 17% of total federal S&E support (figure 5). The shares of R&D and FTTGs support to HBCUs vary from those across all higher education institutions. The North Carolina Agricultural and Technical State University was the top recipient of federal S&E support among all HBCUs and ranked 157 out of all 1,089 higher education institutions receiving federal S&E support in FY 2022. More recently, the White House Office of Science and Technology Policy, National Science and Technology Council, issued a report “Advancing Research Capacity at High Research Activity Historically Black Colleges and Universities” that provides recommendations to advance research capacity at HBCUs.
Federal obligations for science and engineering to historically Black colleges and universities, by type of activity: FY 2022
| Type of support | Percent | $millions |
|---|---|---|
| R&D | 75.6 | 498 |
| R&D plant | 1.9 | 12 |
| Facilities and equipment for S&E instruction | 0.0 | 0 |
| FTTGs | 16.8 | 111 |
| Other general support for S&E | 5.7 | 38 |
FTTGs = fellowships, traineeships, and training grants; S&E = science and engineering.
Note(s):
Detail may not add to total because of rounding. Zeros and positive amounts that round to zero are not displayed in this chart. Percentages are based on unrounded data available in the detailed statistical tables. The Higher Education Act of 1965, as amended, defines a historically Black college and university as “any historically Black college or university that was established prior to 1964, whose principal mission was, and is, the education of Black Americans, and that is accredited by a nationally recognized accrediting agency or association determined by the Secretary (of Education) to be a reliable authority as to the quality of training offered or is, according to such an agency or association, making reasonable progress toward accreditation.”
Source(s):
National Center for Science and Engineering Statistics, Federal Science and Engineering Support FY 2022 module of the FYs 2022–23 Survey of Federal Funds for Research and Development.
Women’s Colleges and Universities
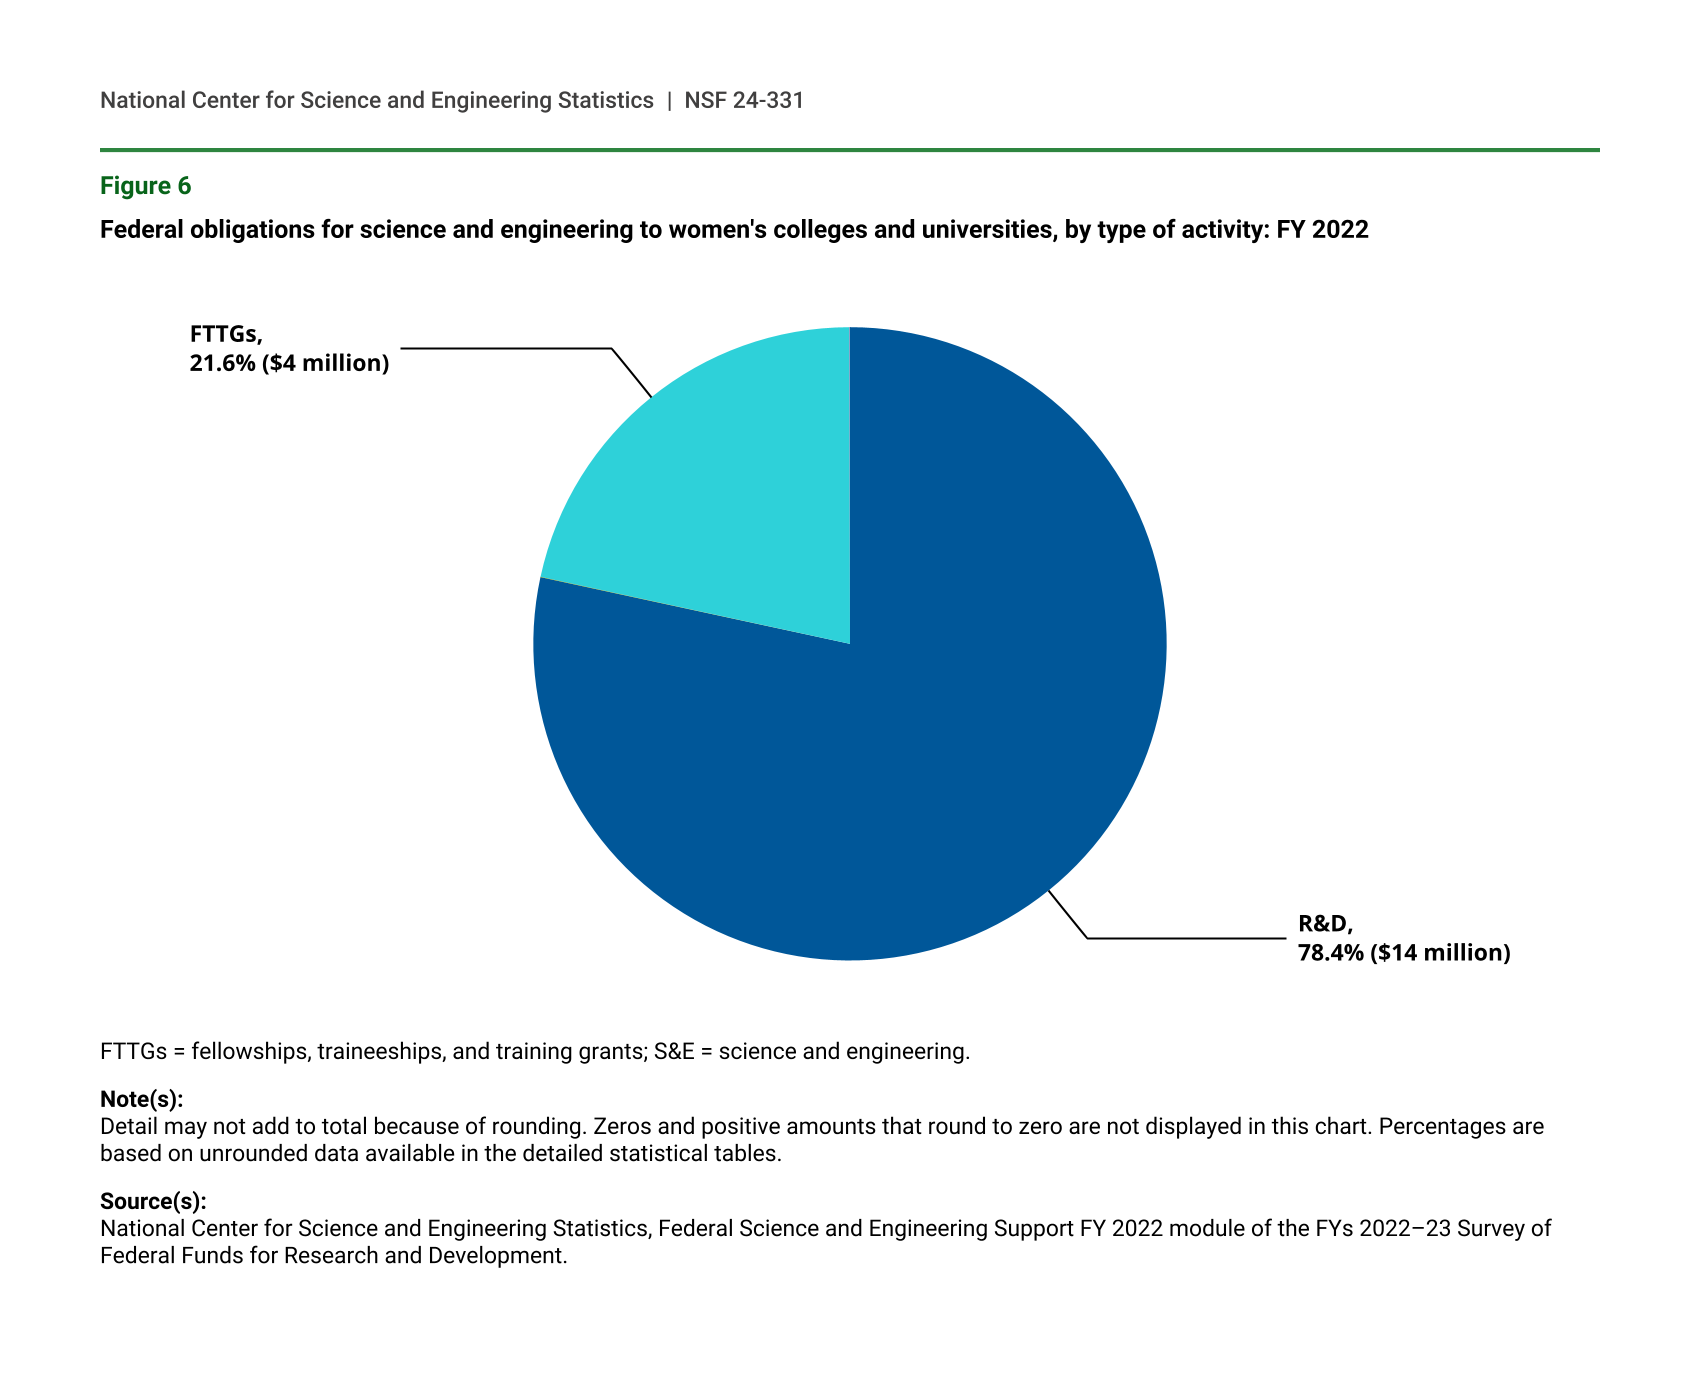
According to the Integrated Postsecondary Education Data System survey conducted by the National Center for Education Statistics, there were 32 higher education institutions identified as WCUs for the 2021–22 academic year. In FY 2022, total federal obligations for S&E support to these institutions totaled $17 million, with $14 million (78%) for R&D (figure 6). Of the $14 million in R&D, $4 million (26%) of federal R&D obligations to all WCUs was obligated to Spelman College (table 4). The only other form of S&E support was in the form of FTTGs, which totaled $4 million across 10 institutions. Although the $4 million in FTTGs is a relatively small amount, it does constitute 22% of total federal S&E support to WCUs, which is a greater share than the 4% obligated to all institutions. However, of the $4 million in FTTGs, Bryn Mawr College and Mount Saint Mary’s University each received $1 million in obligations, accounting for 60% of all FTTGs to WCUs. NSF is the leading agency to fund S&E at women’s colleges and universities with $12 million (67%), followed by HHS with $5 million (29%) (table 5). DOD and NASA accounted for 2% and 1%, respectively, of total federal funding to WCUs.
Federal obligations for science and engineering to women's colleges and universities, by type of activity: FY 2022
| Type of support | Percent | $millions |
|---|---|---|
| R&D | 78.4 | 14 |
| R&D plant | 0.0 | 0 |
| Facilities and equipment for S&E instruction | 0.0 | 0 |
| FTTGs | 21.6 | 4 |
| Other general support for S&E | 0.0 | 0 |
FTTGs = fellowships, traineeships, and training grants; S&E = science and engineering.
Note(s):
Detail may not add to total because of rounding. Zeros and positive amounts that round to zero are not displayed in this chart. Percentages are based on unrounded data available in the detailed statistical tables.
Source(s):
National Center for Science and Engineering Statistics, Federal Science and Engineering Support FY 2022 module of the FYs 2022–23 Survey of Federal Funds for Research and Development.
Federal obligations for science and engineering to women's colleges and universities, ranked by total amount received, by type of activity: FY 2022
S&E = science and engineering.
Note(s):
Detail may not add to total because of rounding. Institution order is based on total actual dollars received before amounts are rounded.
Source(s):
National Center for Science and Engineering Statistics, Federal Science and Engineering Support FY 2022 module of the FYs 2022–23 Survey of Federal Funds for Research and Development.
Federal obligations for science and engineering to women's colleges and universities, ranked by total amount received, by agency: FY 2022
DOD = Department of Defense; HHS = Department of Health and Human Services; NASA = National Aeronautics and Space Administration; NSF = National Science Foundation; SSA = Social Security Administration.
Note(s):
Detail may not add to total because of rounding. Institution order is based on total actual dollars received before amounts are rounded. Only those agencies that had obligations in the variables represented by this table appear in the table.
Source(s):
National Center for Science and Engineering Statistics, Federal Science and Engineering Support FY 2022 module of the FYs 2022–23 Survey of Federal Funds for Research and Development.
Data Sources, Limitations, and Availability
For FY 2022, data were obtained from 32 federal agencies (14 federal departments and 18 independent agencies) that had obligations for R&D during FY 2022 or FY 2023. Because multiple subdivisions of some federal departments completed the survey, there were 72 agency-level responses: 6 federal departments, 48 agencies (within another 8 federal departments), and 18 independent agencies. However, lower offices could also be authorized to enter data: in the Federal Funds for R&D nomenclature, agency-level offices could authorize program offices, program offices could authorize field offices, and field offices could authorize branch offices. When these suboffices are included, there were 725 total respondents: 72 agencies, 95 program offices, 178 field offices, and 380 branch offices. Of these, 47 agencies, 59 program offices, 72 field offices, and 22 branch offices reported obligations within the Federal S&E Support module. The module collects federal S&E support data by funding agency, individually named institution, type of activity, type of institution, and geographic location.
The six funding categories of federal S&E support are defined as follows:
- Research and experimental development (R&D) includes all direct, indirect, incidental, or related costs resulting from or necessary to perform R&D by private individuals and organizations under grant, contract, or cooperative agreement.
- R&D plant includes all projects whose principal purpose is to provide support for construction, acquisition, renovation, modification, repair, or rental of facilities, land, works, or fixed equipment for use in scientific or engineering R&D.
- Facilities and equipment for S&E instruction includes all programs whose principal purpose is to provide support for construction, acquisition, renovation, modification, repair, or rental of facilities, land, works, or equipment for use in instruction in S&E.
- Fellowships, traineeships, and training grants (FTTGs) includes all fellowship, traineeship, and training grant programs that are directed primarily toward the development and maintenance of the scientific workforce.
- General support for S&E includes funds used for scientific projects and support for activities within a specified discipline; explicit purpose is not specified.
- Other S&E activities includes all academic S&E obligations that cannot be assigned elsewhere and activities in support of technical conferences, teacher institutes, and programs aimed at increasing precollege and undergraduate students' scientific knowledge.
The Federal Science and Engineering Support module within Federal Funds for R&D is a census of federal agencies that fund R&D and S&E support. As such, there is no sampling error; however, survey data are still subject to some degree of unmeasured nonsampling error, which may include errors in classification or measurement of certain aspects of an agency’s S&E support. For additional information, see the “Survey Quality Measures” within the Technical Notes of the survey. The full set of data tables on the FY 2022 Survey of Federal Science and Engineering Support to Universities, Colleges, and Nonprofit Institutions are available at https://ncses.nsf.gov/surveys/federal-support-survey/2022#data. Data for the survey are also available in NCSES's interactive data tool.
Notes
1Obligations represent the amount for orders placed, contracts awarded, services received, and similar transactions during a given period, regardless of when the funds were appropriated or when future payment of money is required.
2Analytical Perspectives, Budget of the U.S. Government, Fiscal Year 2025, Chapter 6. Research and Development, p.55. Available at https://www.whitehouse.gov/wp-content/uploads/2024/03/ap_6_research_fy2025.pdf.
3Although some types of minority-serving institutions, such as TCUs and HBCUs, may be mutually exclusive, by definition, others may not be as the classifications are based on percentage of population enrollment thresholds. At the same time, WCUs are self-designated in their reporting to the Integrated Postsecondary Education Data System.
4The full list of recipient institutions are available in the full set of data tables: table 17.
5HHEs includes those institutions of higher education whose full-time equivalent (FTE) enrollment of undergraduate students is at least 25% Hispanic, according to fall 2022 enrollment data self-reported by the institutions in the Integrated Postsecondary Education Data System survey conducted by the National Center for Education Statistics (NCES). NCES determined FTE enrollment by calculating that approximately three part-time students are equivalent to one full-time student. The full list of HHEs receiving federal S&E support are in the full set of data tables: table 26.
6Details available in the full set of data tables: table 26.
7Details available in the full set of data tables: table 17.
8Details available in the full set of data tables: table 26.
9This list of HAIE institutions includes those institutions of higher education that are not tribal colleges or universities and that have an enrollment of undergraduate students that is not less than 10% Native American students, according to fall 2022 enrollment data self-reported by the institutions in the Integrated Postsecondary Education Data System survey conducted by the National Center for Education Statistics.
10Details available in the full set of data tables: table 17.
11The list of TCUs is from the White House Initiative on American Indian and Alaska Native Education (see https://sites.ed.gov/whiaiane/). In accordance with Executive Order No. 13270, "Tribal Colleges and Universities," as extended by Executive Order No. 13316, the list includes all of the colleges cited in section 532 of the Equity in Educational Land-Grant Status Act of 1994 (7 U.S.C. 301 note), any other institution that qualifies for funding under the Tribally Controlled Community College Assistance Act of 1978 (25 U.S.C. 1801 et seq.), and Diné College, which is authorized in the Navajo Community College Assistance Act of 1978, Public Law 95-471, title II (25 U.S.C. 640a note). The statutory definition of American Indian tribally controlled colleges and universities, to which the Higher Education Act refers at §316(b)(3), 20 U.S.C. 1059c(b)(3), is in section 2(a)(4) of the Tribally Controlled College and University Assistance Act of 1978, 25 U.S.C. 1801(a)(4).
12Details available in the full set of data tables: table 27.
13For a detailed discussion of federal S&E Support to HBCUs in FY 2022, see; National Center for Science and Engineering Statistics (NCSES). 2024. Federal Science and Engineering Support for Academic Institutions Increased 3% in FY 2022; Support to HBCUs Increased 19%. NSF 24-325. Alexandria, VA: U.S. National Science Foundation. Available at https://ncses.nsf.gov/pubs/nsf24325/.
14Details available in the full set of data tables: table 17 and table 22.
15Report is available at https://www.whitehouse.gov/ostp/news-updates/2024/05/15/nstc-advancing-research-capacity-at-high-research-activity-historically-black-colleges-and-universities/.
16WCU designations by the National Center for Education Statistics are self-reported by the institutions’ reporting to the Integrated Postsecondary Education Data System. For the full list of institutions, see https://nces.ed.gov/programs/digest/d22/tables/dt22_312.30.asp.
Suggested Citation
National Center for Science and Engineering Statistics (NCSES). 2024. FY 2022 Federal Science and Engineering Support to Selected Types of Minority-Serving Institutions. NSF 24-331. Alexandria, VA: U.S. National Science Foundation. Available at https://ncses.nsf.gov/pubs/nsf24331.
Contact Us
NCSES
National Center for Science and Engineering Statistics
Directorate for Social, Behavioral and Economic Sciences
U.S. National Science Foundation
2415 Eisenhower Avenue, Suite W14200
Alexandria, VA 22314
Tel: (703) 292-8780
FIRS: (800) 877-8339
TDD: (800) 281-8749
E-mail: ncsesweb@nsf.gov
NSF 24-331
|July 22, 2024