 An official website of the United States government

Federal Science and Engineering Support for Academic Institutions Increased 3% in FY 2022; Support to HBCUs Increased 19%
Federal agency obligations to higher education institutions for support of science and engineering (S&E) activities totaled $44.6 billion in FY 2022, an increase of 3.3% from the $43.2 billion in FY 2021 (table 1). S&E support is composed of five main categories: research and experimental development (R&D); R&D plant; facilities and equipment for instruction in S&E; fellowships, traineeships, and training grants (FTTGs); and other general support for S&E. In FY 2022, R&D was the largest component of S&E support ($41.3 billion), an increase of 4.6% from the FY 2021 total of $39.5 billion. Federal obligations for FTTGs totaled $1.9 billion in FY 2022, increasing 11.0% from the FY 2021 total of $1.8 billion.
Federal obligations for science and engineering to universities and colleges, by type of activity: FYs 2021–22
S&E = science and engineering; FTTGs = fellowships, traineeships, and training grants.
a Category was General support for S&E through 2020; as of 2021, the category was changed to Other general support for S&E and includes the obligations previously reported under Other S&E activities.
Note(s):
Detail may not add to total because of rounding.
Source(s):
National Center for Science and Engineering Statistics, Federal Science and Engineering Support module of the Survey of Federal Funds for Research and Development.
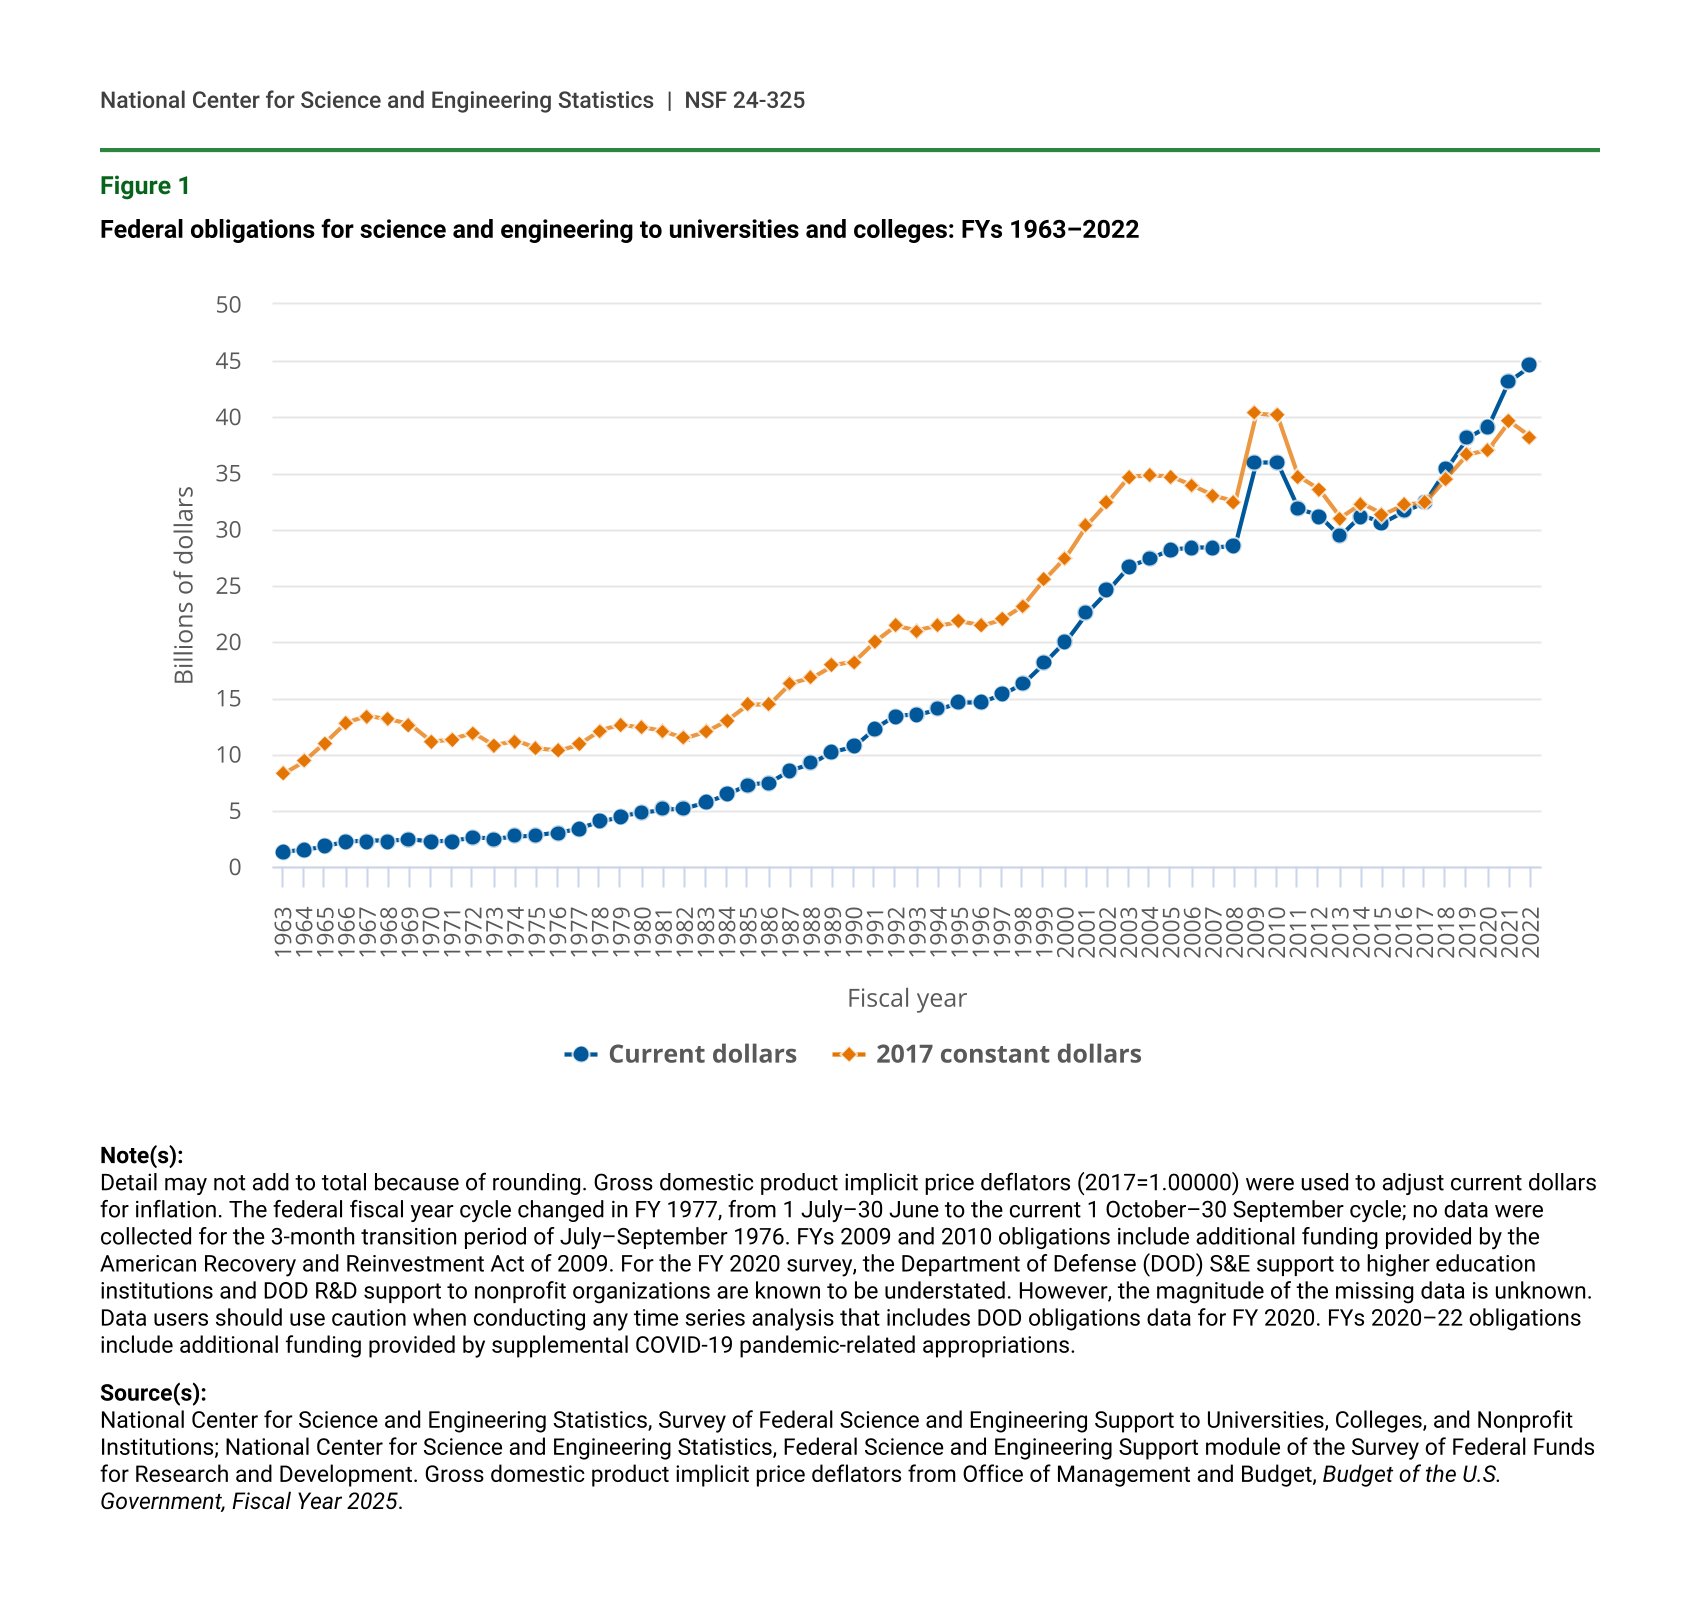
FY 2022 obligations for S&E support to higher education reached an all-time high in current dollars ($44.6 billion); however, when adjusted for inflation, federal obligations showed a decrease of 3.5% from FY 2021 to $38.2 billion in constant dollars (figure 1). Furthermore, the constant dollar adjustment showed that the FY 2022 total was below the high of $40.3 billion set in FY 2009 when federal obligations were supported with funding from the American Recovery and Reinvestment Act. Unless otherwise noted, all data presented in this report are in current dollars. These and other estimates in this InfoBrief are from the FY 2022 Federal Science and Engineering Support module within the Survey of Federal Funds for Research and Development (Federal Funds for R&D) (see “Data Sources, Limitations, and Availability” for more details), conducted by the National Center for Science and Engineering Statistics (NCSES) within the U.S. National Science Foundation (NSF).
Federal obligations for science and engineering to universities and colleges: FYs 1963–2022
| Fiscal year | Current dollars | 2017 constant dollars |
|---|---|---|
| 1963 | 1.3 | 8.3 |
| 1964 | 1.5 | 9.4 |
| 1965 | 1.8 | 11.0 |
| 1966 | 2.2 | 12.8 |
| 1967 | 2.3 | 13.4 |
| 1968 | 2.3 | 13.1 |
| 1969 | 2.4 | 12.6 |
| 1970 | 2.2 | 11.1 |
| 1971 | 2.3 | 11.3 |
| 1972 | 2.6 | 11.9 |
| 1973 | 2.5 | 10.8 |
| 1974 | 2.7 | 11.2 |
| 1975 | 2.8 | 10.5 |
| 1976 | 3.0 | 10.3 |
| 1977 | 3.4 | 10.9 |
| 1978 | 4.0 | 12.1 |
| 1979 | 4.5 | 12.6 |
| 1980 | 4.8 | 12.4 |
| 1981 | 5.1 | 12.0 |
| 1982 | 5.2 | 11.4 |
| 1983 | 5.7 | 12.0 |
| 1984 | 6.4 | 13.0 |
| 1985 | 7.3 | 14.4 |
| 1986 | 7.5 | 14.4 |
| 1987 | 8.6 | 16.3 |
| 1988 | 9.2 | 16.8 |
| 1989 | 10.2 | 17.9 |
| 1990 | 10.7 | 18.2 |
| 1991 | 12.3 | 20.0 |
| 1992 | 13.4 | 21.4 |
| 1993 | 13.5 | 21.0 |
| 1994 | 14.0 | 21.4 |
| 1995 | 14.6 | 21.8 |
| 1996 | 14.6 | 21.4 |
| 1997 | 15.3 | 22.0 |
| 1998 | 16.3 | 23.2 |
| 1999 | 18.1 | 25.5 |
| 2000 | 20.0 | 27.5 |
| 2001 | 22.6 | 30.4 |
| 2002 | 24.6 | 32.5 |
| 2003 | 26.7 | 34.7 |
| 2004 | 27.4 | 34.8 |
| 2005 | 28.2 | 34.7 |
| 2006 | 28.4 | 33.9 |
| 2007 | 28.4 | 33.0 |
| 2008 | 28.6 | 32.5 |
| 2009 | 35.9 | 40.3 |
| 2010 | 35.9 | 40.1 |
| 2011 | 31.8 | 34.7 |
| 2012 | 31.2 | 33.5 |
| 2013 | 29.4 | 31.0 |
| 2014 | 31.2 | 32.3 |
| 2015 | 30.6 | 31.3 |
| 2016 | 31.6 | 32.2 |
| 2017 | 32.4 | 32.4 |
| 2018 | 35.3 | 34.5 |
| 2019 | 38.1 | 36.6 |
| 2020 | 39.1 | 37.1 |
| 2021 | 43.2 | 39.6 |
| 2022 | 44.6 | 38.2 |
Note(s):
Detail may not add to total because of rounding. Gross domestic product implicit price deflators (2017=1.00000) were used to adjust current dollars for inflation. The federal fiscal year cycle changed in FY 1977, from 1 July–30 June to the current 1 October–30 September cycle; no data were collected for the 3-month transition period of July–September 1976. FYs 2009 and 2010 obligations include additional funding provided by the American Recovery and Reinvestment Act of 2009. For the FY 2020 survey, the Department of Defense (DOD) S&E support to higher education institutions and DOD R&D support to nonprofit organizations are known to be understated. However, the magnitude of the missing data is unknown. Data users should use caution when conducting any time series analysis that includes DOD obligations data for FY 2020. FYs 2020–22 obligations include additional funding provided by supplemental COVID-19 pandemic-related appropriations.
Source(s):
National Center for Science and Engineering Statistics, Survey of Federal Science and Engineering Support to Universities, Colleges, and Nonprofit Institutions; National Center for Science and Engineering Statistics, Federal Science and Engineering Support module of the Survey of Federal Funds for Research and Development. Gross domestic product implicit price deflators from Office of Management and Budget, Budget of the U.S. Government, Fiscal Year 2025.
Federal Agency S&E Obligations to All Institutions of Higher Education
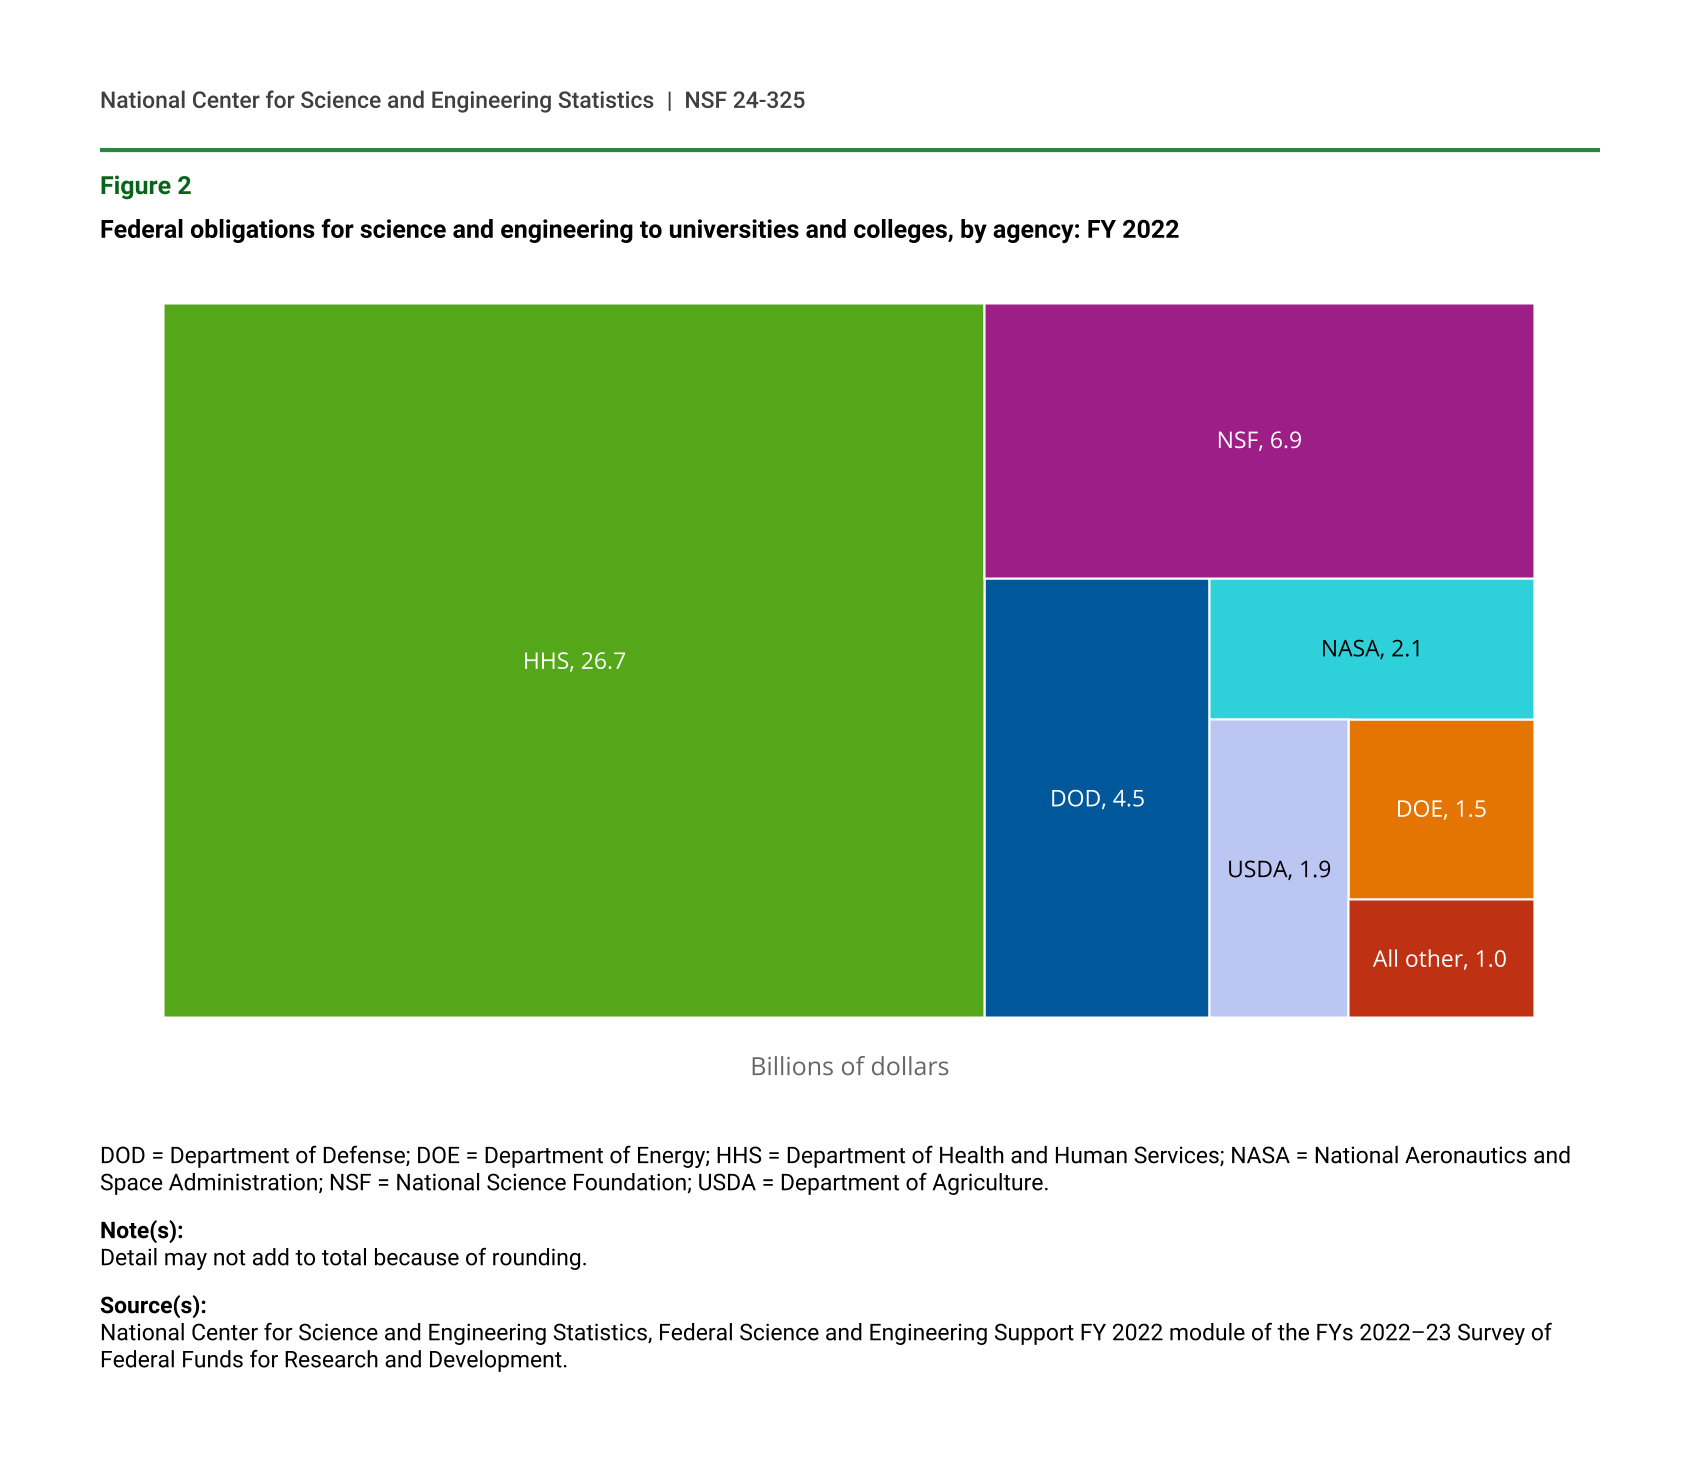
In FY 2022, the Department of Health and Human Services (HHS) obligated $26.7 billion for S&E support to higher education institutions, or 60% of the federal total (figure 2). NSF, the second-largest funding agency, accounted for $6.9 billion (16% of the total), followed by the Department of Defense (DOD) at $4.5 billion (10%). The National Aeronautics and Space Administration (NASA) and the Department of Agriculture (USDA) obligated $2.1 billion (5%) and $1.9 billion (4%), respectively. The Department of Energy (DOE) obligations totaled $1.5 billion (3%), and all other agencies combined totaled $1.0 billion (2%).
Federal obligations for science and engineering to universities and colleges, by agency: FY 2022
| Agency | Total S&E support ($billions) |
|---|---|
| DOD | 4.5 |
| DOE | 1.5 |
| HHS | 26.7 |
| NASA | 2.1 |
| NSF | 6.9 |
| USDA | 1.9 |
| All other | 1.0 |
DOD = Department of Defense; DOE = Department of Energy; HHS = Department of Health and Human Services; NASA = National Aeronautics and Space Administration; NSF = National Science Foundation; USDA = Department of Agriculture.
Note(s):
Detail may not add to total because of rounding.
Source(s):
National Center for Science and Engineering Statistics, Federal Science and Engineering Support FY 2022 module of the FYs 2022–23 Survey of Federal Funds for Research and Development.
In FY 2022, federal agencies obligated funding to 1,089 institutions of higher education in the United States; however, the top 25 recipient institutions of federal obligations for S&E support accounted for $18.2 billion, or 41% of all federal funding to all institutions of higher education (table 2). Of the $18.2 billion obligated to these 25 institutions, $17.4 billion (96%) was for R&D and $609 million (3%) was for FTTGs. The top 100 recipient institutions combined received 80% ($35.7 billion) of all federal obligations for S&E support to higher education. Therefore, the remaining 989 institutions received a total of $8.9 billion in S&E support. Johns Hopkins University was the single largest recipient of federal obligations for S&E ($1.8 billion), followed by the University of Washington ($928 million).
Federal obligations for science and engineering to universities and colleges, ranked by total amount received, by type of activity: FY 2022
* = amount greater than $0 but less than $500,000.00.
S&E = science and engineering.
Note(s):
Detail may not add to total because of rounding. Institution order is based on total actual dollars received before amounts are rounded.
Source(s):
National Center for Science and Engineering Statistics, Federal Science and Engineering Support FY 2022 module of the FYs 2022–23 Survey of Federal Funds for Research and Development.
Federal S&E Obligations to Historically Black Colleges and Universities
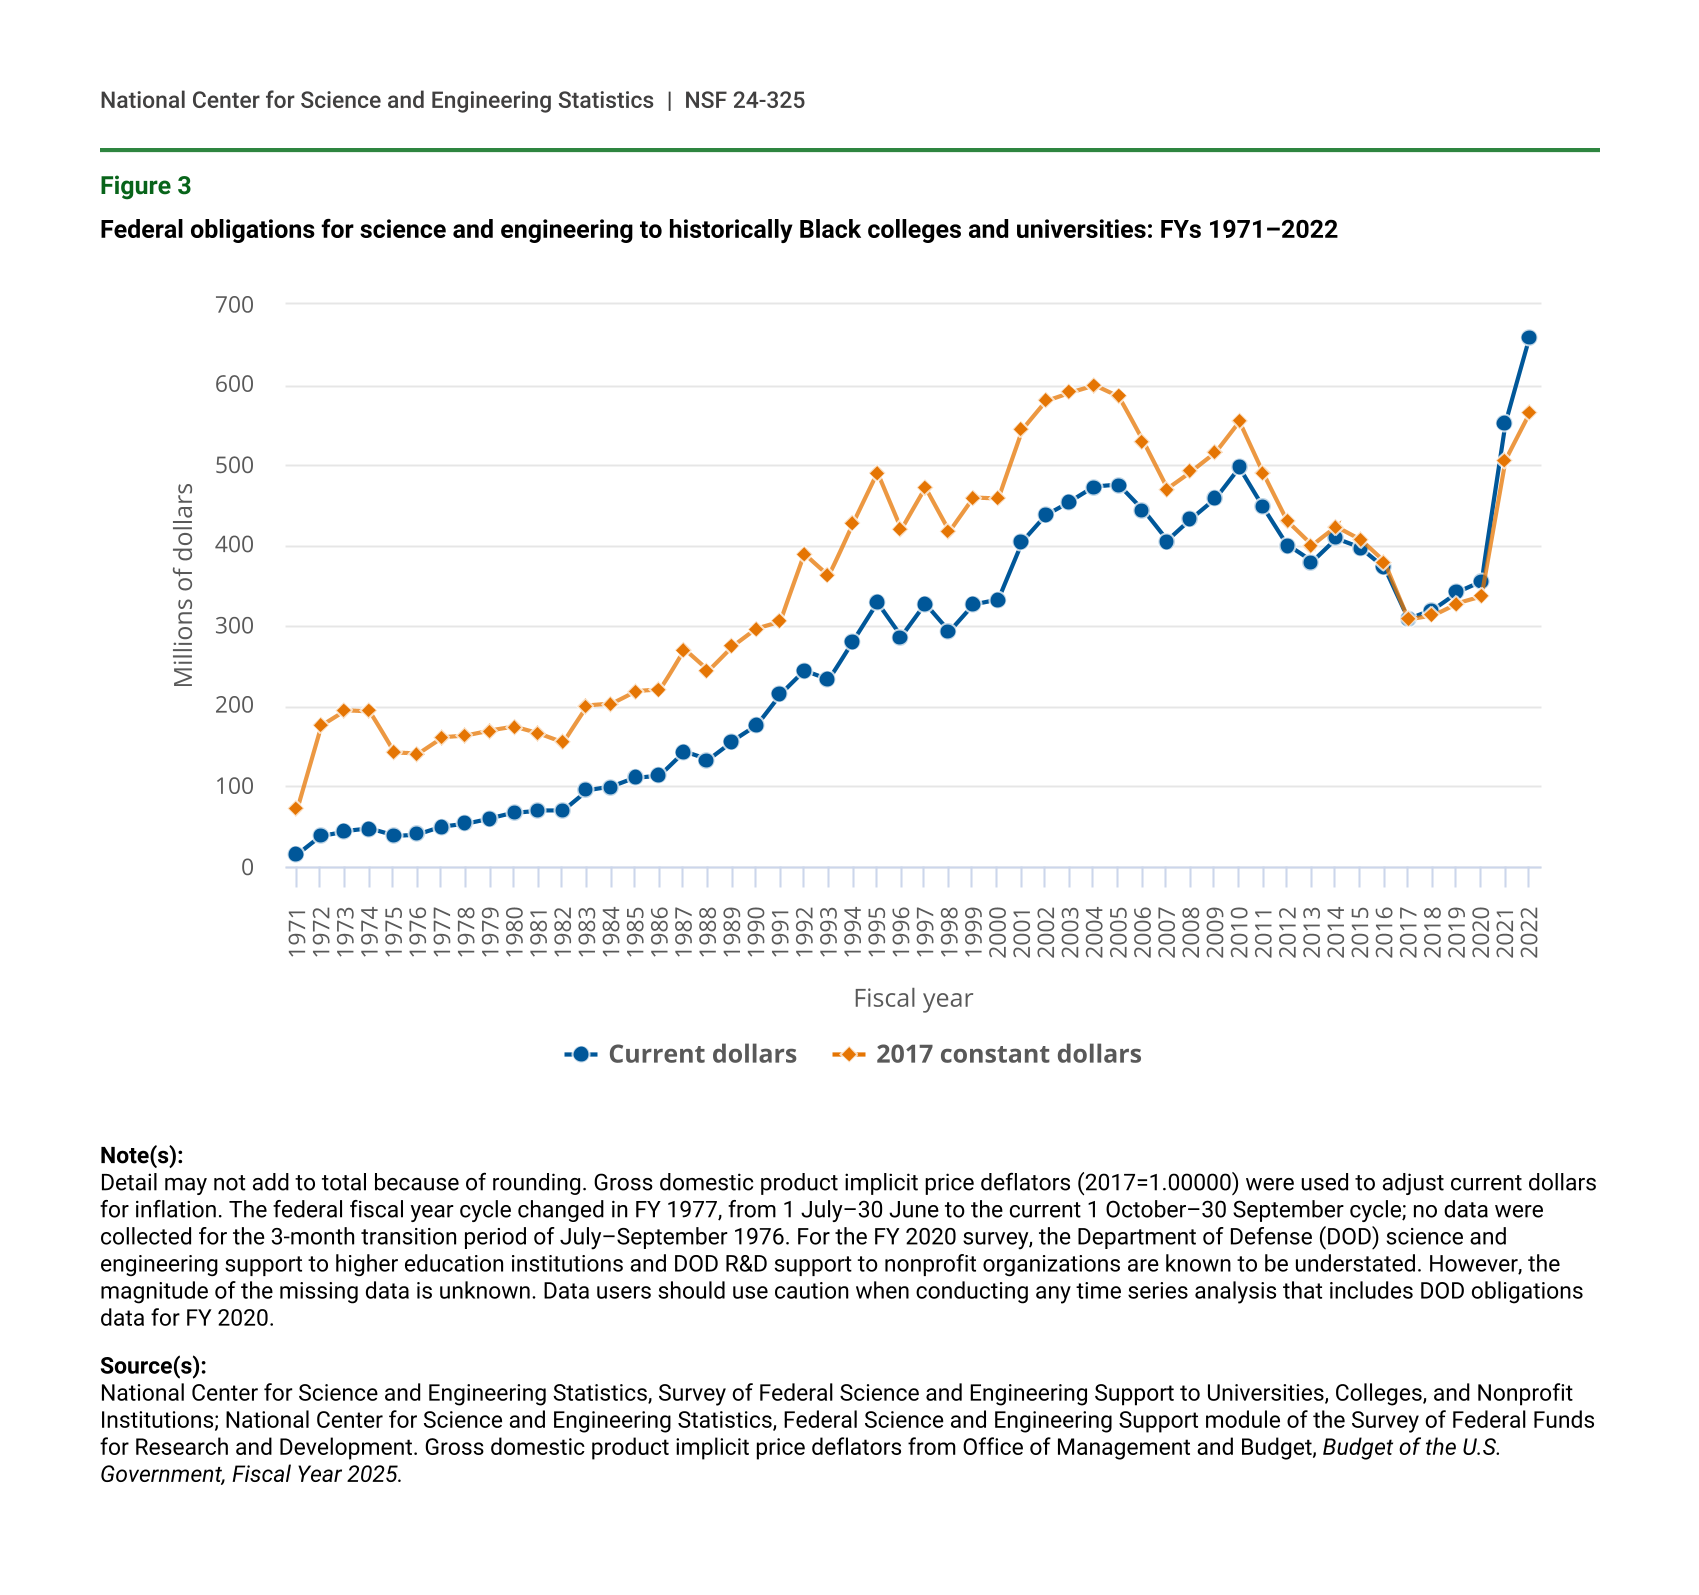
Although federal obligations for S&E support across all institutions increased 3.3% in FY 2022, federal obligations to historically Black colleges and universities (HBCUs) for S&E support increased 19.2%, from $552 million in FY 2021 to $658 million in FY 2022 (figure 3). When adjusted for inflation, federal obligations to HBCUs increased 11.4%, from $506 million in FY 2021 to $564 million in FY 2022. Although the adjustment to constant dollars shows S&E support continually increasing since FY 2017, the FY 2022 amount is below the previous high of $599 million that was set in FY 2004 (constant dollars).
Federal obligations for science and engineering to historically Black colleges and universities: FYs 1971–2022
| Fiscal year | Current dollars | 2017 constant dollars |
|---|---|---|
| 1971 | 15.1 | 72.4 |
| 1972 | 38.4 | 176.2 |
| 1973 | 44.3 | 195.0 |
| 1974 | 47.0 | 193.2 |
| 1975 | 38.3 | 142.4 |
| 1976 | 40.5 | 141.0 |
| 1977 | 49.7 | 161.3 |
| 1978 | 53.7 | 163.3 |
| 1979 | 60.2 | 169.3 |
| 1980 | 67.2 | 174.0 |
| 1981 | 70.4 | 165.8 |
| 1982 | 70.3 | 154.9 |
| 1983 | 94.9 | 200.3 |
| 1984 | 99.4 | 202.6 |
| 1985 | 110.7 | 218.3 |
| 1986 | 114.0 | 220.0 |
| 1987 | 143.5 | 270.8 |
| 1988 | 133.4 | 243.7 |
| 1989 | 156.3 | 274.5 |
| 1990 | 175.2 | 296.8 |
| 1991 | 214.4 | 305.8 |
| 1992 | 243.9 | 389.2 |
| 1993 | 232.6 | 362.7 |
| 1994 | 281.1 | 429.0 |
| 1995 | 328.7 | 491.2 |
| 1996 | 286.4 | 420.0 |
| 1997 | 327.3 | 471.7 |
| 1998 | 292.9 | 416.9 |
| 1999 | 326.7 | 459.3 |
| 2000 | 332.6 | 458.1 |
| 2001 | 404.4 | 543.8 |
| 2002 | 437.9 | 579.7 |
| 2003 | 454.7 | 590.6 |
| 2004 | 472.7 | 599.3 |
| 2005 | 475.3 | 584.8 |
| 2006 | 443.9 | 529.0 |
| 2007 | 405.5 | 470.3 |
| 2008 | 432.8 | 491.8 |
| 2009 | 458.0 | 515.1 |
| 2010 | 497.1 | 554.2 |
| 2011 | 447.6 | 489.3 |
| 2012 | 400.3 | 429.8 |
| 2013 | 379.6 | 400.3 |
| 2014 | 408.4 | 422.9 |
| 2015 | 397.2 | 407.2 |
| 2016 | 373.0 | 379.3 |
| 2017 | 307.9 | 307.9 |
| 2018 | 319.7 | 312.7 |
| 2019 | 341.4 | 327.9 |
| 2020 | 354.4 | 336.0 |
| 2021 | 552.2 | 506.1 |
| 2022 | 658.4 | 564.0 |
Note(s):
Detail may not add to total because of rounding. Gross domestic product implicit price deflators (2017=1.00000) were used to adjust current dollars for inflation. The federal fiscal year cycle changed in FY 1977, from 1 July–30 June to the current 1 October–30 September cycle; no data were collected for the 3-month transition period of July–September 1976. For the FY 2020 survey, the Department of Defense (DOD) science and engineering support to higher education institutions and DOD R&D support to nonprofit organizations are known to be understated. However, the magnitude of the missing data is unknown. Data users should use caution when conducting any time series analysis that includes DOD obligations data for FY 2020.
Source(s):
National Center for Science and Engineering Statistics, Survey of Federal Science and Engineering Support to Universities, Colleges, and Nonprofit Institutions; National Center for Science and Engineering Statistics, Federal Science and Engineering Support module of the Survey of Federal Funds for Research and Development. Gross domestic product implicit price deflators from Office of Management and Budget, Budget of the U.S. Government, Fiscal Year 2025.
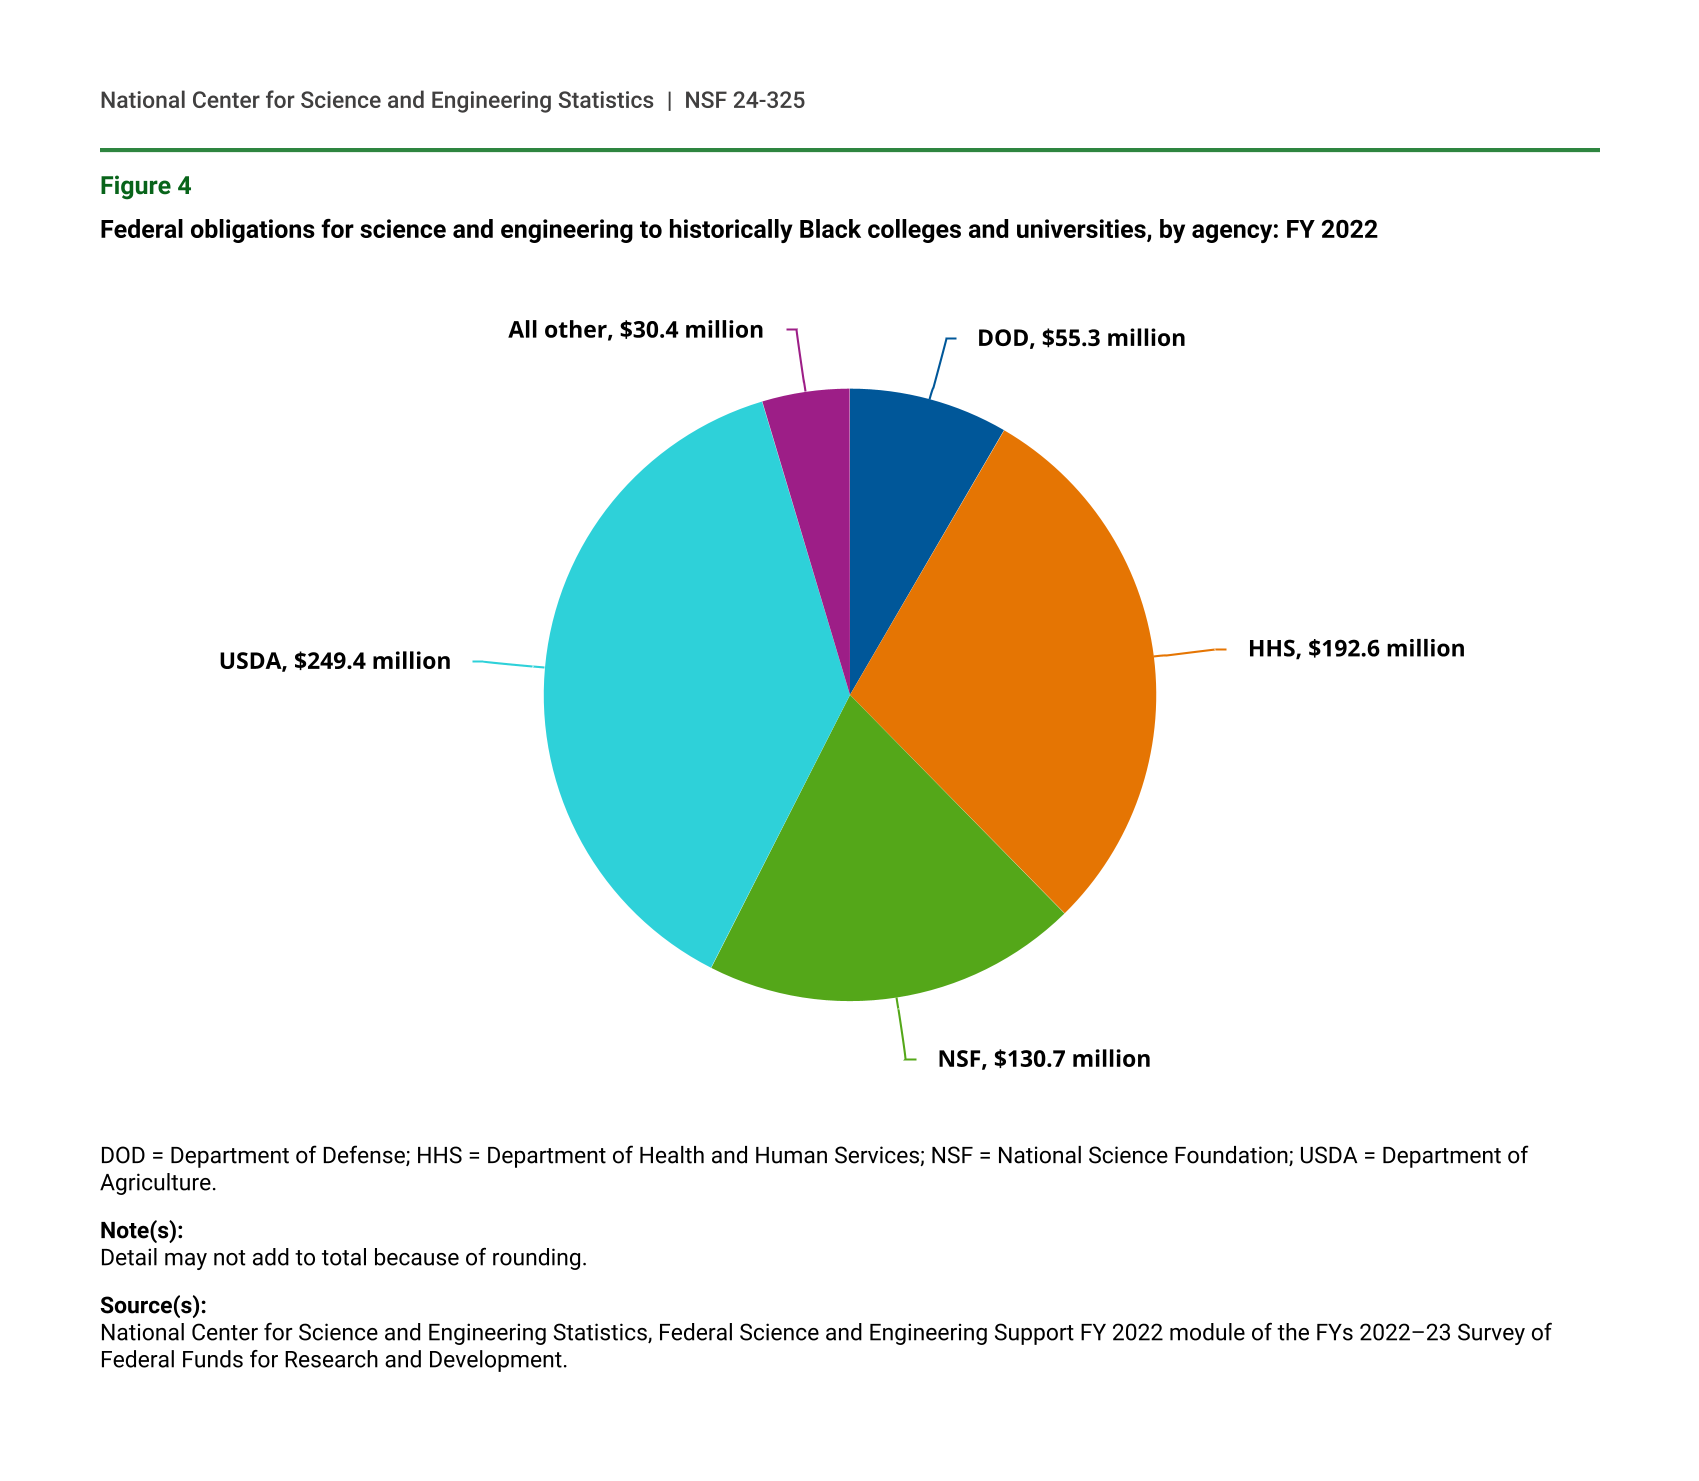
Fifty-nine of the nation’s 107 HBCUs received federal obligations for S&E activities in FY 2022. The USDA was the largest funder of S&E support to HBCUs with $249 million (38%). HHS and NSF had total S&E support obligations of $193 million (29%) and $131 million (20%), respectively (figure 4). DOD accounted for $55 million in obligations to HBCUs (8%), and all other agencies combined made up the difference of $30 million (5%). The 15 HBCUs receiving the largest amounts of federal S&E support accounted for nearly 66% ($431 million) of all S&E support obligations to HBCUs (table 3). These top 15 HBCUs also received 66% ($328 million) of all federal obligations for R&D to HBCUs, 58% ($64 million) of obligations for FTTGs, 91% ($11 million) of obligations for R&D plant, and 73% ($27 million) of other general support for S&E. In total, FTTGs’ share of all federal S&E support was much larger in HBCUs (17%) than in all universities and colleges (4%). Obligations for R&D plant represent a small proportion of overall S&E obligations within HBCUs and all academic institutions. In FY 2022, obligations to HBCUs for R&D plant totaled $12 million, or 2% of total S&E obligations to HBCUs. In comparison, R&D plant funding to all academic institutions totaled $513 million, or 1% of all S&E obligations. FY 2022 federal obligations to HBCUs for FTTGs and R&D plant increased 8.5% and 40.4%, respectively, from FY 2021. The relative emphasis on supporting research capacity reflects a longstanding approach by federal agencies to support research capacity in minority-serving institutions.
Federal obligations for science and engineering to historically Black colleges and universities, by agency: FY 2022
| Agency | Total S&E support ($millions) |
|---|---|
| DOD | 55.3 |
| HHS | 192.6 |
| NSF | 130.7 |
| USDA | 249.4 |
| All other | 30.4 |
DOD = Department of Defense; HHS = Department of Health and Human Services; NSF = National Science Foundation; USDA = Department of Agriculture.
Note(s):
Detail may not add to total because of rounding.
Source(s):
National Center for Science and Engineering Statistics, Federal Science and Engineering Support FY 2022 module of the FYs 2022–23 Survey of Federal Funds for Research and Development.
Federal obligations for science and engineering to historically Black colleges and universities, ranked by total amount received, by type of activity: FY 2022
HBCUs = historically Black colleges and universities; S&E = science and engineering.
a Excludes obligations for the university's foundation or auxiliary organization or some campuses or branches as those are not HBCU institutions.
Note(s):
Detail may not add to total because of rounding. Institution order is based on total actual dollars received before amounts are rounded.
Source(s):
National Center for Science and Engineering Statistics, Federal Science and Engineering Support FY 2022 module of the FYs 2022–23 Survey of Federal Funds for Research and Development.
Data Sources, Limitations, and Availability
Effective with the FY 2021 survey cycle, the Survey of Federal Science and Engineering Support to Universities, Colleges, and Nonprofit Institutions has been collected as a module within Federal Funds for R&D. For FY 2022, data were obtained from 32 federal agencies (14 federal departments and 18 independent agencies) that had obligations for R&D during FY 2022 or FY 2023. Because multiple subdivisions of some federal departments completed the survey, there were 72 agency-level responses: 6 federal departments, 48 agencies (within another 8 federal departments), and 18 independent agencies. However, lower offices could also be authorized to enter data: in the Federal Funds for R&D nomenclature, agency-level offices could authorize program offices, program offices could authorize field offices, and field offices could authorize branch offices. When these suboffices are included, there were 725 total respondents: 72 agencies, 95 program offices, 178 field offices, and 380 branch offices. Of these, 47 agencies, 59 program offices, 72 field offices, and 22 branch offices reported obligations within the Federal S&E Support module. The module collects federal S&E support data by funding agency, individually named institution, type of activity, type of institution, and geographic location.
The six funding categories of federal S&E support are defined as follows:
- Research and experimental development (R&D) includes all direct, indirect, incidental, or related costs resulting from or necessary to perform R&D by private individuals and organizations under grant, contract, or cooperative agreement.
- R&D plant includes all projects whose principal purpose is to provide support for construction, acquisition, renovation, modification, repair, or rental of facilities, land, works, or fixed equipment for use in scientific or engineering R&D.
- Facilities and equipment for S&E instruction includes all programs whose principal purpose is to provide support for construction, acquisition, renovation, modification, repair, or rental of facilities, land, works, or equipment for use in instruction in S&E.
- Fellowships, traineeships, and training grants (FTTGs) includes all fellowship, traineeship, and training grant programs that are directed primarily toward the development and maintenance of the scientific workforce.
- General support for S&E includes funds used for scientific projects and support for activities within a specified discipline; explicit purpose is not specified.
- Other S&E activities includes all academic S&E obligations that cannot be assigned elsewhere and activities in support of technical conferences, teacher institutes, and programs aimed at increasing precollege and undergraduate students' scientific knowledge.
The Federal Science and Engineering Support module within Federal Funds for R&D is a census of federal agencies that fund R&D and S&E support. As such, there is no sampling error; however, survey data are still subject to some degree of unmeasurable nonsampling error which may include errors in classification or measurement of certain aspects of an agency’s S&E support. For additional information, see “Survey Quality Measures” within the technical notes of the survey. The full set of data tables on the FY 2022 Survey of Federal Science and Engineering Support to Universities, Colleges, and Nonprofit Institutions are available at https://ncses.nsf.gov/surveys/federal-support-survey/2022/#data. Data for the survey are also available in NCSES's interactive data tool. For more information, please contact the survey manager.
Notes
1Obligations represent the amount for orders placed, contracts awarded, services received, and similar transactions during a given period, regardless of when the funds were appropriated or when future payment of money is required.
2Gross domestic product implicit price deflators were used to convert current dollars to constant 2017 dollars. Data on federal fiscal year historical figures, 1951–2023, can be found in Office of Management and Budget (OMB). 2024. Budget of the U.S. Government, Fiscal Year 2025. Historical Tables. Table 10.1. Gross Domestic Product and Deflators Used in the Historical Tables: 1940–2029. https://www.whitehouse.gov/omb/budget/historical-tables/. Current dollar obligations for R&D are from the National Center for Science and Engineering Statistics, Survey of Federal Funds for Research and Development.
3All other agencies include the Agency for International Development, Appalachian Regional Commission, Department of Homeland Security, Department of Commerce, Department of the Interior, Department of Justice, Department of Labor, Department of Transportation, Department of Education, Department of Housing and Urban Development, Environmental Protection Agency, Nuclear Regulatory Commission, and Social Security Administration.
4Details available in the full set of data tables: table 17.
5Johns Hopkins University includes the Applied Physics Laboratory, a University Affiliated Research Center (UARC). For more information on UARCs see https://rt.cto.mil/ffrdc-uarc/.
6The Higher Education Act of 1965, as amended, defines an HBCU as “any historically Black college or university that was established prior to 1964, whose principal mission was, and is, the education of Black Americans, and that is accredited by a nationally recognized accrediting agency or association determined by the Secretary (of Education) to be a reliable authority as to the quality of training offered or is, according to such an agency or association, making reasonable progress toward accreditation.”
7In FY 2022, all other agencies included the Department of Commerce, Department of Education, Department of Energy, Department of the Interior, Department of Transportation, National Aeronautics and Space Administration, and Social Security Administration. Details available in the full set of data tables: table 23.
8Details available in the full set of data tables: table 22 for FY 2021 and FY 2022.
Suggested Citation
National Center for Science and Engineering Statistics (NCSES). 2024. Federal Science and Engineering Support for Academic Institutions Increased 3% in FY 2022; Support to HBCUs Increased 19%. NSF 24-325. Alexandria, VA: U.S. National Science Foundation. Available at https://ncses.nsf.gov/pubs/nsf24325.
Contact Us
NCSES
Directorate for Social, Behavioral and Economic Sciences
National Science Foundation
2415 Eisenhower Avenue, Suite W14200
Alexandria, VA 22314
Tel: (703) 292-8780
FIRS: (800) 877-8339
TDD: (800) 281-8749
E-mail: ncsesweb@nsf.gov
NSF 24-325
|June 10, 2024