 An official website of the United States government

U.S. Nonprofits Spent $28 Billion on R&D Activities in FY 2022
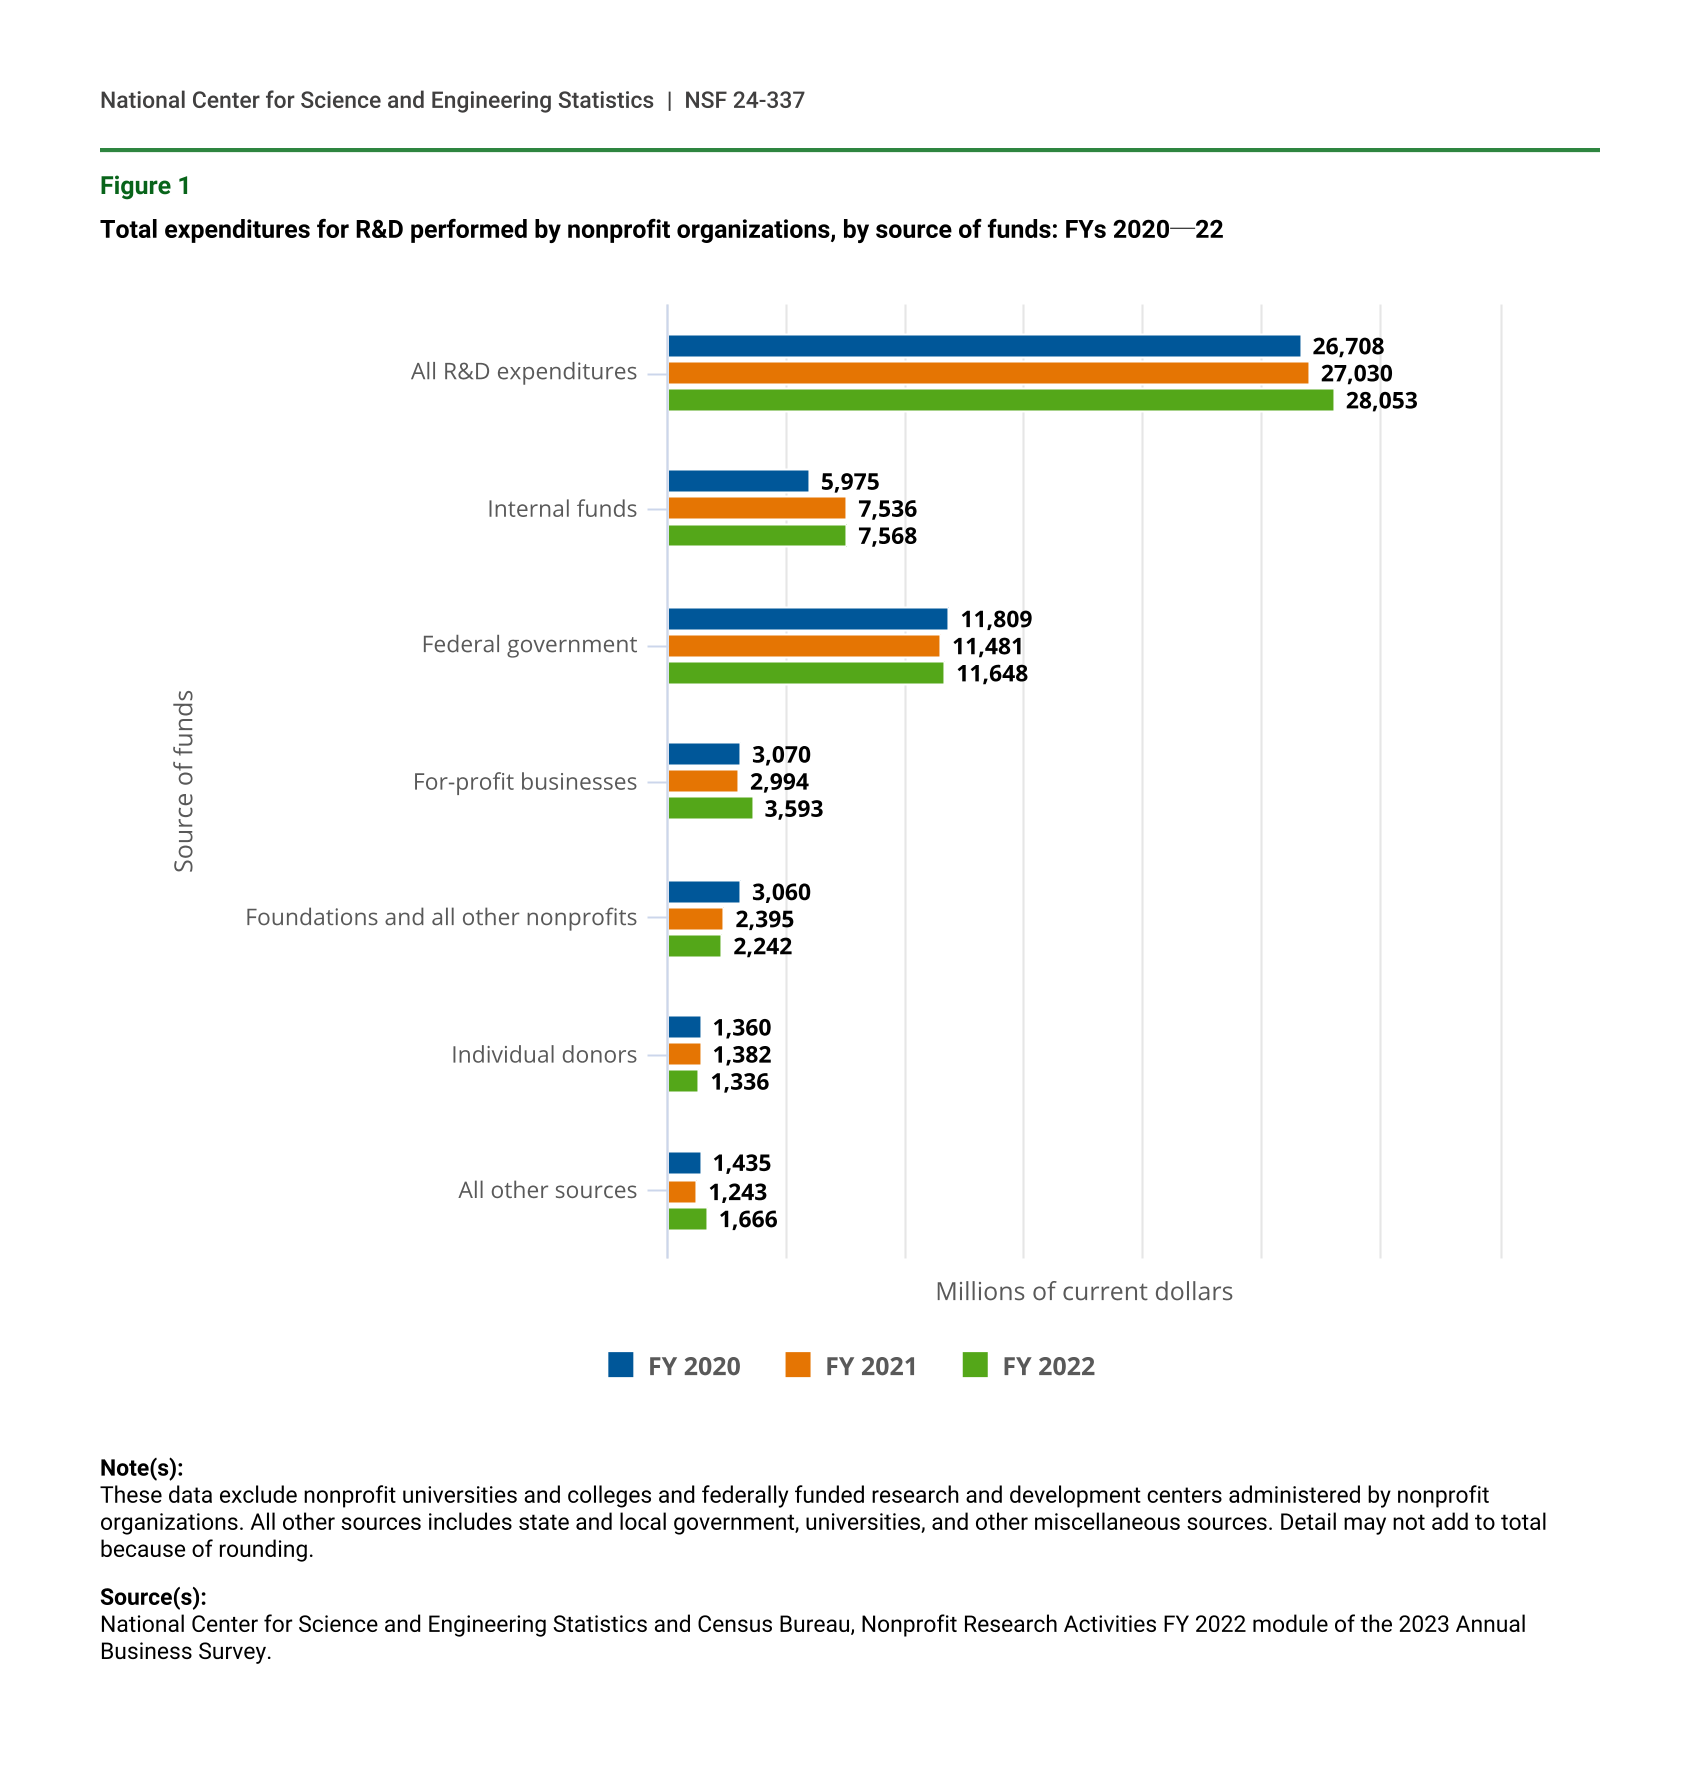
U.S. nonprofit organizations spent an estimated $28.1 billion on research and experimental development (R&D) performed within their organizations in FY 2022, an increase of 4% in current dollars from FY 2021 (figure 1).
Total expenditures for R&D performed by nonprofit organizations, by source of funds: FYs 2020─22
| Source of funds | FY 2020 | FY 2021 | FY 2022 |
|---|---|---|---|
| All R&D expenditures | 26,708 | 27,030 | 28,053 |
| Internal funds | 5,975 | 7,536 | 7,568 |
| Federal government | 11,809 | 11,481 | 11,648 |
| For-profit businesses | 3,070 | 2,994 | 3,593 |
| Foundations and all other nonprofits | 3,060 | 2,395 | 2,242 |
| Individual donors | 1,360 | 1,382 | 1,336 |
| All other sources | 1,435 | 1,243 | 1,666 |
Note(s):
These data exclude nonprofit universities and colleges and federally funded research and development centers administered by nonprofit organizations. All other sources includes state and local government, universities, and other miscellaneous sources. Detail may not add to total because of rounding.
Source(s):
National Center for Science and Engineering Statistics and Census Bureau, Nonprofit Research Activities FY 2022 module of the 2023 Annual Business Survey.
Data in this InfoBrief are from the Nonprofit Research Activities (NPRA) FY 2022 module of the 2023 Annual Business Survey, conducted by the Census Bureau for the National Center for Science and Engineering Statistics (NCSES) within the U.S. National Science Foundation.
Sources of Funding for Nonprofit R&D Performance
The largest funding source for nonprofit R&D performance in FY 2022 was the federal government, contributing $11.6 billion, or 42%, of the total. Nonprofit organizations’ own internal funds were the next largest source at $7.6 billion, or 27%, of the total. For-profit businesses funded $3.6 billion (13%), foundations and other nonprofits contributed $2.2 billion (8%), and individual donors contributed $1.3 billion (5%). The remaining sources contributed less than 6% to total nonprofit R&D performance.
Overall, total FY 2022 R&D expenditures within nonprofit organizations increased 4% over FY 2021 and 5% over FY 2020. The totals for federally funded research, internally funded research, and research funded by individual donors remained stable between FY 2021 and FY 2022. Three funding source categories saw significant increases or decreases in FY 2022. Funding from businesses increased by 20%, from $3.0 billion in FY 2021 to $3.6 billion in FY 2022. The category of all other sources, including state and local governments and universities, increased 34% from $1.2 billion in FY 2021 to $1.7 billion in FY 2022. Funding from foundations and other nonprofits decreased 6% from $2.4 billion in FY 2021 to $2.2 billion in FY 2022.
Nonprofit R&D Performance by Type of R&D
Nonprofits reported that nearly 50% ($13.9 billion) of their FY 2022 R&D performance was categorized as basic research and 33% ($9.3 billion) was applied research (table 1). The remaining 17%, or $4.9 billion, was categorized as experimental development. A higher proportion of the federally funded R&D total was spent on applied research (41%) compared to the nonfederally funded R&D total (28%).
Total expenditures for R&D performed by nonprofit organizations, by type of R&D and source of funds: FY 2022
i = more than 50% of the estimate is a combination of imputation and reweighting to account for nonresponse.
Note(s):
These data exclude nonprofit universities and colleges and federally funded research and development centers administered by nonprofit organizations. Detail may not add to total because of rounding.
Source(s):
National Center for Science and Engineering Statistics and Census Bureau, Nonprofit Research Activities FY 2022 module of the 2023 Annual Business Survey.
Nonprofit R&D Performance by Field
The vast majority (72%) of nonprofit R&D spending was again concentrated in biological, biomedical, and health sciences in FY 2022, and the total reported did not significantly differ from the total in FY 2021 (table 2).
Total expenditures for R&D performed by nonprofit organizations, by field: FYs 2021─22
Note(s):
These data exclude nonprofit universities and colleges and federally funded research and development centers administered by nonprofit organizations. Detail may not add to total because of rounding.
Source(s):
National Center for Science and Engineering Statistics and Census Bureau, Nonprofit Research Activities FY 2022 module of the 2023 Annual Business Survey.
Several fields experienced significant growth between FY 2021 and FY 2022. R&D in humanities increased 130% from FY 2021 ($56 million) to FY 2022 ($130 million), returning close to the FY 2020 total of $145 million. Mathematics, statistics, and computer and information sciences increased by 48%, from $711 million in FY 2021 to $1.1 billion in FY 2022. Agricultural sciences and natural resources and conservation also grew 48% from $651 million in FY 2021 to $961 million in FY 2022. Finally, geosciences, atmospheric sciences, and ocean sciences, which is still down from the $992 million reported in FY 2020, grew 37% from FY 2021 to FY 2022 ($402 million to $552 million).
Physical sciences significantly declined between FY 2021 and FY 2022, decreasing by 45% from $715 million to $391 million.
Nonprofit R&D Capital Expenditures
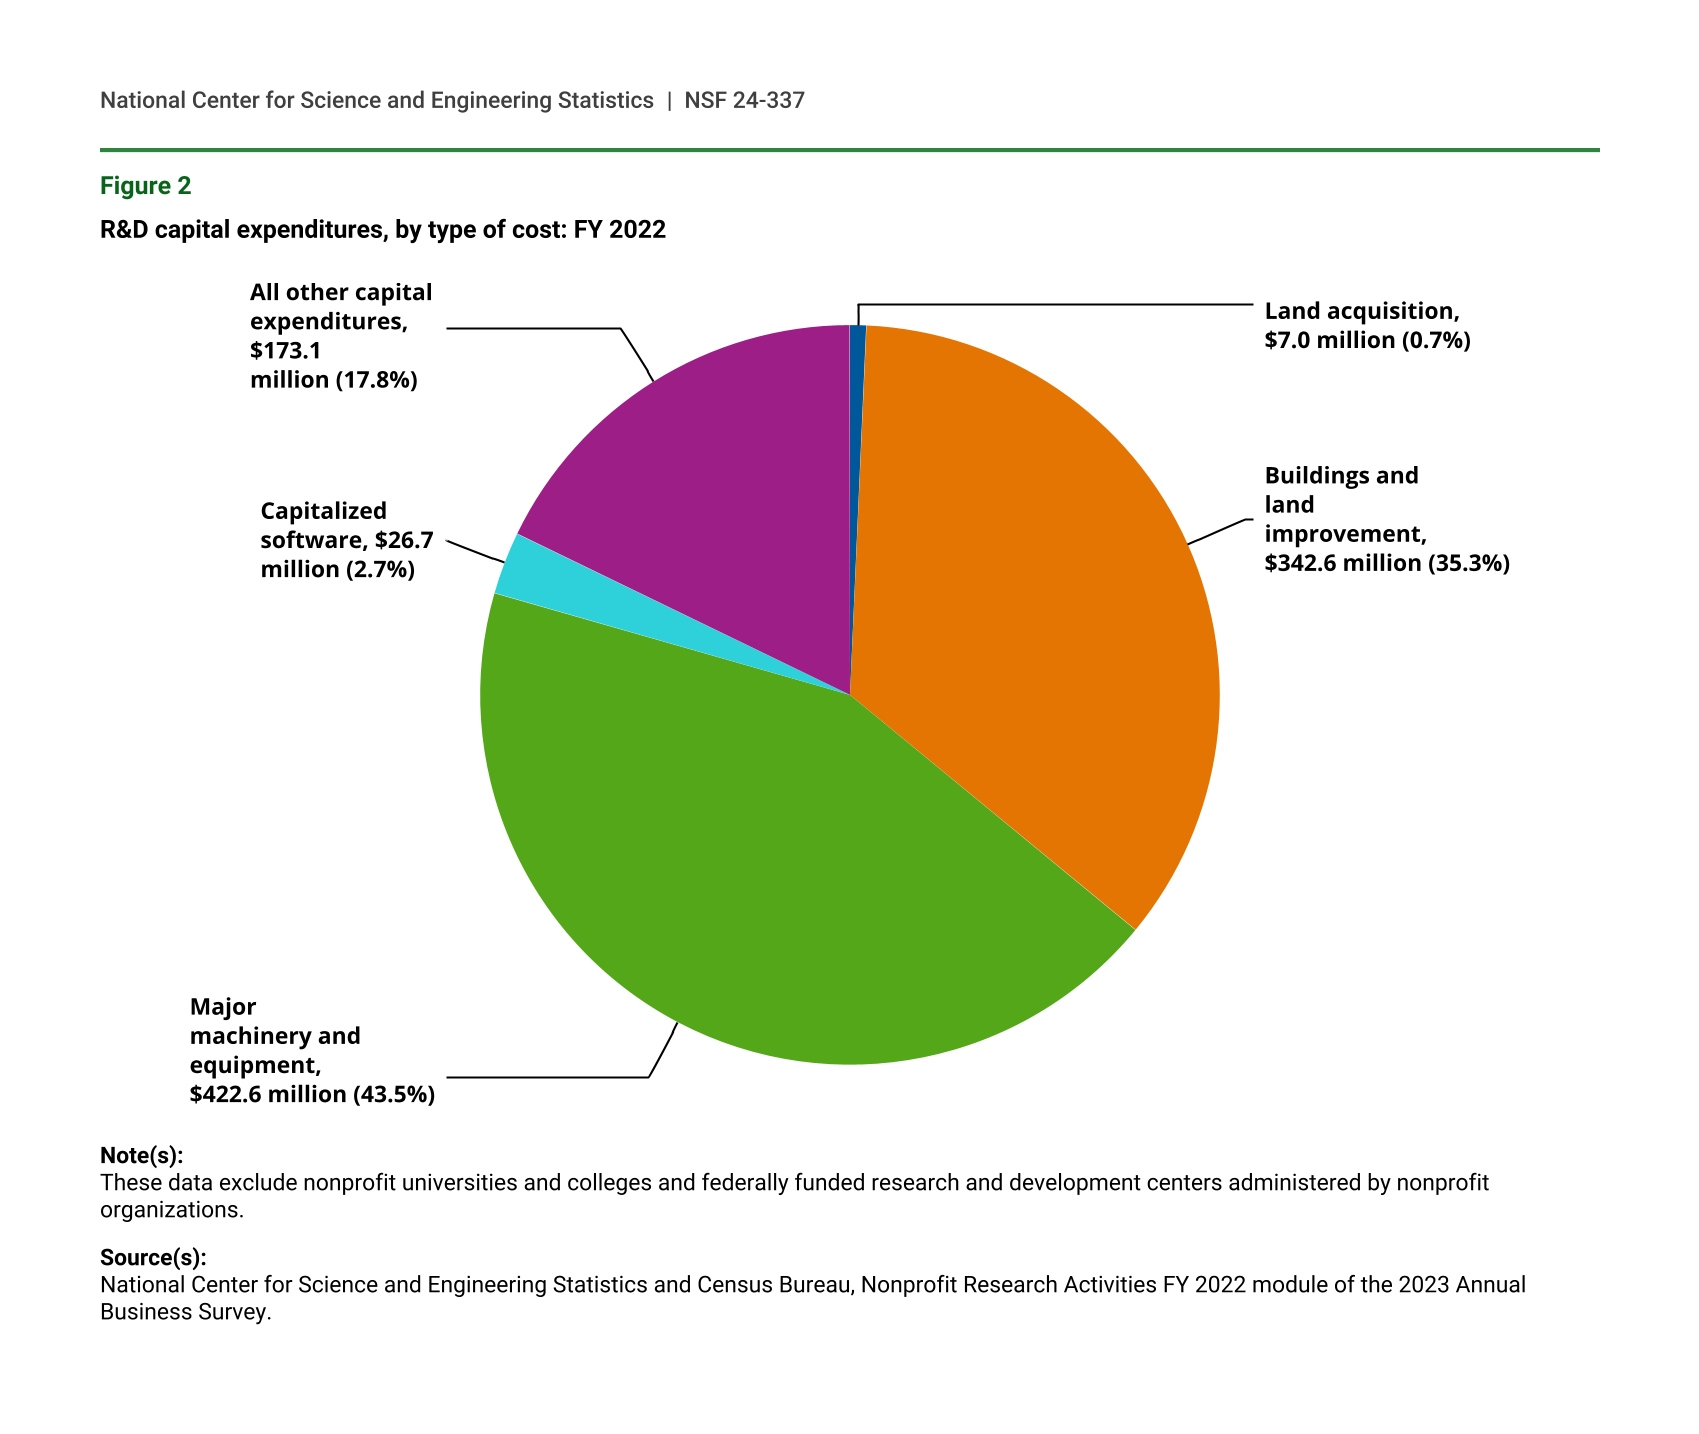
New data on capital expenditures research operations within nonprofit organizations are available starting with FY 2022. These are expenditures not included in the totals above for capital purchases, such as land acquisition, buildings and land improvement, major machinery and equipment, and capitalized software. In FY 2022, nonprofits spent $972 million on capital purchases related to R&D activities (figure 2). The largest proportion of those expenditures were for major machinery and equipment over the organization’s capitalization threshold (44% or $423 million).
R&D capital expenditures, by type of cost: FY 2022
| Type of cost | Total R&D capital expenditures (current $millions) | Share of R&D capital expenditures (%) |
|---|---|---|
| Land acquisition | 7.0 | 0.7 |
| Buildings and land improvement | 342.6 | 35.3 |
| Major machinery and equipment | 422.6 | 43.5 |
| Capitalized software | 26.7 | 2.7 |
| All other capital expenditures | 173.1 | 17.8 |
Note(s):
These data exclude nonprofit universities and colleges and federally funded research and development centers administered by nonprofit organizations.
Source(s):
National Center for Science and Engineering Statistics and Census Bureau, Nonprofit Research Activities FY 2022 module of the 2023 Annual Business Survey.
Nonprofit R&D Personnel
An estimated total of 198,389 employees worked on R&D within U.S. nonprofit organizations in FY 2022, including 136,206 full-time equivalent (FTE) employees. Of the FTE total, 44% were classified as researchers, 35% were classified as technicians, and the remaining 20% were other support personnel (table 3). Healthcare organizations accounted for over half of the FTE total (58%).
Headcount and full-time equivalent counts of R&D employees of nonprofit organizations, by occupation category and type of nonprofit organization: FY 2022
i = more than 50% of the estimate is a combination of imputation and reweighting to account for nonresponse.
a Nonprofit organizations are classified using the 2017 North American Industry Classification System code that accounts for the majority of their payroll. This classification may differ from the National Taxonomy of Exempt Entities Core Codes system used by the Internal Revenue Service and National Center for Charitable Statistics.
Note(s):
These data exclude nonprofit universities and colleges and federally funded research and development centers administered by nonprofit organizations. Detail may not add to total because of rounding.
Source(s):
National Center for Science and Engineering Statistics and Census Bureau, Nonprofit Research Activities FY 2022 module of the 2023 Annual Business Survey.
Other nonprofit organizations (the category exclusive of healthcare and science and technology nonprofits) had the highest proportion of researchers (58% of the total) and the lowest proportion of technicians (23%) compared to their counterparts. Researchers comprised 41% of the FTEs working on research activities within healthcare organizations, and 47% of the FTEs in science and technology organizations. Technicians accounted for 38% of the research FTEs in healthcare organizations, and 33% within science and technology organizations.
Survey Information and Data Availability
The NPRA FY 2022 module of the 2023 Annual Business Survey was conducted in 2023 with a sample of 8,000 nonprofit organizations representing 42,000 eligible nonprofit organizations in the United States. Higher education institutions and nonprofit-administered federally funded research and development centers are not included in this survey, as these populations are already included in NCSES’s Higher Education R&D Survey and FFRDC R&D Survey. The fiscal year referred to throughout this report was the nonprofit organizations’ fiscal year; for the majority of organizations reporting R&D performance, this fiscal year ended in either September or December of 2022.
The response rate for the NPRA FY 2022 module was 77%. The estimates in this InfoBrief are based on responses from a sample of the population and may differ from actual values because of sampling variability or other factors. As a result, apparent differences between the estimates for two or more groups may not be statistically significant. Unless otherwise noted, all comparative statements in this InfoBrief have undergone statistical testing and are significant at the 90% confidence level. The variances of estimates in this report were calculated using the delete-a-group jackknife replication method. The complete set of data tables for FY 2022 is available at https://ncses.nsf.gov/surveys/nonprofit-research-activities/2022#data.
NCSES has reviewed this product for unauthorized disclosure of confidential information and approved its release (NCSES-DRN24-060).
Notes
1All amounts in this report are shown in current dollars.
2Employee numbers were reported both as total headcounts and as full-time equivalents (FTEs). Headcounts represent every individual employed by the organization during FY 2022 regardless of the total hours worked. The FTE counts convert the headcounts to a total of FTE employees using the following calculation: 1 FTE equals 40 hours per week for 52 weeks per year. If an employee works 20 hours per week, the employee counts as half of an FTE.
3See the Technical Notes to the FY 2022 data tables for details on the survey frame and exclusions (https://ncses.nsf.gov/surveys/nonprofit-research-activities/2022#methodology).
Correction(s)
Suggested Citation
National Center for Science and Engineering Statistics (NCSES). 2024. U.S. Nonprofits Spent $28 Billion on R&D Activities in FY 2022. NSF 24-337. Alexandria, VA: U.S. National Science Foundation. Available at https://ncses.nsf.gov/pubs/nsf24337.
Contact Us
NCSES
National Center for Science and Engineering Statistics
Directorate for Social, Behavioral and Economic Sciences
U.S. National Science Foundation
2415 Eisenhower Avenue, Suite W14200
Alexandria, VA 22314
Tel: (703) 292-8780
FIRS: (800) 877-8339
TDD: (800) 281-8749
E-mail: ncsesweb@nsf.gov
NSF 24-337
|October 8, 2024