 An official website of the United States government
Nearly Half of 2023 U.S. Doctorate Recipients with Temporary Visas Were from China or India
| Country or economy | S&E fields | Non-S&E fields |
|---|---|---|
| China | 5,981 | 671 |
| India | 2,583 | 179 |
| South Korea | 800 | 309 |
| Iran | 597 | 51 |
| Bangladesh | 528 | 24 |
| Saudi Arabia | 373 | 110 |
| Taiwan | 420 | 42 |
| Canada | 300 | 105 |
| Turkey | 289 | 79 |
| Nepal | 311 | 15 |
| Brazil | 253 | 45 |
| Nigeria | 211 | 54 |
| Mexico | 200 | 35 |
| Sri Lanka | 222 | 7 |
| Colombia | 180 | 47 |
S&E = science and engineering.
China includes Hong Kong. Ranking based on total number of doctorate recipients.
National Center for Science and Engineering Statistics, Survey of Earned Doctorates, 2023. Related detailed table 7-7.
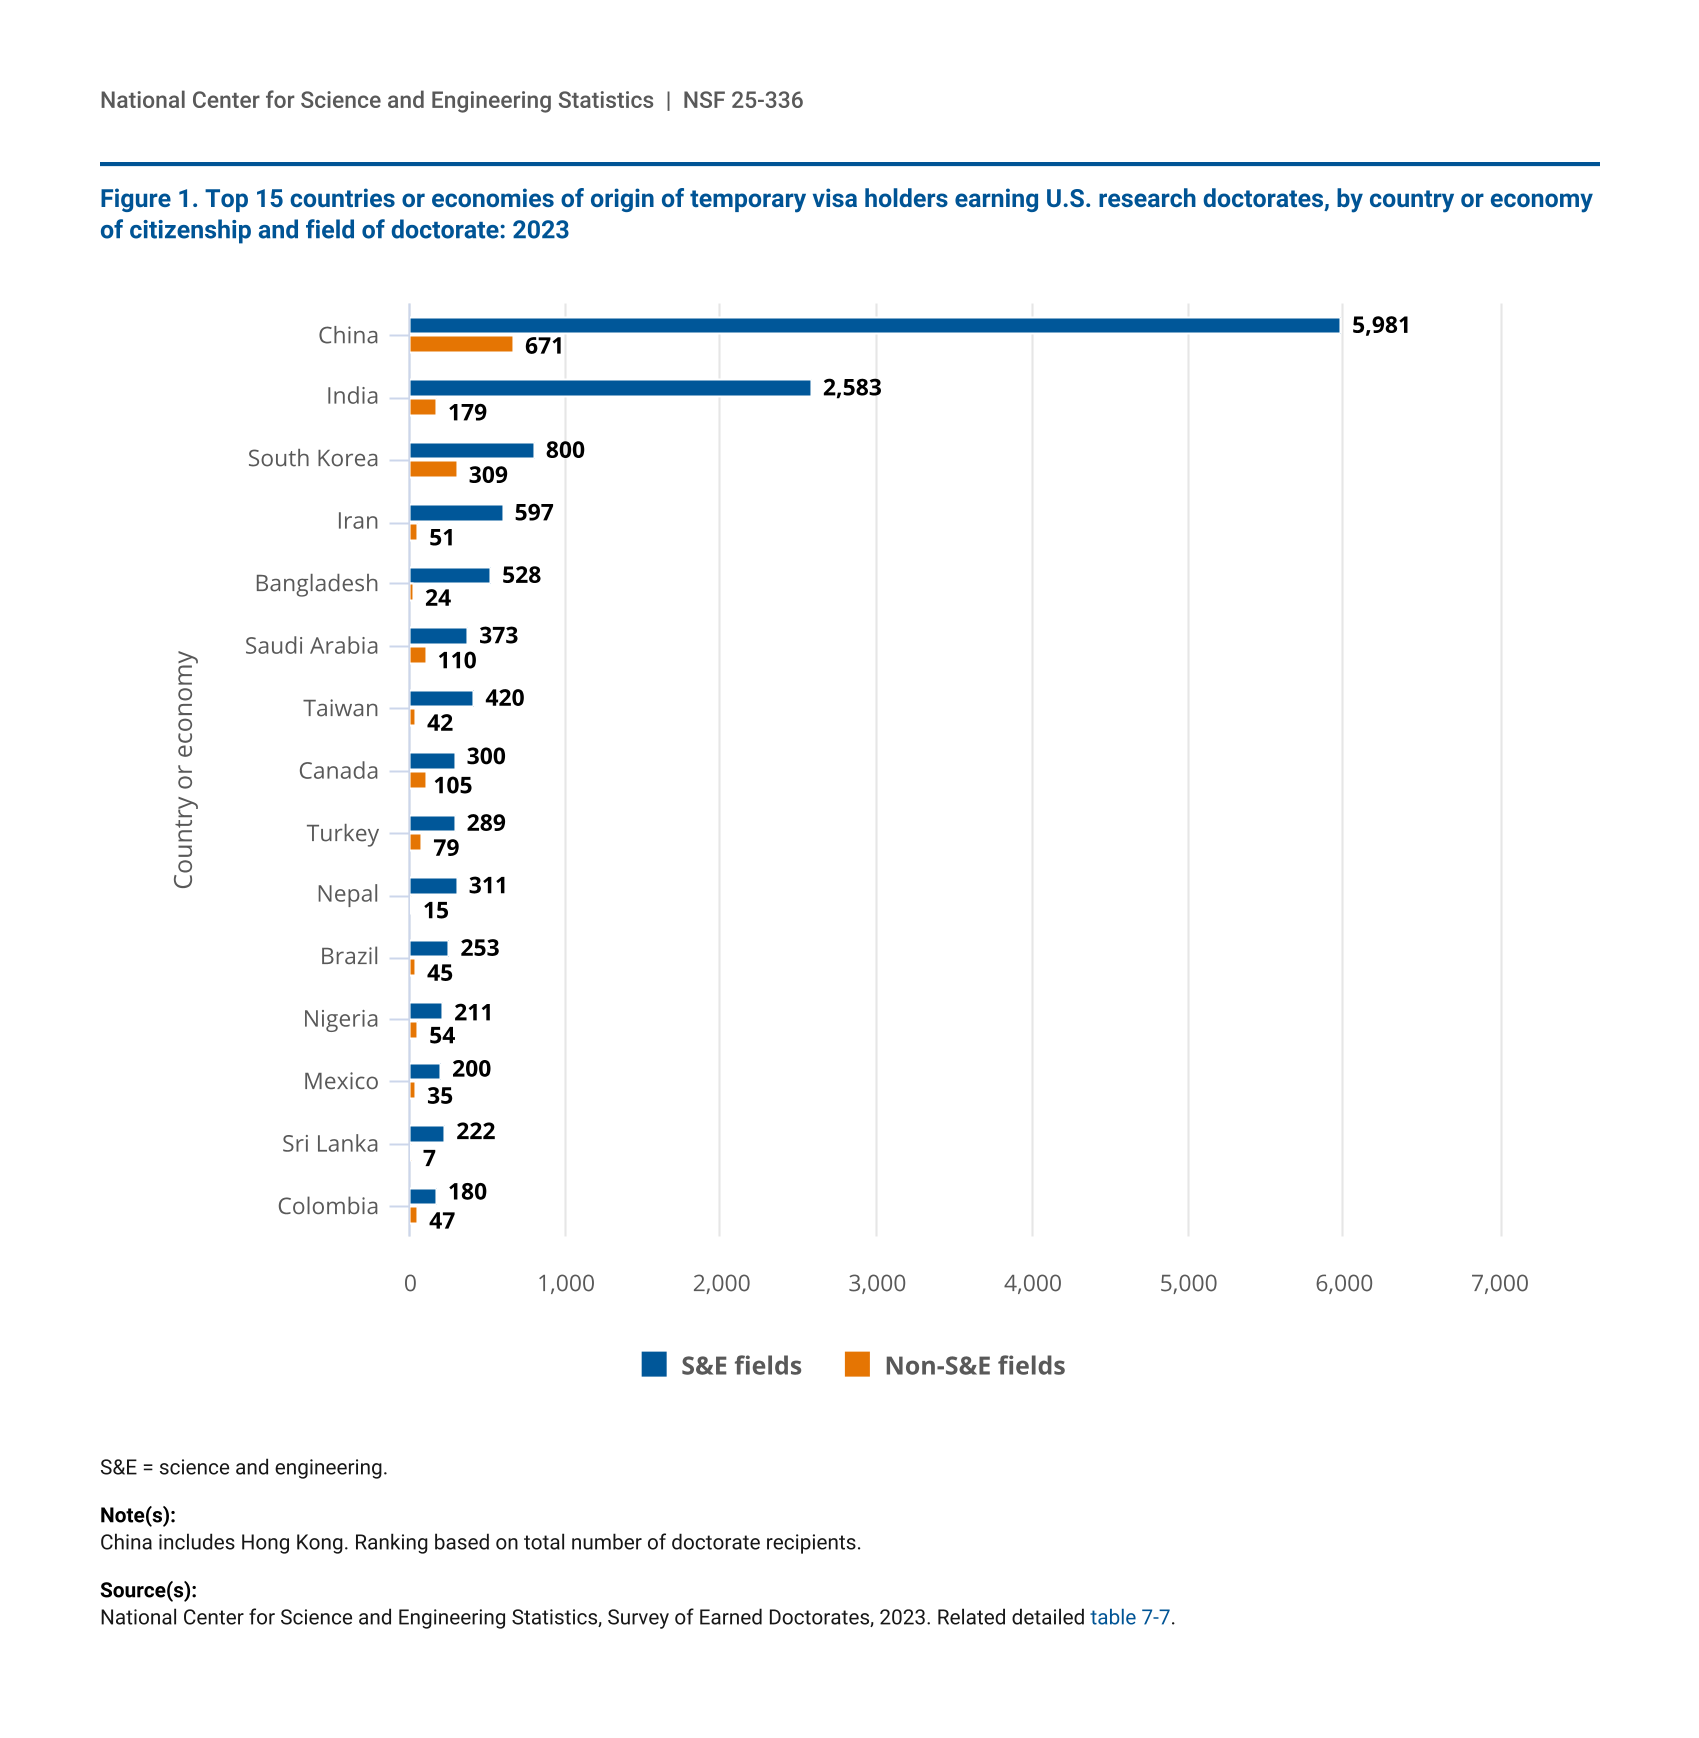
The number of research doctorate recipients on temporary visas in the United States is highly concentrated in a few countries or economies of origin. Of the 57,862 doctorate recipients in 2023, 35,566 (61%) were U.S. citizens and permanent residents; 19,393 (34%) were temporary visa holders; and 2,903 (5%) did not report citizenship. Of the 19,393 doctorate recipients who were temporary visa holders, 16,768 (86%) earned degrees in science and engineering (S&E) fields and 2,625 (14%) earned degrees in non-S&E fields. The top 15 countries or economies of origin accounted for 77% (15,021) of the total doctorates awarded to temporary visa holders (79% or 13,248 for S&E and 68% or 1,773 for non-S&E) (figure 1). Nearly half (49% or 9,414) of all doctorate recipients with temporary visas were from China or India (51% or 8,564 for S&E and 32% or 850 for non-S&E).
| Year | China | India | South Korea | Iran | Bangladesh | Taiwan |
|---|---|---|---|---|---|---|
| 2013 | 4,443 | 2,075 | 1,012 | 380 | 96 | 571 |
| 2014 | 4,653 | 2,209 | 930 | 463 | 127 | 559 |
| 2015 | 4,971 | 2,119 | 920 | 608 | 146 | 516 |
| 2016 | 5,141 | 2,085 | 892 | 664 | 178 | 500 |
| 2017 | 5,147 | 1,885 | 818 | 728 | 225 | 435 |
| 2018 | 5,692 | 1,922 | 729 | 869 | 271 | 445 |
| 2019 | 5,755 | 1,910 | 824 | 882 | 271 | 426 |
| 2020 | 5,730 | 2,111 | 756 | 896 | 369 | 417 |
| 2021 | 5,605 | 2,138 | 733 | 741 | 381 | 375 |
| 2022 | 6,029 | 2,513 | 761 | 791 | 522 | 374 |
| 2023 | 5,981 | 2,583 | 800 | 597 | 528 | 420 |
China includes Hong Kong.
National Center for Science and Engineering Statistics, Survey of Earned Doctorates, 2023.
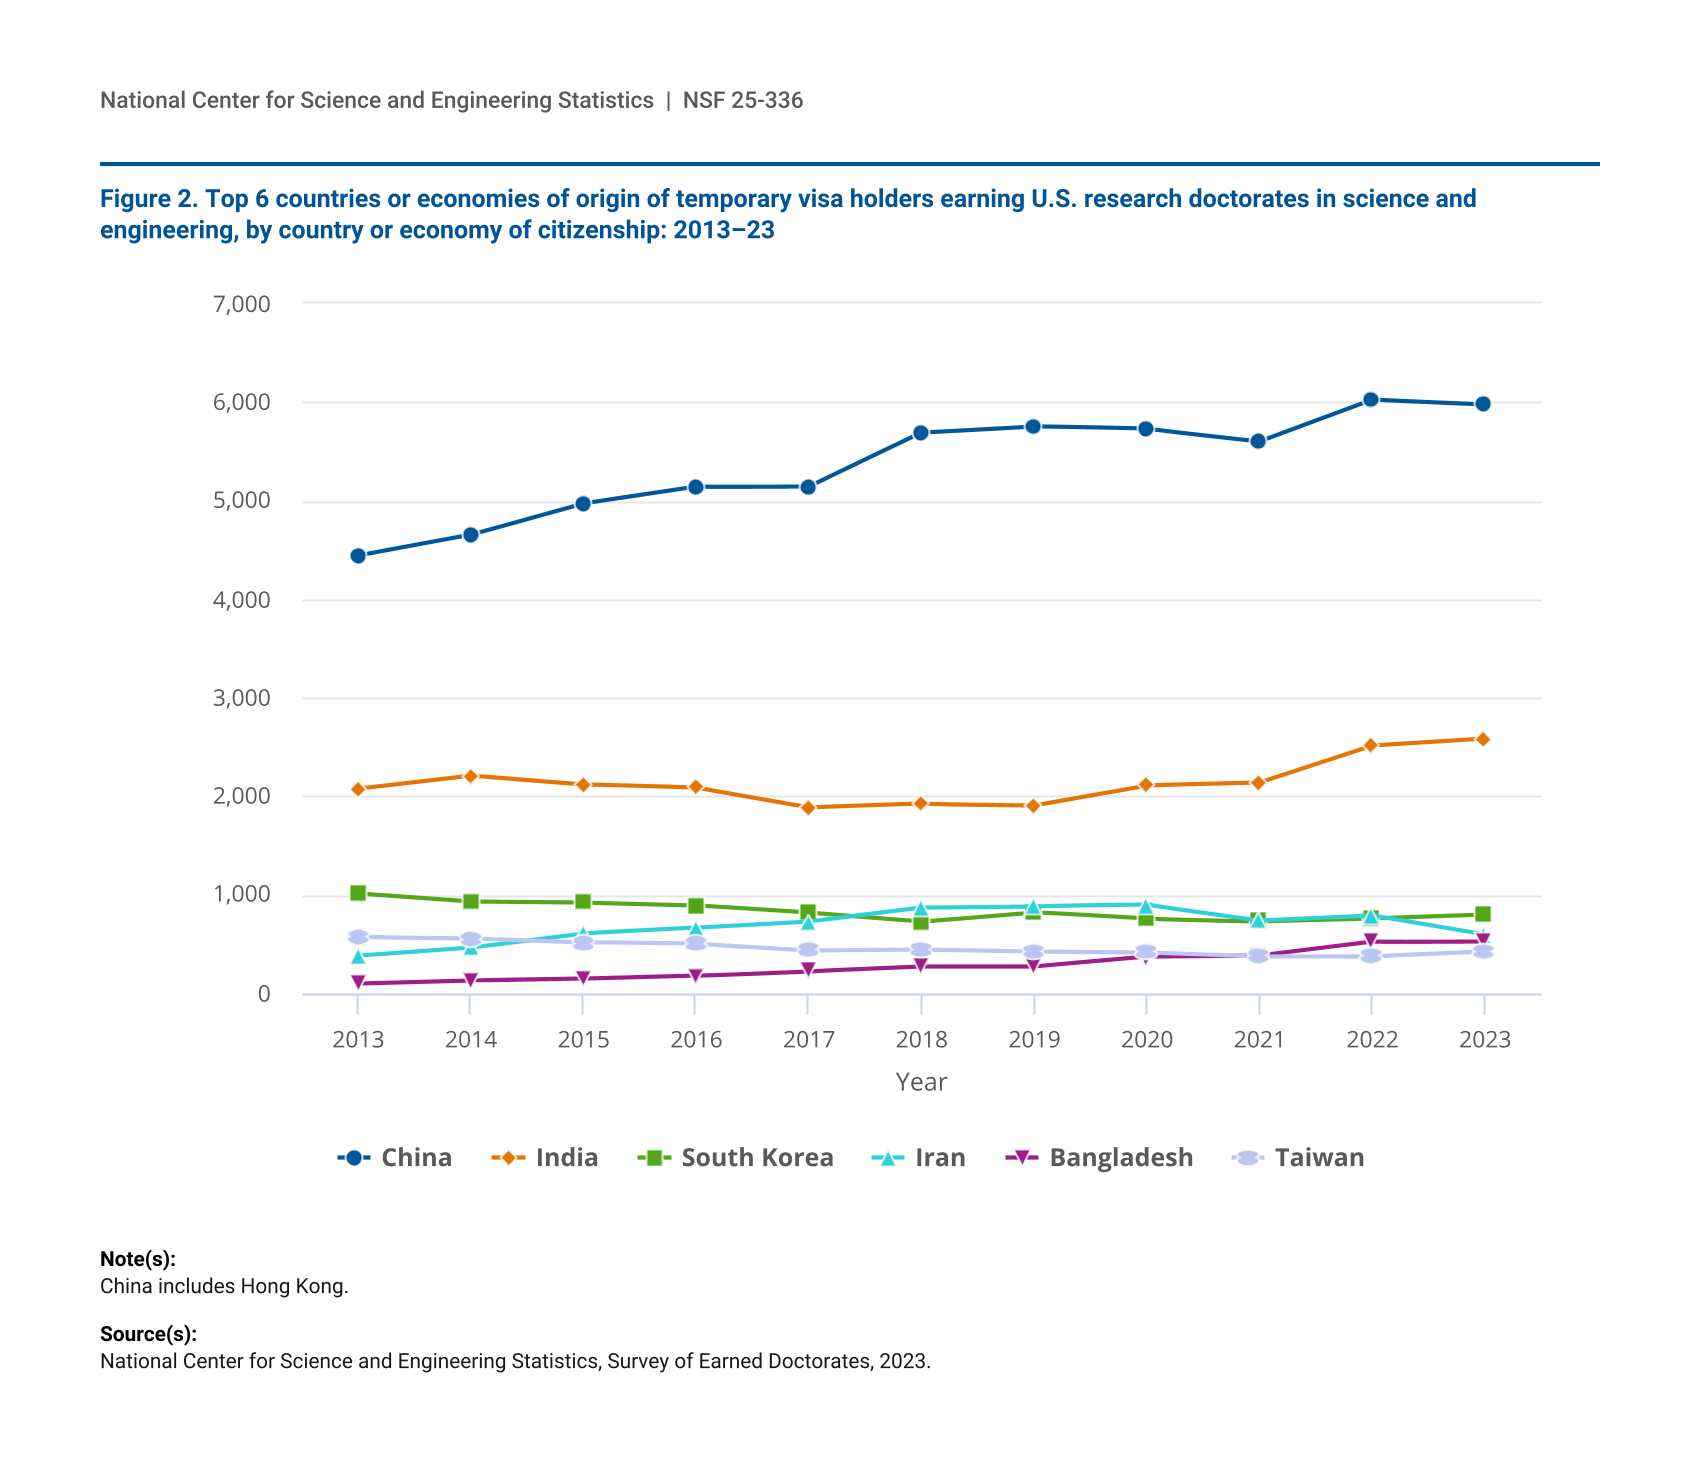
Between 72% (800 of 1,109 for South Korea) and 97% (222 of 229 for Sri Lanka) of the doctorate recipients from each of the top 15 countries or economies of origin earned their degree in an S&E field. China and India have been the top two countries or economies of origin for doctorate recipients on temporary visas for at least the past 10 years (figure 2). From 2013 to 2023, the number of doctorate recipients on temporary visas from China, India, Iran, Bangladesh, and Saudi Arabia increased. The numbers from South Korea and Taiwan declined through 2021 but have increased slightly since then.
The National Center for Science and Engineering Statistics has reviewed this product for unauthorized disclosure of confidential information and approved its release (NCSES-DRN24-071).
Suggested citation: National Center for Science and Engineering Statistics (NCSES). 2025. Nearly Half of 2023 U.S. Doctorate Recipients with Temporary Visas Were from China or India. NSF 25-336. Alexandria, VA: U.S. National Science Foundation. Available at https://ncses.nsf.gov/pubs/nsf25336.
Notes
1 A research doctoral degree is oriented toward preparing students to make original intellectual contributions in a field of study and that is not primarily intended for the practice of a profession. Research doctorates require the completion of a dissertation or equivalent project. In this report, the terms “doctorate” and “doctoral degree” are used to represent any of the research doctoral degrees covered by the SED. Professional doctoral degrees, such as the MD, DDS, JD, and PsyD, are not covered by the survey.
2 In 2023, 79% of all doctorate awards (U.S. citizens and permanent residents, temporary visa holders, and those who did not report citizenship) were in S&E.