 An official website of the United States government
R&D Performance within Federal Facilities Totaled $49.1 Billion in FY 2024
In FY 2024, $49.1 billion of research and experimental development (R&D) was performed within federally owned and operated facilities (table 1).
i = more than 50% of the estimate is imputed.
Detail may not add to total due to rounding.
National Center for Science and Engineering Statistics, Federal Facilities Research and Development Survey, FY 2024.
Data presented in this InfoBrief are from the Federal Facilities Research and Development (FFRD) Survey sponsored by the National Center for Science and Engineering Statistics (NCSES) within the U.S. National Science Foundation. These data include annual expenditures for R&D performed within federal facilities, which includes work performed by federal employees, military personnel, and onsite contractors. Note that this survey does not include the 42 designated federally funded research and development centers (FFRDCs), since they are surveyed separately. FFRDCs reported an R&D expenditure total of $31.7 billion in FY 2024.
This data collection represents the second cycle of this new survey designed to collect R&D expenditure and personnel data at the federal facility level. The first cycle collected data on FY 2022, and the questionnaire was subsequently revised to clarify definitions and instructions for FY 2024. Therefore, increases or decreases between FY 2022 and FY 2024 are at least partially attributed to questionnaire revisions and agency nonresponse. Caution should be used when comparing the results between these first two cycles.
Types of Costs
In addition to the $49.1 billion total reported in R&D expenditures performed by federal facilities in FY 2024, another $38.4 billion was spent on work performed by nonfederal entities working outside the facilities (table 1). The remainder of this InfoBrief will focus on the $49.1 billion for R&D performed within federal facilities.
Of the total R&D performed within federal facilities, 71% ($34.8 billion) was performed within Department of Defense (DOD) facilities and 29% ($14.3 billion) was performed within non-DOD facilities. Across all federal facilities, 31% of the expenditures for work done at the facilities ($15.0 billion) went toward the payment of onsite contractors. This percentage was significantly higher for DOD facilities than for non-DOD facilities (39% versus 11%). The remaining 69% ($34.1 billion) was for all other costs, such as the labor costs for federal employees, military personnel, trainees, or fellows working on R&D; purchases of material, supplies, equipment, and services; and general administration costs in support of R&D activities.
Type of R&D
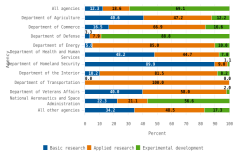
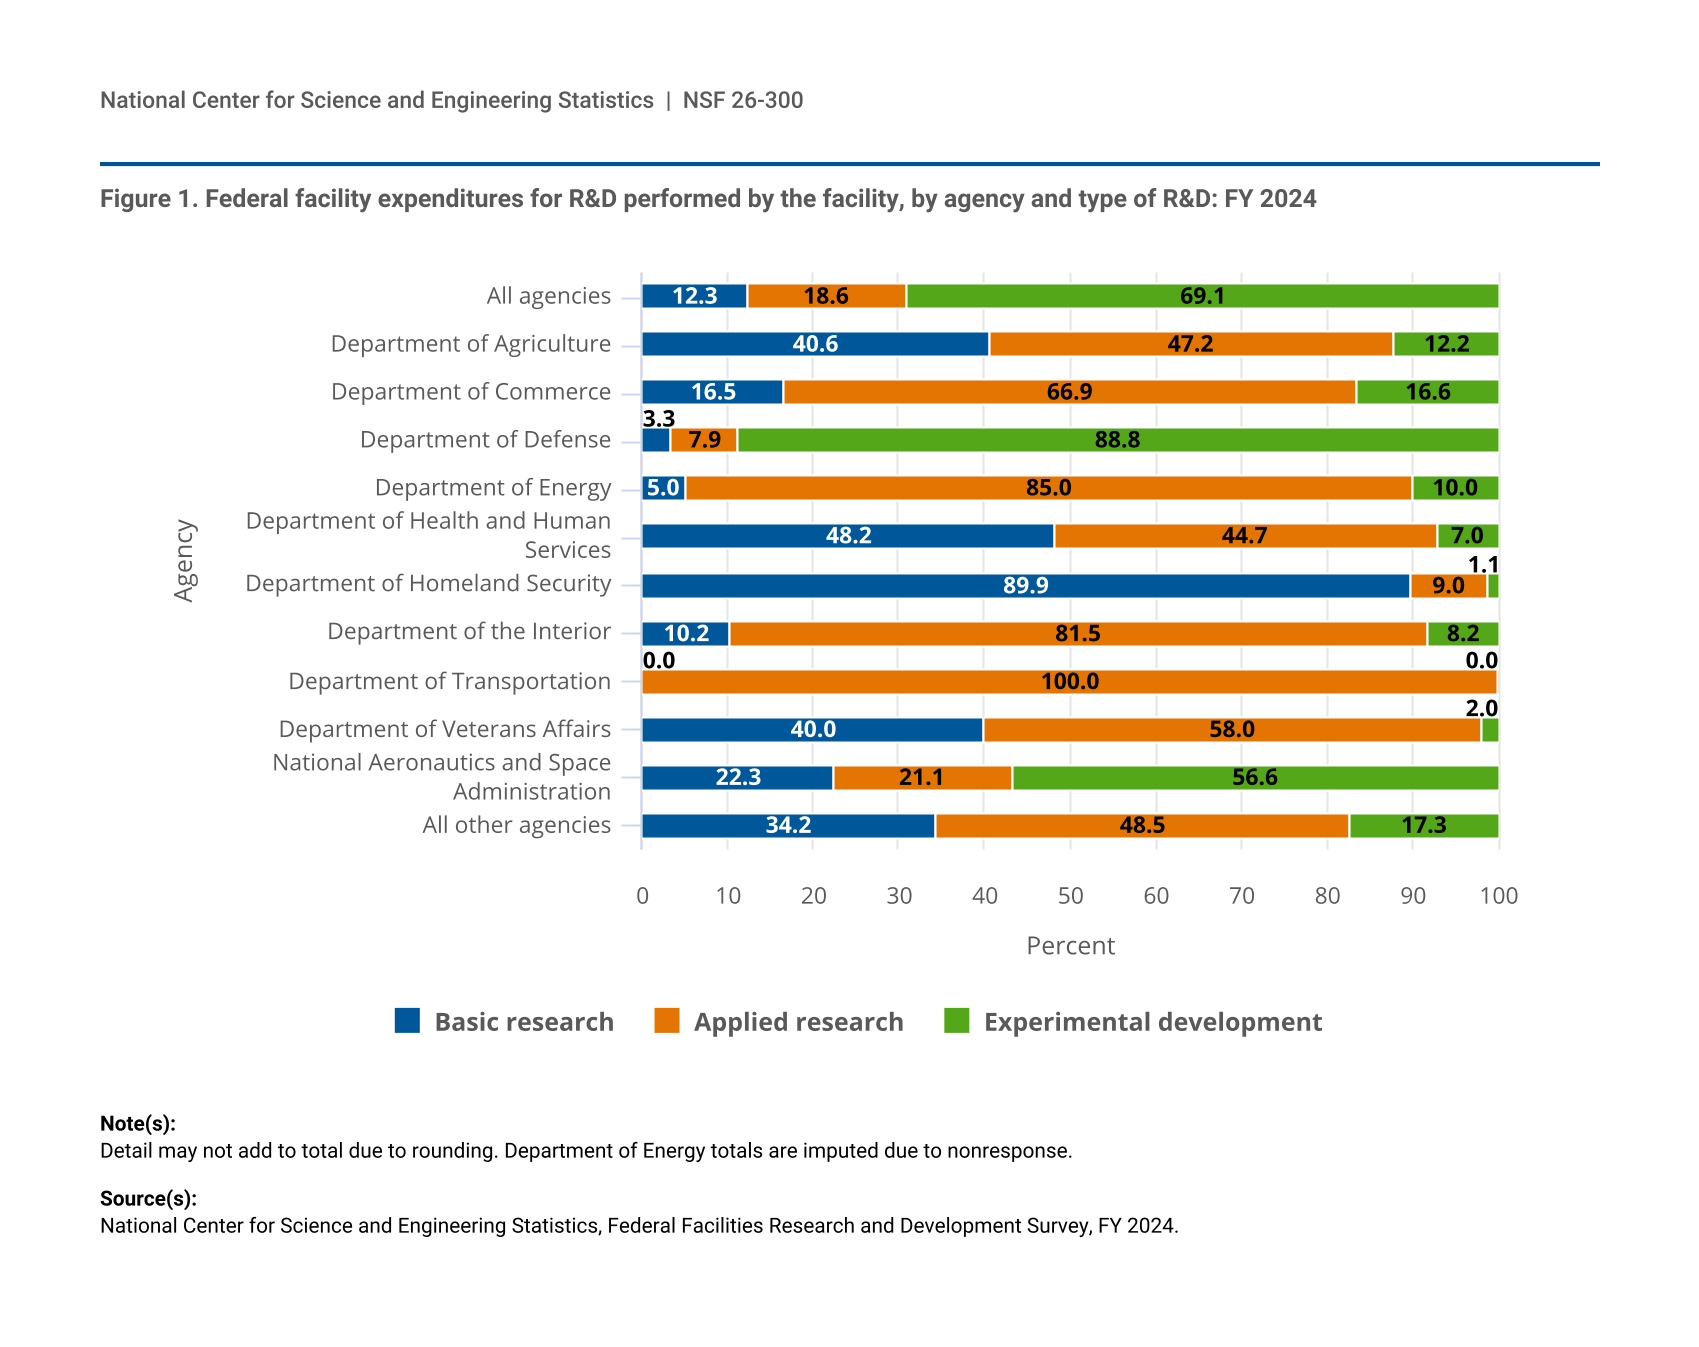
Across all federal facilities, the majority of the expenditures for R&D performed within the facilities was categorized as experimental development (69%, or $33.9 billion) (figure 1 and FFRD Survey data tables: table 4). Another 19% ($9.1 billion) was categorized as applied research, and 12% ($6.0 billion) was categorized as basic research.
| Agency | Basic research | Applied research | Experimental development |
|---|---|---|---|
| All agencies | 12.3 | 18.6 | 69.1 |
| Department of Agriculture | 40.6 | 47.2 | 12.2 |
| Department of Commerce | 16.5 | 66.9 | 16.6 |
| Department of Defense | 3.3 | 7.9 | 88.8 |
| Department of Energy | 5.0 | 85.0 | 10.0 |
| Department of Health and Human Services | 48.2 | 44.7 | 7.0 |
| Department of Homeland Security | 89.9 | 9.0 | 1.1 |
| Department of the Interior | 10.2 | 81.5 | 8.2 |
| Department of Transportation | 0.0 | 100.0 | 0.0 |
| Department of Veterans Affairs | 40.0 | 58.0 | 2.0 |
| National Aeronautics and Space Administration | 22.3 | 21.1 | 56.6 |
| All other agencies | 34.2 | 48.5 | 17.3 |
Detail may not add to total due to rounding. Department of Energy totals are imputed due to nonresponse.
National Center for Science and Engineering Statistics, Federal Facilities Research and Development Survey, FY 2024.
This distribution significantly varied by agency. In fact, the vast majority of all experimental development conducted within federal facilities in FY 2024 was within DOD facilities (91%, or $30.9 billion of $33.9 billion). The majority of the remaining non-DOD agencies reported most of their expenditures were in applied research. Only two agencies reported basic research as their largest category: the Department of Health and Human Services (48%, or $2.3 billion of their $4.8 billion total) and the Department of Homeland Security (90%, or $19.7 million of their $21.9 million total).
Field Distribution
The R&D performed within federal facilities spans all of the major disciplines, with work in engineering and biological, biomedical, and health sciences comprising over half (57%) of the reported expenditures (table 2). For DOD facilities, most of the R&D was within engineering (51%, or $17.6 billion) or in the other fields category, meaning not classified in one of the listed fields (40%, or $14.0 billion). For the non-DOD facilities, most of the R&D was within biological, biomedical, and health sciences (49%, or $7.1 billion).
DOD = Department of Defense.
Detail may not add to total due to rounding. More than 50% of the expenditures categorized as Agricultural sciences and natural resources and conservation are imputed.
National Center for Science and Engineering Statistics, Federal Facilities Research and Development Survey, FY 2024.
R&D Personnel
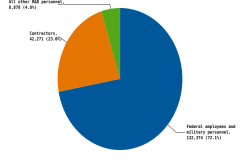
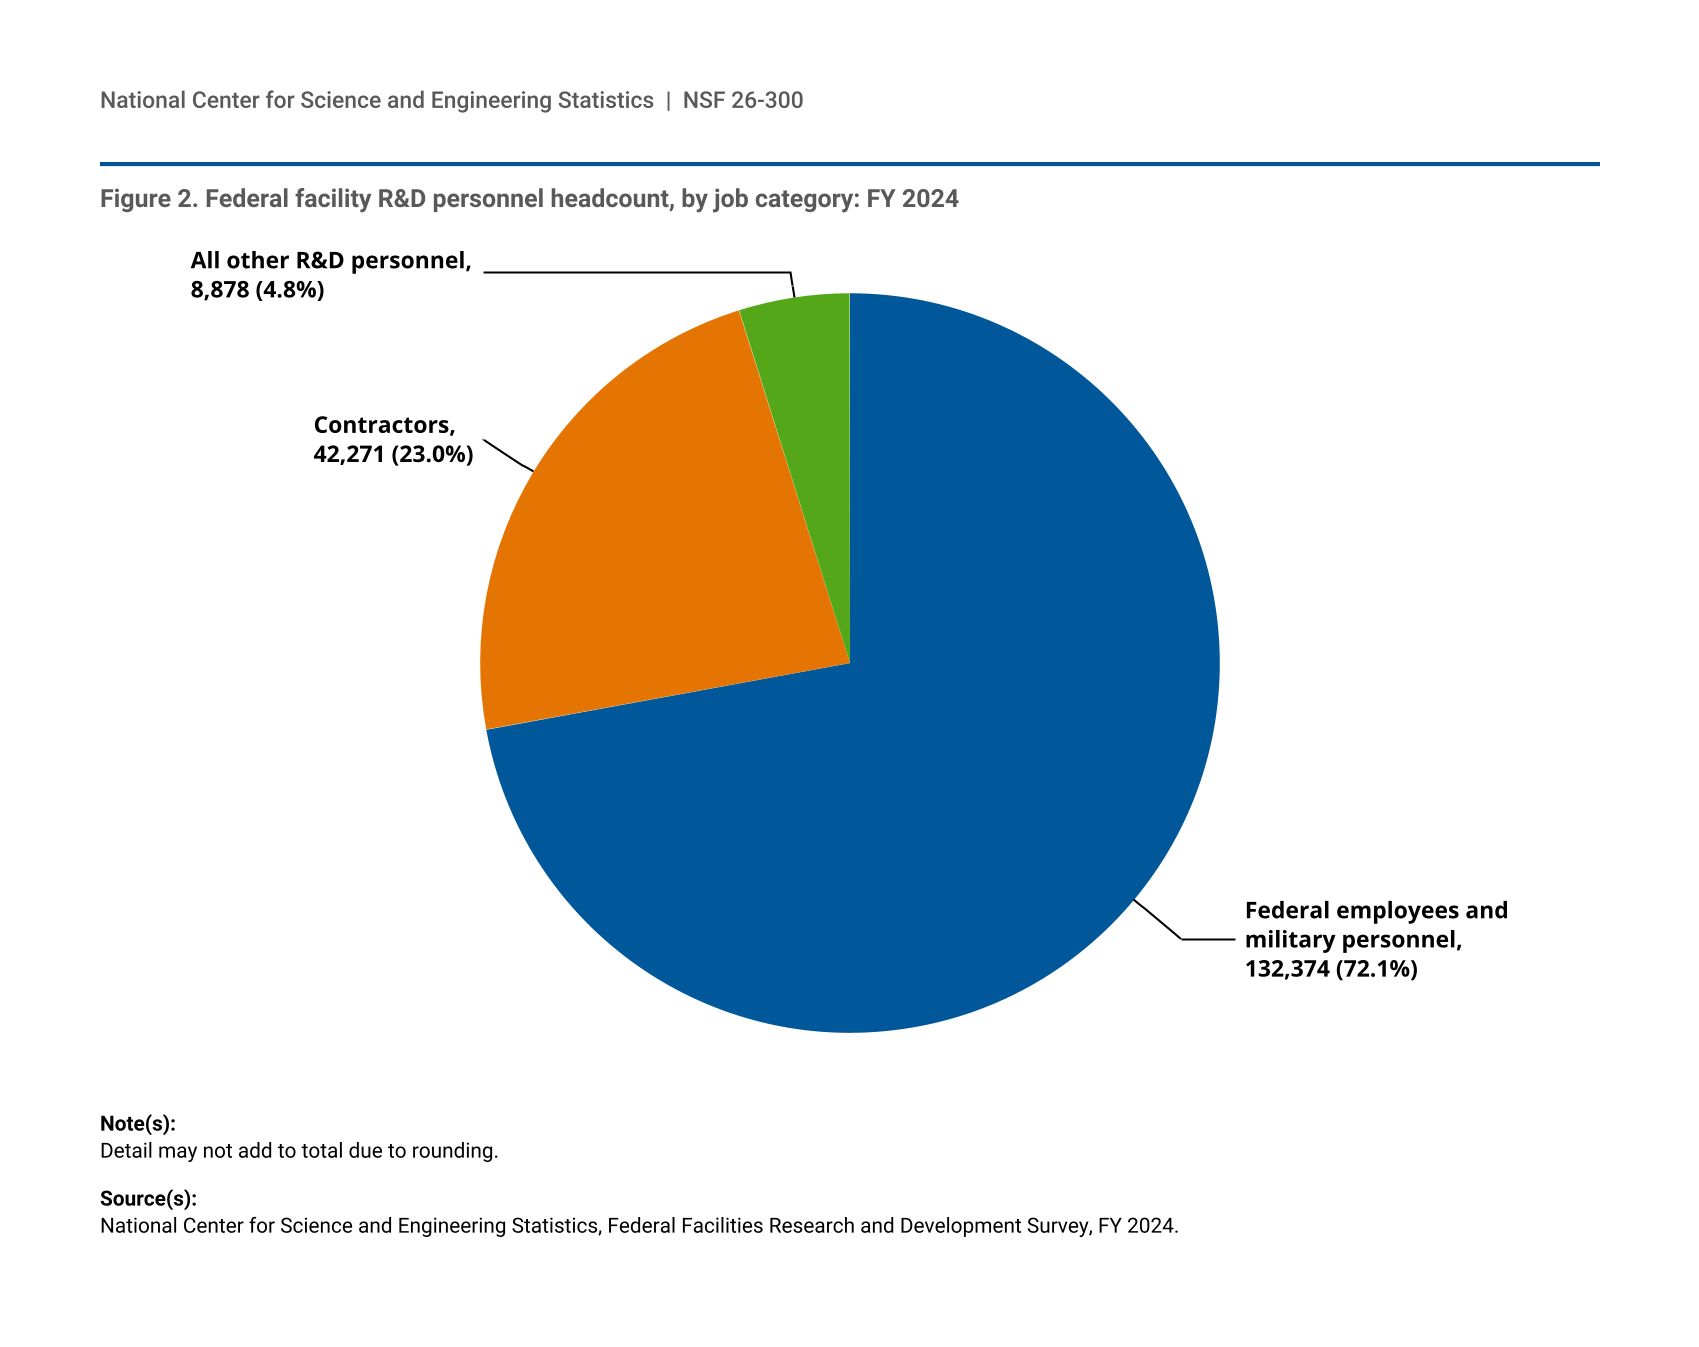
A total of 183,523 personnel were reported as working on R&D within federal facilities in FY 2024. Of this total, 72%, or 132,374, were federal employees or military personnel (figure 2). The second-largest amount of personnel were contractors working within the federal facilities (23%, or 42,271). The remaining 5%, or 8,878, were other R&D personnel, such as trainees, volunteers, or fellows who were not designated as federal employees or contractors.
| Job category | Number | Percent of total |
|---|---|---|
| Federal employees and military personnel | 132,374 | 72.1 |
| Contractors | 42,271 | 23.0 |
| All other R&D personnel | 8,878 | 4.8 |
Detail may not add to total due to rounding.
National Center for Science and Engineering Statistics, Federal Facilities Research and Development Survey, FY 2024.
Data Sources, Limitations, and Availability
Detailed tables showing these data by reporting facility are available at https://ncses.nsf.gov/surveys/federal-facilities-research-development/2024.
The survey was conducted from January 2025 through May 2025 as a census of the population of federally owned and operated facilities in the United States that performed R&D in FY 2024. The overall response rate was 95.7%. Imputation was performed to account for nonresponding facilities. The survey collected information on R&D expenditures by type of cost, type of R&D, source of funding, and field, as well as information on counts of R&D personnel.
A facility is defined as a unit within the agency that is responsible for performing R&D, generally with its own distinct budget and leadership. Because each agency has a different organizational structure, this unit of measurement may be a division, branch, center, laboratory, or other entity and may span multiple locations. Because of this, the total number of reporting units for the FY 2024 FFRD Survey is 322, which represents the 454 research-performing federal facilities.
The fiscal year referred to throughout this report is the federal fiscal year (1 October 2023 to 30 September 2024).
Data tables and detailed technical information are available at the FY 2024 FFRD Survey page. For more information, please contact NCSES.
NCSES has reviewed this product for unauthorized disclosure of confidential information and approved its release (NCSES-DRN25-004).
Notes
1 A related measure, federal obligations for federally performed research, is reported in the Survey of Federal Funds for R&D: FYs 2023–24: table 8. While similar, there are key differences between expenditures and obligations. First, the funding obligated to federally performed research in a fiscal year is not necessarily the same as the expenditures in that fiscal year within all agencies. Obligations reflect the amount committed to R&D projects in that year, which could be spent over several subsequent years; expenditures reflect only the funds spent on R&D conducted that year. Second, the Survey of Federal Funds for R&D collects obligations by type of recipient (federal, business, nonprofit, higher education, etc.). Any obligations for work under contract at a federal facility would be reported under federal obligations to businesses in the Survey of Federal Funds for R&D, but on the FFRD Survey, they are considered part of the total of the R&D performed at federal facilities. Finally, the federally performed total by agency in the Survey of Federal Funds for R&D includes transfers to other agencies as well as administration costs for external R&D contracts. On the FFRD Survey, transfers would be reported by the receiving agency for the year in which the funds were expended, and only costs related to R&D performance within the federal facility are reported.
2 University-administered FFRDCs were included in the R&D data collection of higher education institutions since FY 1953, and the full population of FFRDCs was added to the stand-alone FFRDC R&D Survey in FY 2001. FFRDC R&D data can be found here: https://ncses.nsf.gov/surveys/ffrdc-research-development/.
3 FY 2023 data collection was skipped to establish a better cadence for response and data release for each survey cycle. The survey is planned to be an annual data collection going forward.
4 See the Data Comparability section in the Technical Notes to the FY 2024 data tables for more details.
5 This number includes federal facilities’ funding for R&D performed by others outside the facilities, but it should be noted this total does not represent the total R&D funding to others for each agency. For data on all federal funding for R&D to all performers, see the Survey of Federal Funds for R&D: FYs 2023–24.
6 See the Technical Notes to the FY 2024 data tables for the definitions of basic research, applied research, and experimental development that were provided to survey respondents.
7 Engineering encompasses a wide array of work in subfields such as aerospace, biomedical, chemical, civil, environmental, electrical, computer, industrial, systems, mechanical, materials, and geological engineering.
8 These numbers represent the headcount of personnel; for full-time equivalent information for federal employees and military personnel, see the FY 2024 data tables: table 9.
9 See the Technical Notes to the FY 2024 data tables for details on the survey frame and exclusions.
Suggested Citation
National Center for Science and Engineering Statistics (NCSES). 2025. R&D Performance within Federal Facilities Totaled $49.1 Billion in FY 2024. NSF 26-300. Alexandria, VA: U.S. National Science Foundation. Available at https://ncses.nsf.gov/pubs/nsf26300.
Contact Us
NCSES
National Center for Science and Engineering Statistics
Directorate for Social, Behavioral and Economic Sciences
U.S. National Science Foundation
2415 Eisenhower Avenue, Suite W14200
Alexandria, VA 22314
Tel: (703) 292-8780
FIRS: (800) 877-8339
TDD: (800) 281-8749
E-mail: ncsesweb@nsf.gov