 An official website of the United States government
Universities Report 8.1% Growth in R&D Expenditures in FY 2024, Reaching Over $117 Billion
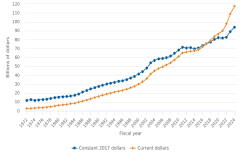
Total higher education research and development (R&D) expenditures reached $117.7 billion in FY 2024, an increase of $8.9 billion from FY 2023 (table 1). This total was 8.1% greater than R&D spending by academic institutions in FY 2023. Since FY 2014, higher education R&D has grown at an average compound annual rate of 5.7% in current dollars and 3.0% in constant dollars (figure 1). R&D expenditures funded by federal sources accounted for $5.0 billion of the total increase from FY 2023. Universities’ internally funded R&D expenditures (institution funds) were $2.5 billion greater than in FY 2023, while R&D funded by state and local governments also increased in FY 2024 by $633 million. R&D expenditures funded by businesses increased by $131 million and those funded by nonprofit organizations increased by $16 million. R&D funded by all other sources increased by $530 million in FY 2024.
Because of rounding, detail may not add to total. This table includes all institutions surveyed in the fiscal years shown.
National Center for Science and Engineering Statistics, Higher Education Research and Development Survey.
| Fiscal year | Constant 2017 dollars | Current dollars |
|---|---|---|
| 1972 | 11.9 | 2.6 |
| 1973 | 12.4 | 2.9 |
| 1974 | 11.9 | 3.0 |
| 1975 | 12.3 | 3.4 |
| 1976 | 12.7 | 3.7 |
| 1977 | 13.1 | 4.1 |
| 1978 | 13.9 | 4.6 |
| 1979 | 14.9 | 5.4 |
| 1980 | 15.4 | 6.1 |
| 1981 | 15.9 | 6.8 |
| 1982 | 16.0 | 7.3 |
| 1983 | 16.6 | 7.9 |
| 1984 | 17.5 | 8.6 |
| 1985 | 19.1 | 9.7 |
| 1986 | 21.1 | 10.9 |
| 1987 | 22.9 | 12.2 |
| 1988 | 24.5 | 13.5 |
| 1989 | 26.2 | 15.0 |
| 1990 | 27.5 | 16.3 |
| 1991 | 28.7 | 17.6 |
| 1992 | 30.0 | 18.8 |
| 1993 | 31.1 | 20.0 |
| 1994 | 32.1 | 21.0 |
| 1995 | 33.1 | 22.2 |
| 1996 | 33.8 | 23.1 |
| 1997 | 35.2 | 24.4 |
| 1998 | 36.9 | 25.9 |
| 1999 | 38.7 | 27.5 |
| 2000 | 41.4 | 30.1 |
| 2001 | 44.1 | 32.8 |
| 2002 | 48.2 | 36.4 |
| 2003 | 53.9 | 41.5 |
| 2004 | 56.7 | 44.8 |
| 2005 | 58.3 | 47.5 |
| 2006 | 59.1 | 49.6 |
| 2007 | 59.7 | 51.6 |
| 2008 | 61.5 | 54.1 |
| 2009 | 64.7 | 57.3 |
| 2010 | 68.4 | 61.3 |
| 2011 | 71.4 | 65.3 |
| 2012 | 70.7 | 65.9 |
| 2013 | 70.8 | 67.1 |
| 2014 | 69.8 | 67.3 |
| 2015 | 70.6 | 68.7 |
| 2016 | 73.2 | 71.9 |
| 2017 | 75.3 | 75.3 |
| 2018 | 77.4 | 79.2 |
| 2019 | 80.4 | 83.6 |
| 2020 | 82.1 | 86.4 |
| 2021 | 81.6 | 89.8 |
| 2022 | 82.9 | 97.8 |
| 2023 | 89.0 | 108.8 |
| 2024 | 94.0 | 117.7 |
Dollars adjusted for inflation (i.e., constant dollars) are based on the gross domestic product (GDP) implicit price deflator, currently in 2017 dollars, as published by the Bureau of Economic Analysis (BEA) under Section 1 Domestic Product and Income at https://apps.bea.gov/iTable/?isuri=1&reqid=19&step=4&categories=flatfiles&nipa_table_list=1, accessed on 4 August 2025. Note that GDP deflators are calculated on an economy-wide scale and do not explicitly focus on R&D.
National Center for Science and Engineering Statistics, Higher Education Research and Development Survey.
The data discussed in this report are from the Higher Education Research and Development (HERD) Survey, sponsored by the National Center for Science and Engineering Statistics (NCSES) within the U.S. National Science Foundation. For more information on the survey, see “Data Sources, Limitations, and Availability.”
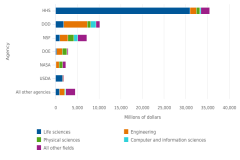
R&D Expenditures, by Federal Funding Sources
Federally funded R&D at universities surpassed $64 billion in FY 2024, which accounted for 55% of total R&D (table 2). The largest federal source of R&D expenditures for higher education institutions was the Department of Health and Human Services (HHS)—which includes the National Institutes of Health—at $35.5 billion, up $2.4 billion from FY 2023. HHS accounted for 55% of FY 2024 federally funded R&D and 48% of the overall FY 2024 increase in federally funded R&D. HHS funds supported $30.9 billion in life sciences R&D, which notably includes biological and biomedical sciences and health sciences (figure 2). HHS funds also supported $1.5 billion in engineering R&D expenditures. The Department of Defense (DOD) was the only agency other than HHS that supported at least $1 billion more in higher education R&D in FY 2024 than in FY 2023, reaching $10.2 billion in FY 2024. The largest share of DOD funds (54%) supported engineering R&D ($5.5 billion) followed by life sciences ($1.9 billion, 18% of total), and computer and information sciences R&D ($1.2 billion, 11% of total). The National Science Foundation (NSF) funded $7.2 billion in higher education R&D in FY 2024 with $1.9 billion supporting engineering R&D and $1.3 billion supporting physical sciences R&D. Total higher education R&D funded by NSF was $474 million greater than in FY 2023.
| Agency | Life sciences | Engineering | Physical sciences | Computer and information sciences | All other fields |
|---|---|---|---|---|---|
| HHS | 30,915.2 | 1,513.7 | 776.3 | 213.9 | 2,081.1 |
| DOD | 1,850.6 | 5,450.5 | 809.9 | 1,150.8 | 912.2 |
| NSF | 979.1 | 1,876.2 | 1,325.4 | 910.3 | 2,082.8 |
| DOE | 243.2 | 1,296.4 | 1,063.7 | 77.1 | 261.0 |
| NASA | 92.4 | 741.9 | 795.4 | 26.1 | 712.8 |
| USDA | 1,614.3 | 132.9 | 12.9 | 21.8 | 194.5 |
| All other agencies | 879.2 | 1,173.7 | 116.4 | 197.5 | 2,138.8 |
DOD = Department of Defense; DOE = Department of Energy; HHS = Department of Health and Human Services; NASA = National Aeronautics and Space Administration; NSF = National Science Foundation; USDA = Department of Agriculture.
All other agencies includes all other agencies reported. All other fields includes social sciences; psychology; mathematics and statistics; geosciences, atmospheric sciences, and ocean sciences; sciences not elsewhere classified; and non-science and engineering fields.
National Center for Science and Engineering Statistics, Higher Education Research and Development Survey, FY 2024.
Department of Energy (DOE) ($2.9 billion total, $270 million increase) funds primarily supported R&D in engineering ($1.3 billion, 44% of total) and physical sciences ($1.1 billion, 36% of total). The National Aeronautics and Space Administration (NASA) ($2.4 billion total, $73 million increase) and the Department of Agriculture (USDA) ($2.0 billion total, $275 million increase) were the only other agencies where funded higher education R&D expenditures reached or exceeded $2 billion in FY 2024. NASA funds primarily supported physical sciences ($795 million, 34% of total) and engineering ($742 million, 31% of total) R&D, while USDA funds in FY 2024 mainly supported life sciences ($1.6 billion, 82% of total). R&D expenditures funded by all other federal sources totaled $4.5 billion in FY 2024, an increase of 10% from FY 2023 (table 2).
DOD = Department of Defense; DOE = Department of Energy; HHS = Department of Health and Human Services; NASA = National Aeronautics and Space Administration; NSF = National Science Foundation; USDA = Department of Agriculture.
Because of rounding, detail may not add to total. Institutions reporting less than $1 million in total R&D expenditures completed a shorter version of the survey questionnaire and those totals are not reflected here. R&D expenditures from institutions reporting less than $1 million in R&D in FY 2024 were $164 million. Total federally funded R&D for these institutions in FY 2024 was $78 million.
National Center for Science and Engineering Statistics, Higher Education Research and Development Survey.
R&D Expenditures, by Field
In FY 2024, R&D expenditures in science fields increased by 7.6% ($6.4 billion), reaching $90.7 billion, and engineering fields increased by 10% ($1.8 billion), reaching $19.3 billion (table 3). R&D expenditures in non-science and engineering (non-S&E) fields ($7.6 billion) increased by 9.7% ($671 million). R&D expenditures in two life sciences subfields, health sciences ($38.5 billion, a $2.8 billion increase) and biological and biomedical sciences ($20.8 billion, a $1.3 billion increase), showed the largest dollar increases from FY 2023, accounting for 46% of the total university R&D growth in FY 2024. Combined, these two fields also accounted for 50% of total higher education R&D.
nec = not elsewhere classified; S&E = science and engineering.
This table includes only institutions reporting $1 million or more in total R&D expenditures in FY 2023. Institutions reporting less than $1 million in total R&D expenditures in FY 2023 completed a shorter version of the survey form in FY 2024, and that form did not collect R&D expenditures by source and detailed field. Total expenditures from institutions reporting less than $1 million in R&D in FY 2024 was $164 million.
National Center for Science and Engineering Statistics, Higher Education Research and Development Survey.
While the federal government funded 55% of all FY 2024 higher education R&D expenditures, federally funded expenditures in several fields accounted for more than 70% of their respective totals: atmospheric science and meteorology (80%); aerospace, aeronautical, and astronautical engineering (77%); electrical, electronic, and communications engineering (73%); physics (71%); and industrial and manufacturing engineering (70%). State and local governments funded 5.2% of total academic R&D, but these sources supported higher percentages of the respective total in five fields: agricultural sciences (24%), civil engineering (17%), natural resources and conservation (17%), social work (13%), and education (10%). The fields with the highest shares of institutionally funded R&D were anthropology (54%), political science and government (48%), and the non-S&E fields as a whole (52%). Within the non-S&E fields, only two were supported by less than 50% of institutional funds: education (30%) and social work (28%). Nonprofit organizations and businesses provided similar levels of R&D support in FY 2024 at 5.7% and 5.4%, respectively. However, nonprofits funded at least 16% of R&D in three fields: political science and government (20%), economics (19%), and law (16%), while businesses funded 10% or more in three fields: engineering, not elsewhere classified (11%); physical sciences, not elsewhere classified (11%); and aerospace, aeronautical, and astronautical engineering (10%).
Top University Research Performers
The top 30 institutions in terms of R&D expenditures accounted for 42% of the total spent on R&D within the higher education sector in FY 2024, which is consistent with fiscal years 2022 and 2023 (table 4). Thirty-seven institutions reported at least $1 billion in R&D expenditures in FY 2024, compared with 33 institutions in FY 2023 and 29 in FY 2022. Sixteen of the top 30 institutions were public, accounting for $26.1 billion in total R&D expenditures; 14 were private, accounting for $23.4 billion. Almost all of the institutions (28 of the 30) had medical schools. The same institutions were ranked in the top 30 in FY 2023 and FY 2024, although several institutions changed positions on the list.
a Johns Hopkins University includes the Applied Physics Laboratory, with $2,550 million in total R&D expenditures in FY 2024.
Because of rounding, detail may not add to total. Rankings are based on unrounded totals. This table reflects the leading 30 institutions for FY 2024; the institutions listed may not be in the top 30 of prior fiscal years.
National Center for Science and Engineering Statistics, Higher Education Research and Development Survey.
Data Sources, Limitations, and Availability
The FY 2024 higher education R&D expenditures data were collected from a census of 925 universities and colleges that grant a bachelor’s degree or higher and expended at least $150,000 in R&D in FY 2023. To reduce respondent burden, the HERD Survey requests abbreviated data (short form) from institutions reporting less than $1 million in R&D expenditures during the previous fiscal year (FY 2023). Except for the totals reported in table 1 and figure 1, all other totals shown in this report exclude expenditures from the 244 institutions that completed the short form version of the survey. The institutions completing the short form survey accounted for $164 million (0.14%) of total higher education R&D expenditures in FY 2024.
The fiscal year referred to throughout this report is the academic fiscal year. For most academic institutions, FY 2024 represents 1 July 2023 through 30 June 2024.
The amounts reported include all funds expended for activities specifically organized to produce research outcomes and either sponsored by an outside organization or separately accounted-for using institution funds. R&D expenditures at university-administered federally funded research and development centers (FFRDCs) are collected in a separate NCSES survey, the FFRDC Research and Development Survey.
The full set of data tables and technical information from this survey are available at https://ncses.nsf.gov/surveys/higher-education-research-development/2024.
NCSES has reviewed this product for unauthorized disclosure of confidential information and approved its release (NCSES-DRN25-060).
Notes
1 Dollars adjusted for inflation (i.e., constant dollars) are based on the gross domestic product (GDP) implicit price deflator, currently in 2017 dollars, as published by the Bureau of Economic Analysis (BEA) under Section 1 Domestic Product and Income at https://apps.bea.gov/iTable/?isuri=1&reqid=19&step=4&categories=flatfiles&nipa_table_list=1, accessed on 4 August 2025. Note that GDP deflators are calculated on an economy-wide scale and do not explicitly focus on R&D.
2 See table 3 in this InfoBrief for the full breakdown of all R&D fields and subfields.
3 Engineering fields, not elsewhere classified could include agricultural engineering, engineering design, engineering mechanics, engineering physics, engineering science, forest engineering, nanotechnology, naval architecture and marine engineering, nuclear engineering, ocean engineering, petroleum engineering, and other engineering fields that cannot be classified using the fields provided on the HERD questionnaire. Physical science fields, not elsewhere classified includes other physical science fields that cannot be classified using the fields provided on the HERD questionnaire.
4 For more details on institutions ranked by total R&D expenditures, see tables 4, 6, and 13–15 in the survey’s FY 2024 detailed data tables.
5 Additional detailed data on institutional control of colleges and universities is available in the NCSES Table Builder tool, using the dimension "Institution Characteristics/Public or Private." See the article How to Build a Table for instructions on creating custom tables within this tool.
6 Additional detailed data on medical school R&D expenditures are available in the NCSES Table Builder tool, using the measure "For Medical School R&D." See the article How to Build a Table for instructions on creating custom tables within this tool.
Suggested Citation
National Center for Science and Engineering Statistics (NCSES). 2026. Universities Report 8.1% Growth in R&D Expenditures in FY 2024, Reaching Over $117 Billion. NSF 26-305. Alexandria, VA: U.S. National Science Foundation. Available at https://ncses.nsf.gov/pubs/nsf26305.
Contact Us
National Center for Science and Engineering Statistics
Directorate for Social, Behavioral and Economic Sciences
U.S. National Science Foundation
Tel: (703) 292-8780
FIRS: (800) 877-8339
TDD: (800) 281-8749
E-mail: ncsesweb@nsf.gov