 An official website of the United States government
Distribution of Federal Science and Engineering Support to Higher Education Institutions Across States
In FY 2023, federal agencies obligated $49.0 billion to 1,110 institutions of higher education in the United States, the District of Columbia, and outlying areas for support of science and engineering (S&E) activities, including $45.0 billion for research and development (R&D)., The top five states subject to federal obligations for S&E support to higher education institutions (California, New York, Maryland, Texas, and Pennsylvania) combined account for 37.8% ($18.5 billion) of all federal obligations. Most of these states are among the largest by population and, as such, may be subject to a larger share of federal funding in general. However, this analysis covers a narrower scope than total federal funding, namely, federal S&E support to higher education institutions, and therefore will use metrics other than population to normalize state support.
This InfoBrief highlights the distribution of federal S&E support to higher education institutions by state geography for all institutions of higher education, normalized by the number of institutions within each state. It also examines the distribution of support obligated to R-1 institutions per the number of R-1 institutions within each state. Data in this InfoBrief are from the FY 2023 Survey of Federal S&E Support module within the Survey of Federal Funds for R&D, conducted by the National Center for Science and Engineering Statistics (NCSES) within the U.S. National Science Foundation.
Federal S&E Obligations to All Higher Education Institutions
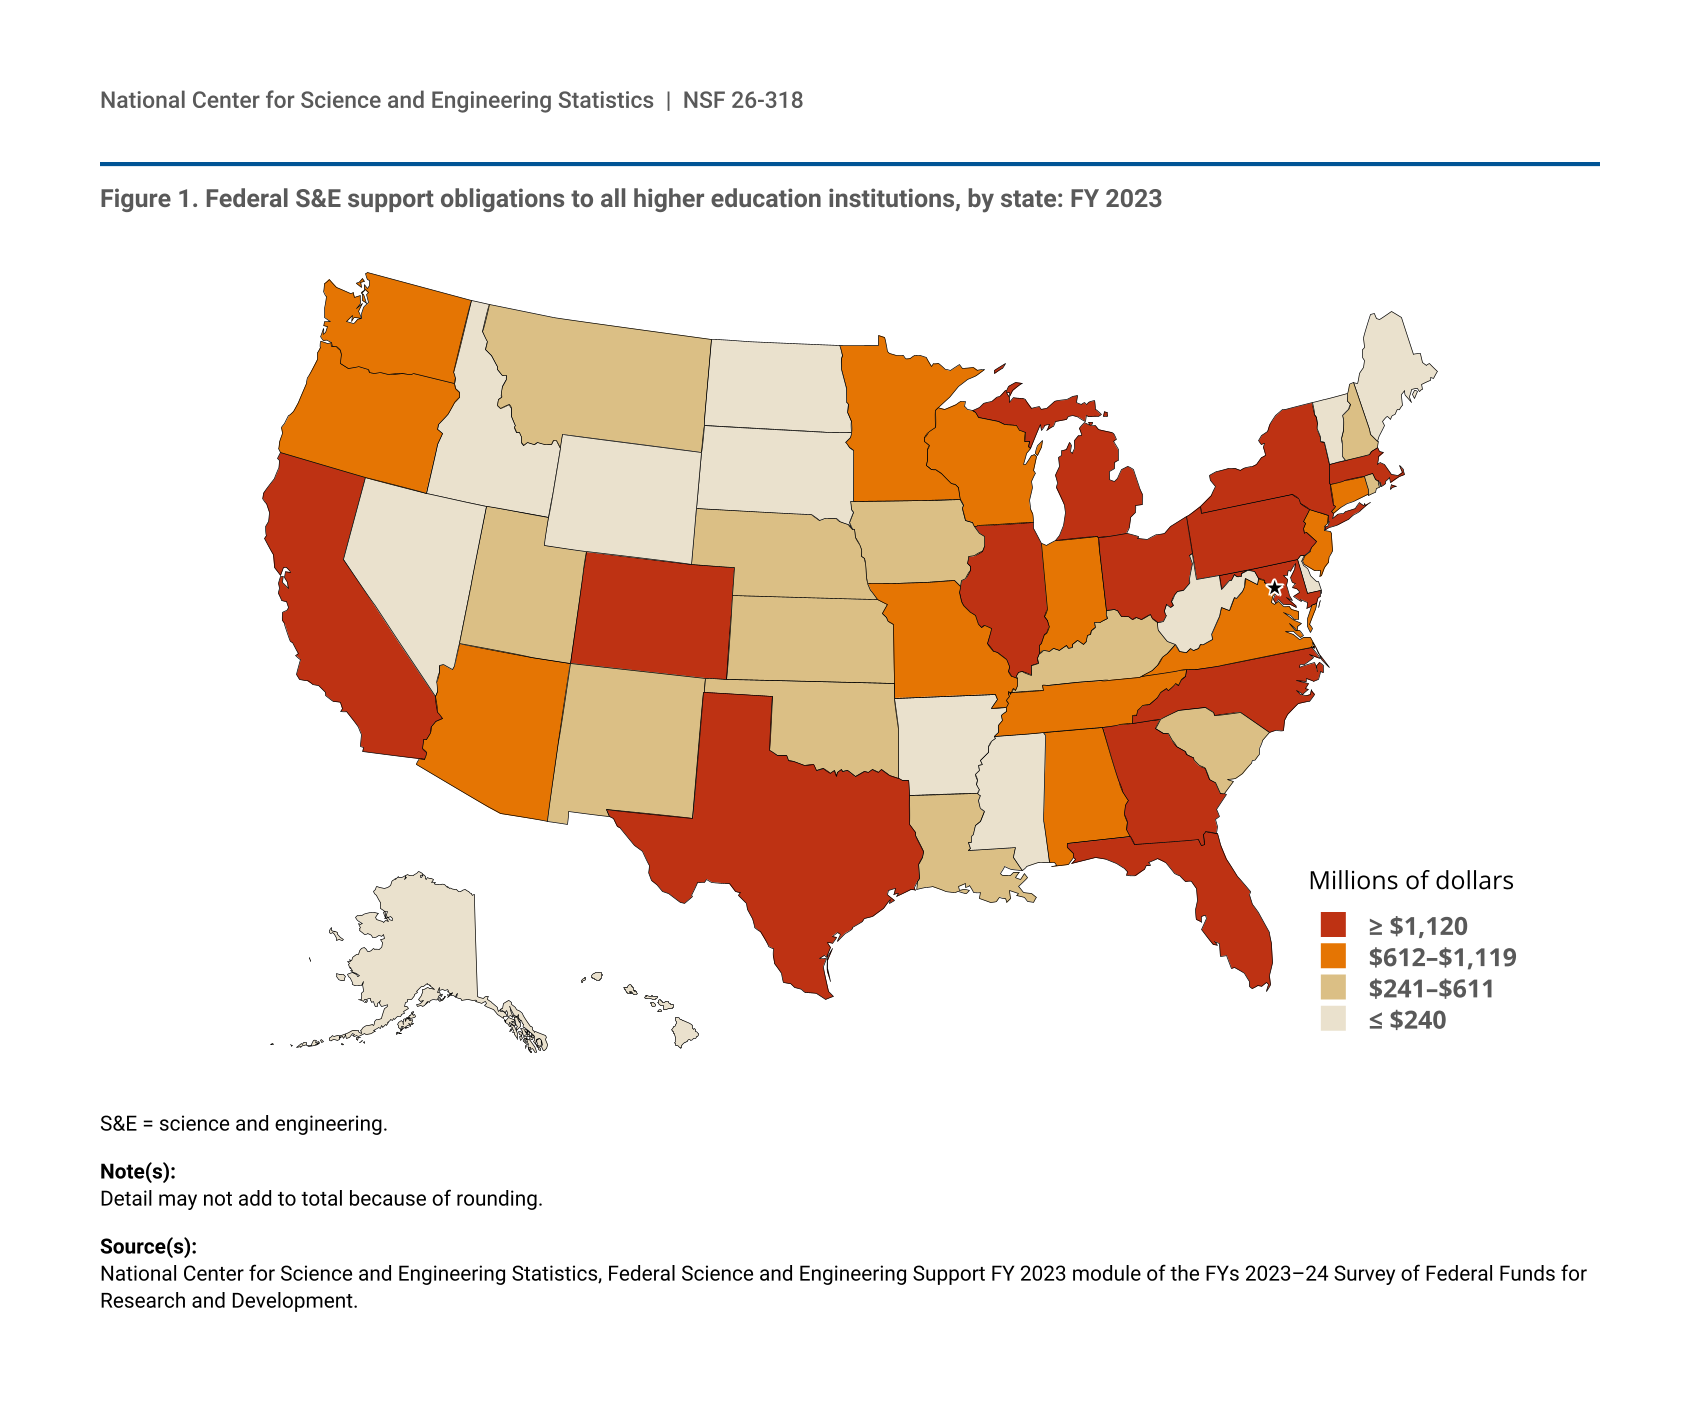
Federal agencies obligate funds to support S&E at institutions of higher education not only for the conduct of R&D but also to build capacity for R&D in the form of fellowships, traineeships, and training grants (FTTGs); facilities for instruction of S&E; R&D plant; general support for S&E; and other S&E support. In FY 2023, states in the top recipient quartile accounted for 65.2% ($31.8 billion) of total federal obligations for S&E support (figure 1). California leads all states with $6.1 billion in obligations. Federal obligations for S&E support to higher education institution within the second quartile totaled $10.7 billion, led by Missouri with $1.1 billion. The third quartile totals $4.4 billion in federal obligations for S&E support, led by Utah with $485 million, and the fourth quartile totaled $1.8 billion, led by Mississippi with $231 million. Although the raw totals on a state-by-state basis provide valuable information on where federal funding has been directed, they do not provide a normalized distribution of funding.
| State | Total S&E support obligations to all institutions |
|---|---|
| Alabama | 879 |
| Alaska | 148 |
| Arizona | 669 |
| Arkansas | 183 |
| California | 6,094 |
| Colorado | 1,262 |
| Connecticut | 921 |
| Delaware | 183 |
| District of Columbia | 628 |
| Florida | 1,431 |
| Georgia | 1,503 |
| Hawaii | 208 |
| Idaho | 87 |
| Illinois | 1,877 |
| Indiana | 811 |
| Iowa | 464 |
| Kansas | 458 |
| Kentucky | 364 |
| Louisiana | 364 |
| Maine | 126 |
| Maryland | 2,934 |
| Massachusetts | 2,459 |
| Michigan | 1,578 |
| Minnesota | 612 |
| Mississippi | 231 |
| Missouri | 1,076 |
| Montana | 417 |
| Nebraska | 281 |
| Nevada | 115 |
| New Hampshire | 285 |
| New Jersey | 617 |
| New Mexico | 250 |
| New York | 3,939 |
| North Carolina | 2,048 |
| North Dakota | 125 |
| Ohio | 1,163 |
| Oklahoma | 301 |
| Oregon | 647 |
| Pennsylvania | 2,629 |
| Rhode Island | 297 |
| South Carolina | 457 |
| South Dakota | 59 |
| Tennessee | 1,009 |
| Texas | 2,897 |
| Utah | 485 |
| Vermont | 167 |
| Virginia | 852 |
| Washington | 1,068 |
| West Virginia | 122 |
| Wisconsin | 953 |
| Wyoming | 61 |
S&E = science and engineering.
Detail may not add to total because of rounding.
National Center for Science and Engineering Statistics, Federal Science and Engineering Support FY 2023 module of the FYs 2023–24 Survey of Federal Funds for Research and Development.
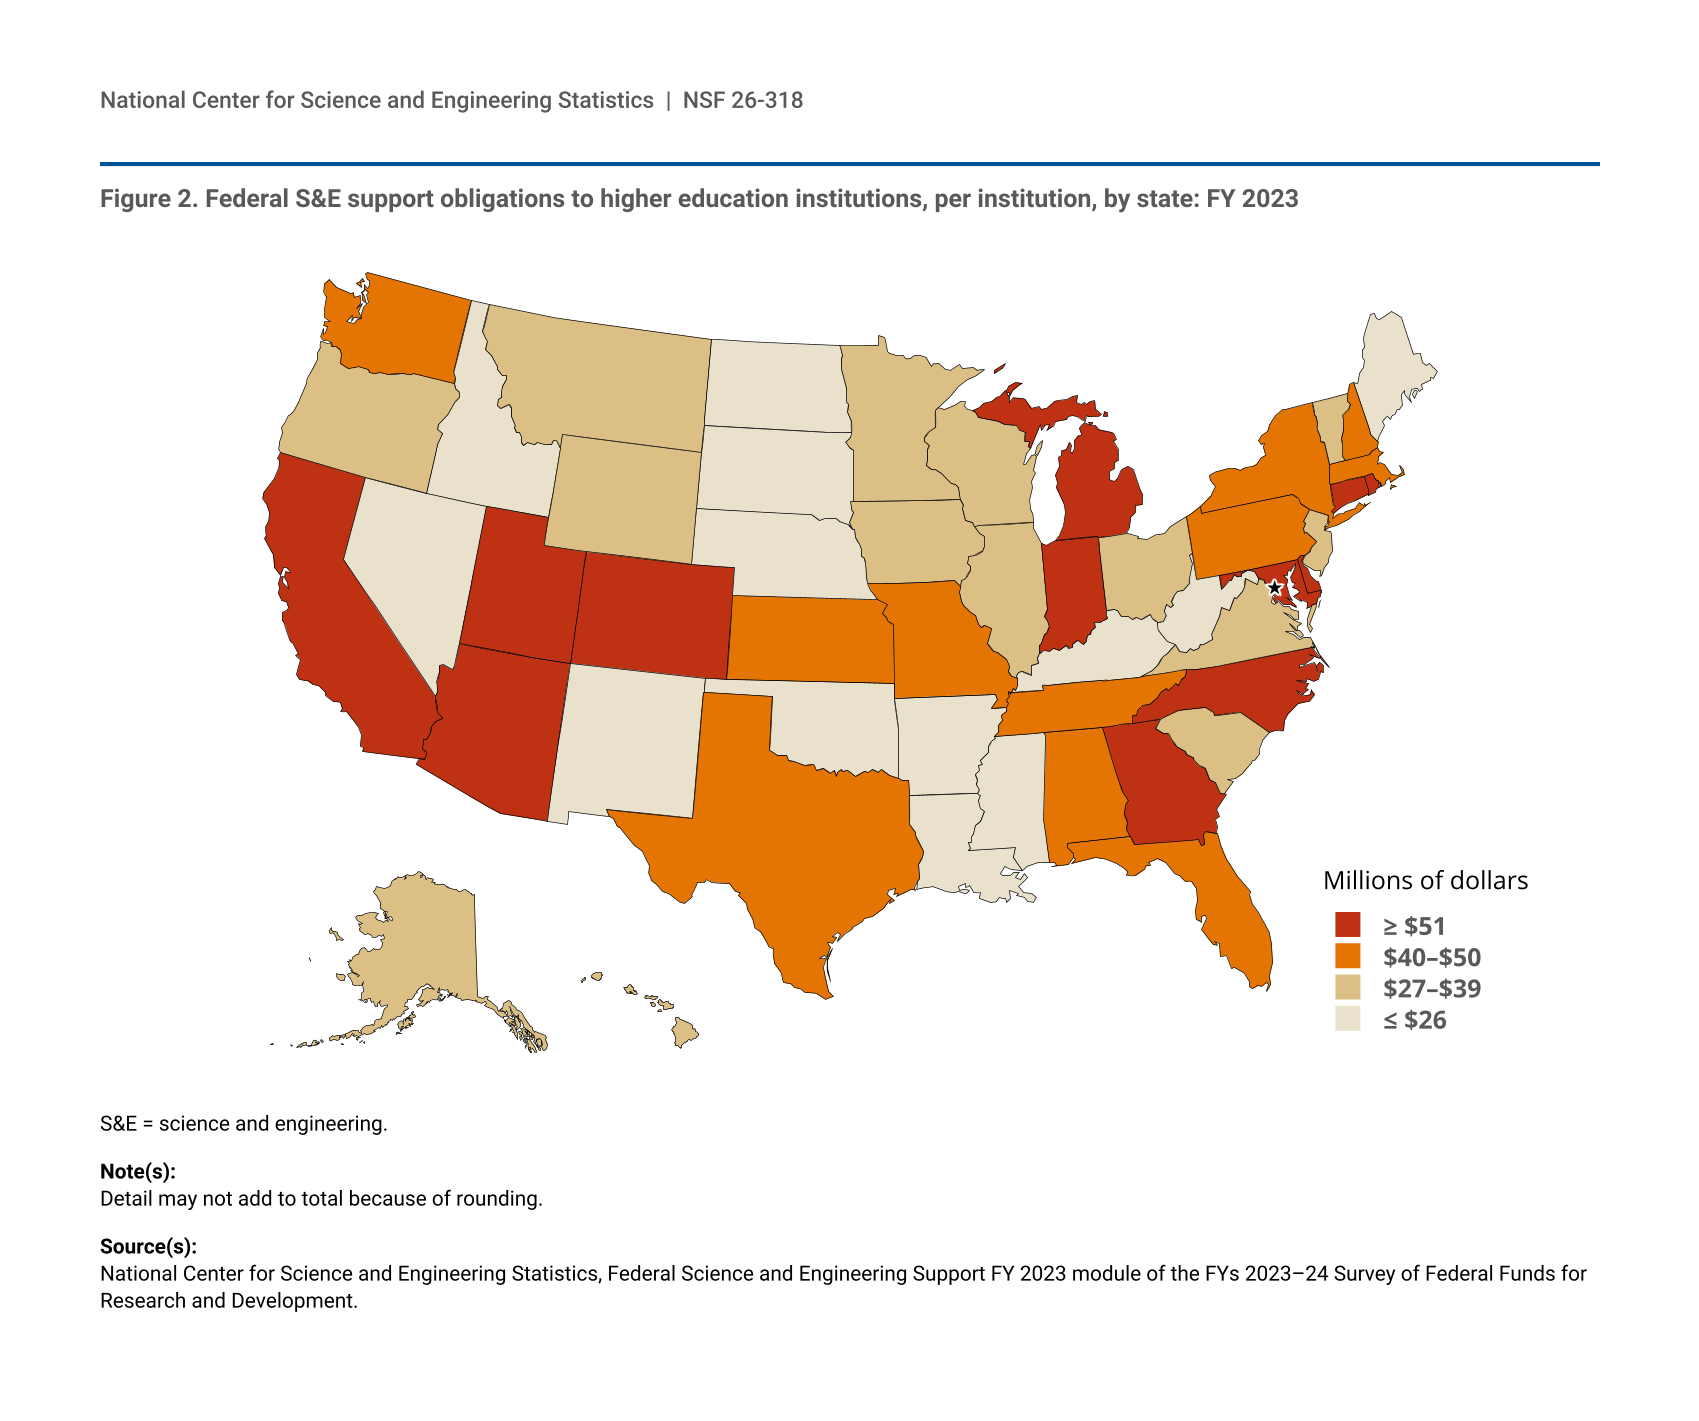
Federal S&E Obligations to Higher Education Institutions Normalized by the Number of Institutions per State
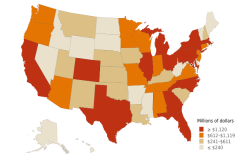
Because each state is different from one another in population, geography, legal organization, and economy, any direct comparison across states can be challenging without some means of normalizing the data. By adjusting the federal obligations data by the number of recipient institutions within each state we can analyze the allocation of federal funding to each state on a per-institution basis. This results in some changes from the raw data presented in figure 1. For example, in FY 2023, states such as New York, Massachusetts, Illinois, Pennsylvania, Ohio, Florida, and Texas drop out of the first quartile in figure 1 and are replaced with Arizona, Utah, Connecticut, Delaware, Georgia, Rhode Island, the District of Columbia, and Indiana (figure 2). On a per-institution basis, Maryland is the largest recipient of federal S&E support to higher education institutions with $113 million on average per institution. When normalized by the number of recipient institutions within the state, Arizona is the second-largest recipient with $84 million in federal S&E support, followed by California and Colorado with $72 million and $70 million, respectively.
| State | Average S&E obligations per institution |
|---|---|
| Alabama | 44 |
| Alaska | 30 |
| Arizona | 84 |
| Arkansas | 14 |
| California | 72 |
| Colorado | 70 |
| Connecticut | 61 |
| Delaware | 61 |
| District of Columbia | 52 |
| Florida | 43 |
| Georgia | 60 |
| Hawaii | 35 |
| Idaho | 22 |
| Illinois | 39 |
| Indiana | 51 |
| Iowa | 39 |
| Kansas | 46 |
| Kentucky | 24 |
| Louisiana | 24 |
| Maine | 13 |
| Maryland | 113 |
| Massachusetts | 46 |
| Michigan | 61 |
| Minnesota | 28 |
| Mississippi | 23 |
| Missouri | 45 |
| Montana | 35 |
| Nebraska | 22 |
| Nevada | 19 |
| New Hampshire | 41 |
| New Jersey | 27 |
| New Mexico | 23 |
| New York | 41 |
| North Carolina | 68 |
| North Dakota | 18 |
| Ohio | 28 |
| Oklahoma | 25 |
| Oregon | 38 |
| Pennsylvania | 45 |
| Rhode Island | 59 |
| South Carolina | 29 |
| South Dakota | 5 |
| Tennessee | 44 |
| Texas | 43 |
| Utah | 69 |
| Vermont | 28 |
| Virginia | 32 |
| Washington | 49 |
| West Virginia | 12 |
| Wisconsin | 35 |
| Wyoming | 30 |
S&E = science and engineering.
Detail may not add to total because of rounding.
National Center for Science and Engineering Statistics, Federal Science and Engineering Support FY 2023 module of the FYs 2023–24 Survey of Federal Funds for Research and Development.
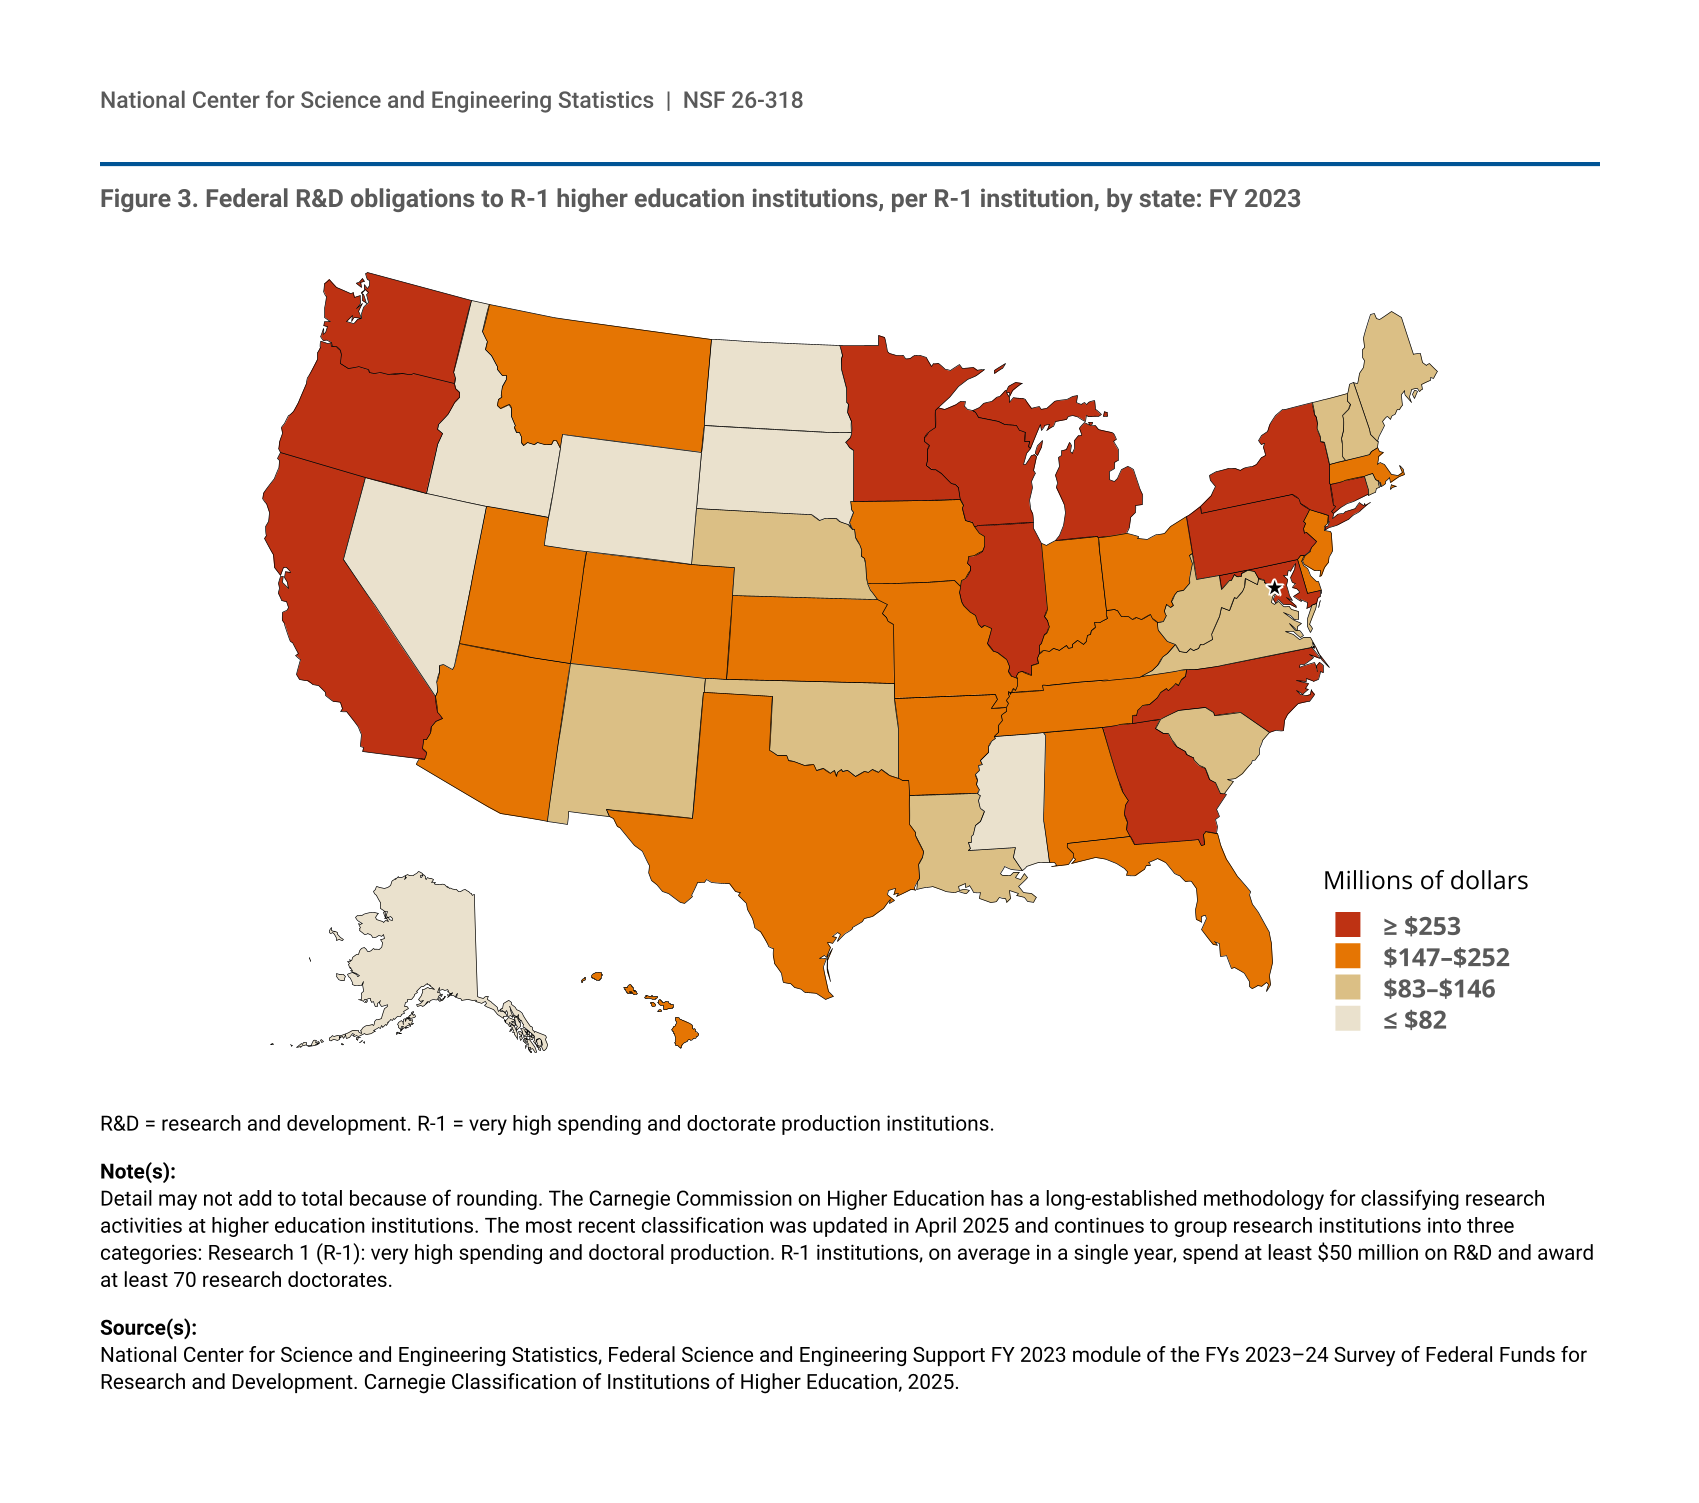
Federal R&D Obligations to Higher Education Institutions Normalized by the Number of R-1 Institutions per State
The Carnegie Commission on Higher Education has a long-established methodology for classifying research activities at higher education institutions as far back as 1973. The Carnegie Classification is used to study higher education through groupings of like institutions. The most recent classification was updated in April 2025 and continues to group research institutions into three categories: Research 1 (R-1): very high spending and doctoral production, Research 2 (R-2): high spending and doctorate production, and Research Colleges and Universities.
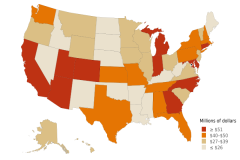
When R&D is normalized by the number of R-1 institutions per state, the dynamics of federal funding for R&D show an increased concentration in several upper Midwestern states, such as Minnesota, Missouri, and Wisconsin (figure 3). On a per institution basis, R&D obligations to R-1 institutions in Maryland, driven by substantial funding to the Johns Hopkins University Applied Physics Lab, leads all states with $704 million per institution, followed by Minnesota with $553 million and Washington with $483 million. Normalizing federal R&D obligations based on the number of R-1 institutions per state changes the ranking of federal funding to various states compared with the unadjusted totals for S&E support. However, it should be noted that two states (Alaska and South Dakota) do not have any R-1 institutions.
| State | Total R&D obligations per R-1 institution |
|---|---|
| Alabama | 213 |
| Alaska | 0 |
| Arizona | 200 |
| Arkansas | 154 |
| California | 413 |
| Colorado | 235 |
| Connecticut | 430 |
| Delaware | 166 |
| District of Columbia | 114 |
| Florida | 167 |
| Georgia | 338 |
| Hawaii | 178 |
| Idaho | 71 |
| Illinois | 293 |
| Indiana | 190 |
| Iowa | 209 |
| Kansas | 189 |
| Kentucky | 164 |
| Louisiana | 108 |
| Maine | 90 |
| Maryland | 704 |
| Massachusetts | 213 |
| Michigan | 367 |
| Minnesota | 553 |
| Mississippi | 68 |
| Missouri | 186 |
| Montana | 195 |
| Nebraska | 128 |
| Nevada | 51 |
| New Hampshire | 133 |
| New Jersey | 194 |
| New Mexico | 107 |
| New York | 307 |
| North Carolina | 382 |
| North Dakota | 58 |
| Ohio | 153 |
| Oklahoma | 132 |
| Oregon | 297 |
| Pennsylvania | 351 |
| Rhode Island | 139 |
| South Carolina | 126 |
| South Dakota | 0 |
| Tennessee | 224 |
| Texas | 167 |
| Utah | 150 |
| Vermont | 128 |
| Virginia | 131 |
| Washington | 483 |
| West Virginia | 105 |
| Wisconsin | 441 |
| Wyoming | 57 |
R&D = research and development. R-1 = very high spending and doctorate production institutions.
Detail may not add to total because of rounding. The Carnegie Commission on Higher Education has a long-established methodology for classifying research activities at higher education institutions. The most recent classification was updated in April 2025 and continues to group research institutions into three categories: Research 1 (R-1): very high spending and doctoral production. R-1 institutions, on average in a single year, spend at least $50 million on R&D and award at least 70 research doctorates.
National Center for Science and Engineering Statistics, Federal Science and Engineering Support FY 2023 module of the FYs 2023–24 Survey of Federal Funds for Research and Development. Carnegie Classification of Institutions of Higher Education, 2025.
Data Sources, Limitations, and Availability
The Survey of Federal S&E Support to Universities, Colleges, and Nonprofit Institutions has been collected as a module within the Survey of Federal Funds for R&D since the FY 2021 survey cycle. Prior to 2021, these data were collected through a separate survey. For FY 2023, data were obtained from 30 federal agencies (14 federal departments and 16 independent agencies) that had obligations for R&D during FY 2023 or FY 2024. Because multiple subdivisions of some federal departments completed the survey, there were 68 agency-level responses: 6 federal departments, 46 agencies (within another 8 federal departments), and 16 independent agencies. However, lower offices could also be authorized to enter data: in the Survey of Federal Funds for R&D nomenclature, agency-level offices could authorize program offices, program offices could authorize field offices, and field offices could authorize branch offices. When these suboffices are included, there were 587 total respondents: 68 agencies, 105 program offices, 183 field offices, and 231 branch offices. Of these, 52 agencies, 55 program offices, 12 field offices, and zero branch offices reported obligations within the Survey of Federal S&E Support module. The module collects federal S&E support data by funding agencies, individually named institutions, type of activity, type of institution, and geographic location. There are six types of activities for federal S&E support:
- Research and experimental development (R&D) includes all direct, indirect, incidental, or related costs resulting from or necessary to perform R&D by private individuals and organizations under grant, contract, or cooperative agreement.
- R&D plant includes all projects whose principal purpose is to provide support for construction, acquisition, renovation, modification, repair, or rental of facilities, land, works, or fixed equipment for use in scientific or engineering R&D.
- Facilities and equipment for S&E instruction includes all programs whose principal purpose is to provide support for construction, acquisition, renovation, modification, repair, or rental of facilities, land, works, or equipment for use in instruction in S&E.
- Fellowships, traineeships, and training grants (FTTGs) includes all fellowship, traineeship, and training grant programs that are directed primarily toward the development and maintenance of the scientific workforce.
- General support for S&E includes funds used for scientific projects and support for activities within a specified discipline; explicit purpose is not specified.
- Other S&E activities includes all academic S&E obligations that cannot be assigned elsewhere and activities in support of technical conferences, teacher institutes, and programs aimed at increasing precollege and undergraduate students’ scientific knowledge.
The Survey of Federal S&E Support module within the Survey of Federal Funds for R&D is a census of federal agencies that fund R&D and S&E support. As such, there is no sampling error; however, survey data are still subject to some degree of unmeasured nonsampling error that may include errors in classification or measurement of certain aspects of an agency’s S&E support. For additional information, see the “Survey Quality Measures” within the Technical Notes of the survey.
Although the $49.0 billion in total federal agency obligations to higher education institutions for S&E support includes funding to the U.S. territories, for presentation purposes they are excluded from this InfoBrief. However, specific data on federal agency funding to the higher education within each of the individual U.S. territories are available in the full set of data tables. The full set of data tables on the FY 2023 Survey of Federal S&E Support to Universities, Colleges, and Nonprofit Institutions are available at https://ncses.nsf.gov/surveys/federal-support-survey/2023#data. Data for the survey are also available in NCSES’s interactive data tool. For more information, please contact NCSES.
NCSES has reviewed this product for unauthorized disclosure of confidential information and approved its release (NCSES-DRN25-021).
Notes
1 Details available in the full set of data tables: table 9.
2 Obligations represent the amount for orders placed, contracts awarded, services received, and similar transactions during a given period, regardless of when funds were appropriated or when future payment of money is required.
3 Details available in the full set of data tables: table 9.
4 The Carnegie Classification of Institutions of Higher Education include three separate designation of research institutions: Research 1 (R-1), Research 2 (R-2), and Research Colleges and Universities. R-1 institutions, on average in a single year, spend at least $50 million on R&D and award at least 70 research doctorates. For more information on the Carnegie Classification of Institutions of Higher Education, see https://carnegieclassifications.acenet.edu/carnegie-classification/classification-methodology/2025-research-activity-designations/.
5 Federal S&E support obligations for the 50 states and the District of Columbia presented in this InfoBrief have been separated into quartiles to improve interpretability by highlighting relative categories rather than specific numeric differences.
6 The Johns Hopkins University consistently receives the largest amount of federal S&E support with $2.1 billion in FY 2023—nearly $1.2 billion more than the next institution, the University of Michigan, which received $966 million. Details available in the full set of data tables: table 17. Data users should note that Johns Hopkins University includes the Applied Physics Laboratory, 1 of the 15 University Affiliated Research Centers. For data on specific university affiliated research centers, see the Survey of Federal Funds for R&D’s full set of data tables: tables 44–46.
7 For more information about the Carnegie Classifications, see https://carnegieclassifications.acenet.edu/carnegie-classification/.
8 Research activity designations use the higher of either a 3-year average (2021, 2022, 2023) or the most recent single-year data (2023). In future releases, the designations will use only a 3-year average. Spending data is taken from the Higher Education Research and Development Survey for FY 2021, FY 2022, and FY 2023 and reflects the total R&D expenditures. Research doctorate awards are taken from data reported to the National Center for Education Statistics (NCES) Integrated Postsecondary Education Data System (IPEDS) for academic years 2020–21, 2021–22, and 2022–23. For additional details, see https://carnegieclassifications.acenet.edu/carnegie-classification/classification-methodology/2025-research-activity-designations/.
9 Although the NCSES data from the Survey of Federal S&E Support module are from FY 2023, the analysis in this InfoBrief use the most recent Carnegie Classification from 2025.
10 Survey technical notes are available at https://ncses.nsf.gov/surveys/federal-support-survey/2023#technical-notes.
Suggested Citation
National Center for Science and Engineering Statistics (NCSES). 2026. Distribution of Federal Science and Engineering Support to Higher Education Institutions Across States. NSF 26-318. Alexandria, VA: U.S. National Science Foundation. Available at https://ncses.nsf.gov/pubs/nsf26318.
Contact Us
National Center for Science and Engineering Statistics
Directorate for Social, Behavioral and Economic Sciences
U.S. National Science Foundation
Tel: (703) 292-8780
FIRS: (800) 877-8339
TDD: (800) 281-8749
E-mail: ncsesweb@nsf.gov