 An official website of the United States government
In FY 2024, Federal Science and Engineering Support for Higher Education Declined 4.3% from FY 2023; Federal Obligations to Nonprofits Totaled $11 Billion
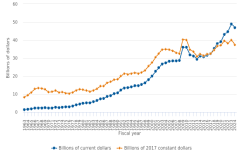
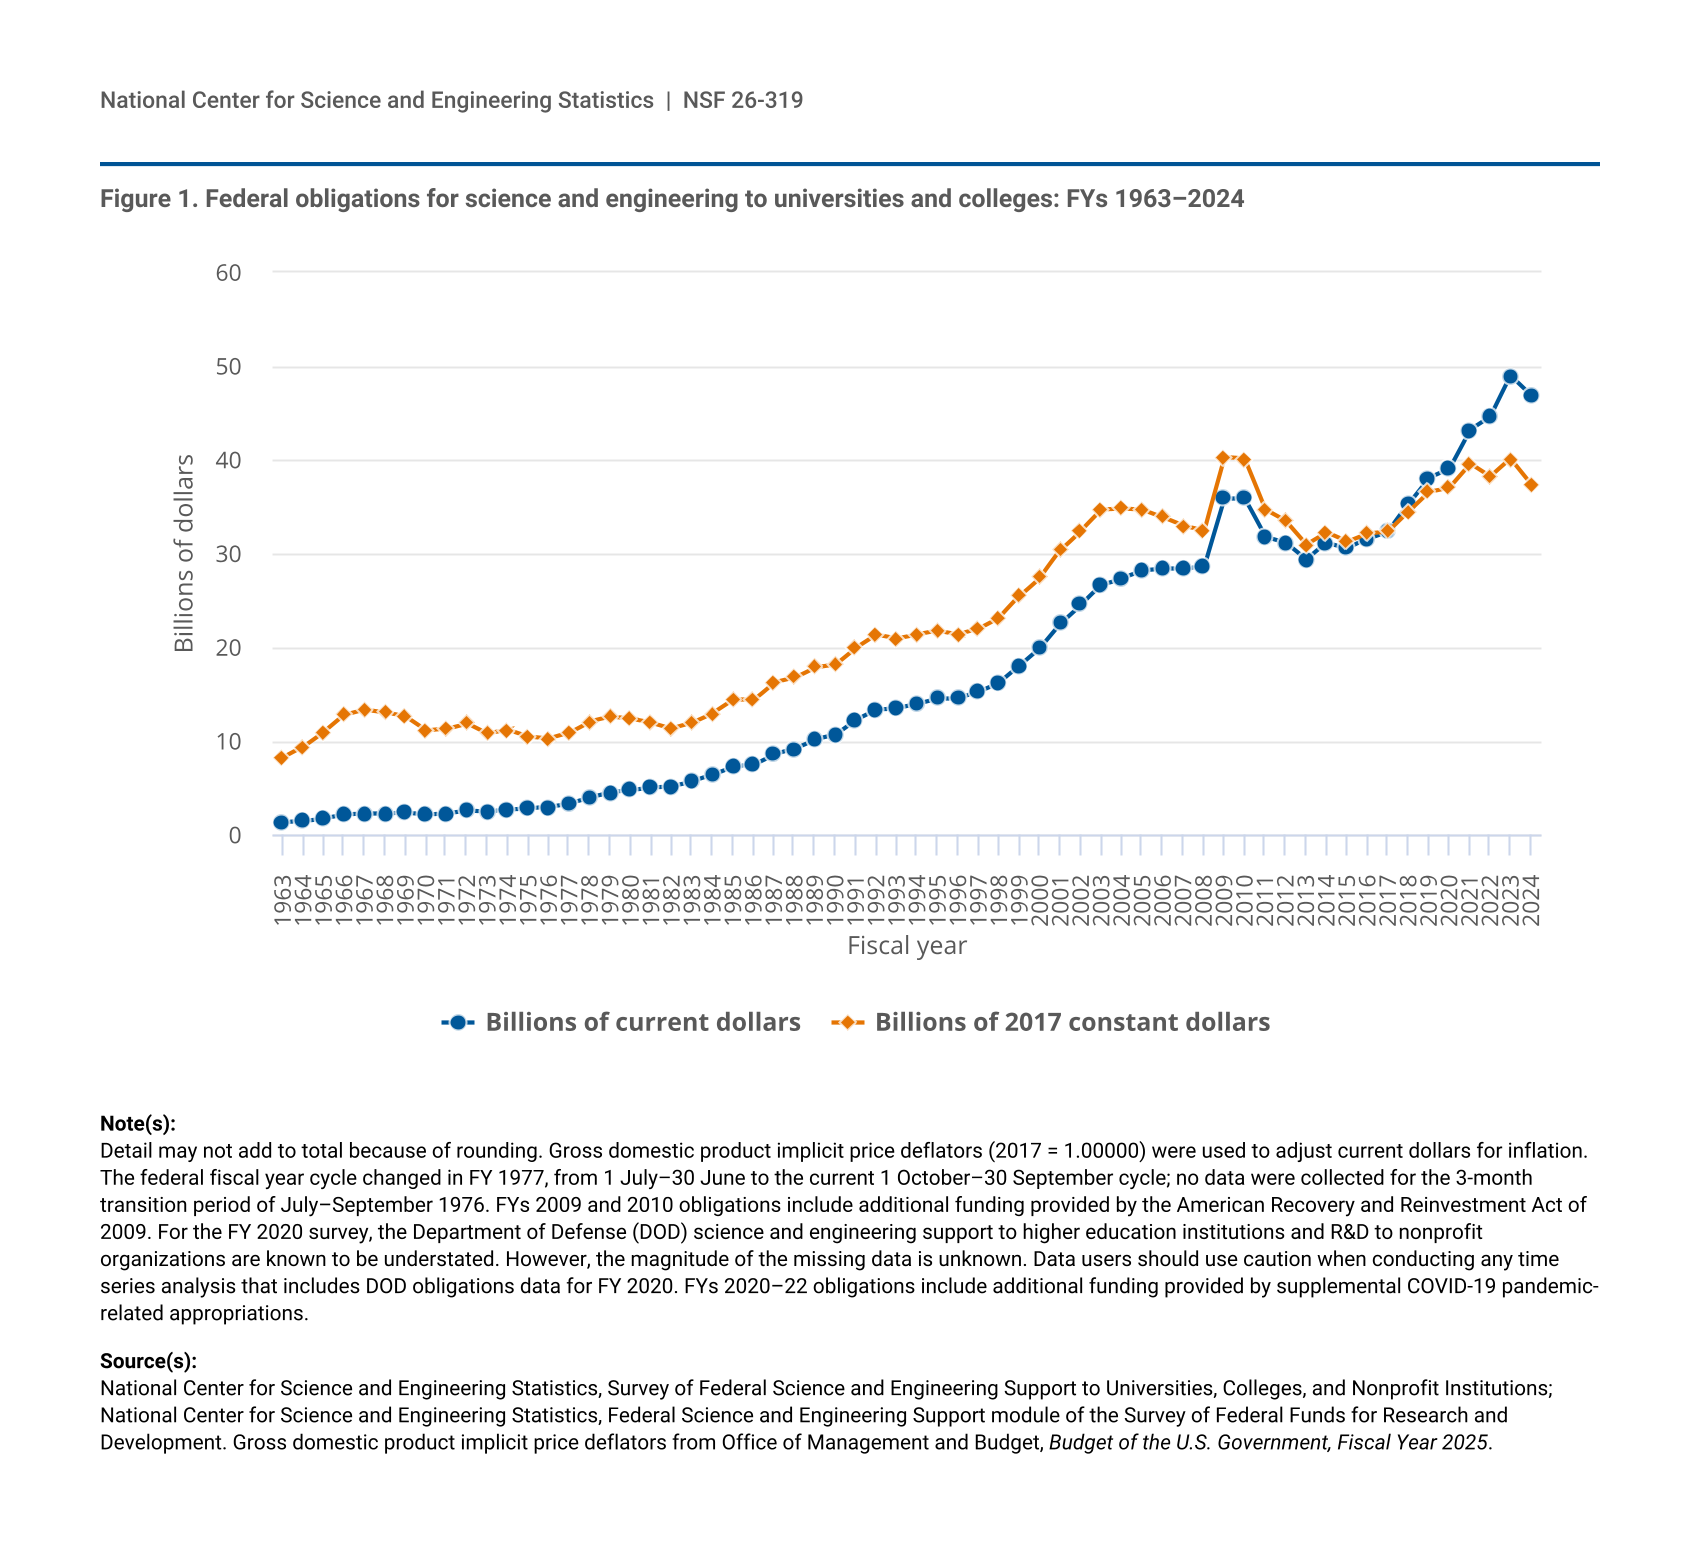
Federal agency obligations to higher education institutions for support of science and engineering (S&E) activities totaled $46.9 billion in FY 2024, a decrease of 4.3% from the $49.0 billion in FY 2023 (table 1). Federal S&E support is composed of five main categories: research and experimental development (R&D); R&D plant; facilities and equipment for instruction in S&E; S&E fellowships, traineeships, and training grants (FTTGs); and other general support for S&E. In FY 2024, R&D was the largest component of federal S&E support to higher education institutions ($43.9 billion), decreasing 2.4% from the FY 2023 total of $45.0 billion. Federal obligations for S&E FTTGs totaled $2.1 billion in FY 2024, decreasing 13.9% from the FY 2023 total of $2.5 billion.
S&E = science and engineering.
Detail may not add to total because of rounding.
National Center for Science and Engineering Statistics, Federal Science and Engineering Support module of the Survey of Federal Funds for Research and Development.
When adjusted for inflation, federal obligations showed a decrease of 6.8% on a constant dollar basis, from $40.1 billion in FY 2023 to $37.4 billion in FY 2024 (figure 1). Furthermore, the constant dollar adjustment showed that the FY 2024 total was below the all-time adjusted high of $40.3 billion set in FY 2009 when federal obligations were supported from the American Recovery and Reinvestment Act of 2009 (P.L. 111-5). Unless otherwise noted, all data presented in this report are in current dollars. These and other estimates in this InfoBrief are from the FY 2024 Survey of Federal Science and Engineering Support to Universities, Colleges, and Nonprofit Institutions, conducted by the National Center for Science and Engineering Statistics (NCSES) within the U.S. National Science Foundation (NSF).
| Fiscal year | Billions of current dollars | Billions of 2017 constant dollars |
|---|---|---|
| 1963 | 1.3 | 8.3 |
| 1964 | 1.5 | 9.4 |
| 1965 | 1.8 | 11.0 |
| 1966 | 2.2 | 12.8 |
| 1967 | 2.3 | 13.4 |
| 1968 | 2.3 | 13.1 |
| 1969 | 2.4 | 12.6 |
| 1970 | 2.2 | 11.1 |
| 1971 | 2.3 | 11.3 |
| 1972 | 2.6 | 11.9 |
| 1973 | 2.5 | 10.8 |
| 1974 | 2.7 | 11.2 |
| 1975 | 2.8 | 10.5 |
| 1976 | 3.0 | 10.3 |
| 1977 | 3.4 | 10.9 |
| 1978 | 4.0 | 12.1 |
| 1979 | 4.5 | 12.6 |
| 1980 | 4.8 | 12.4 |
| 1981 | 5.1 | 12.0 |
| 1982 | 5.2 | 11.4 |
| 1983 | 5.7 | 12.0 |
| 1984 | 6.4 | 13.0 |
| 1985 | 7.3 | 14.4 |
| 1986 | 7.5 | 14.4 |
| 1987 | 8.6 | 16.3 |
| 1988 | 9.2 | 16.8 |
| 1989 | 10.2 | 17.9 |
| 1990 | 10.7 | 18.2 |
| 1991 | 12.3 | 20.0 |
| 1992 | 13.4 | 21.4 |
| 1993 | 13.5 | 21.0 |
| 1994 | 14.0 | 21.4 |
| 1995 | 14.6 | 21.8 |
| 1996 | 14.6 | 21.4 |
| 1997 | 15.3 | 22.0 |
| 1998 | 16.3 | 23.2 |
| 1999 | 18.1 | 25.5 |
| 2000 | 20.0 | 27.5 |
| 2001 | 22.6 | 30.4 |
| 2002 | 24.6 | 32.5 |
| 2003 | 26.7 | 34.7 |
| 2004 | 27.4 | 34.8 |
| 2005 | 28.2 | 34.7 |
| 2006 | 28.4 | 33.9 |
| 2007 | 28.4 | 33.0 |
| 2008 | 28.6 | 32.5 |
| 2009 | 35.9 | 40.3 |
| 2010 | 35.9 | 40.1 |
| 2011 | 31.8 | 34.7 |
| 2012 | 31.2 | 33.5 |
| 2013 | 29.4 | 31.0 |
| 2014 | 31.2 | 32.3 |
| 2015 | 30.6 | 31.3 |
| 2016 | 31.6 | 32.2 |
| 2017 | 32.4 | 32.4 |
| 2018 | 35.3 | 34.5 |
| 2019 | 38.1 | 36.6 |
| 2020 | 39.1 | 37.1 |
| 2021 | 43.2 | 39.6 |
| 2022 | 44.6 | 38.2 |
| 2023 | 49.0 | 40.1 |
| 2024 | 46.9 | 37.4 |
Detail may not add to total because of rounding. Gross domestic product implicit price deflators (2017 = 1.00000) were used to adjust current dollars for inflation. The federal fiscal year cycle changed in FY 1977, from 1 July–30 June to the current 1 October–30 September cycle; no data were collected for the 3-month transition period of July–September 1976. FYs 2009 and 2010 obligations include additional funding provided by the American Recovery and Reinvestment Act of 2009. For the FY 2020 survey, the Department of Defense (DOD) science and engineering support to higher education institutions and R&D to nonprofit organizations are known to be understated. However, the magnitude of the missing data is unknown. Data users should use caution when conducting any time series analysis that includes DOD obligations data for FY 2020. FYs 2020–22 obligations include additional funding provided by supplemental COVID-19 pandemic-related appropriations.
National Center for Science and Engineering Statistics, Survey of Federal Science and Engineering Support to Universities, Colleges, and Nonprofit Institutions; National Center for Science and Engineering Statistics, Federal Science and Engineering Support module of the Survey of Federal Funds for Research and Development. Gross domestic product implicit price deflators from Office of Management and Budget, Budget of the U.S. Government, Fiscal Year 2025.
Federal S&E Obligations to Higher Education Institutions
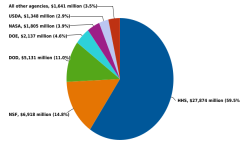
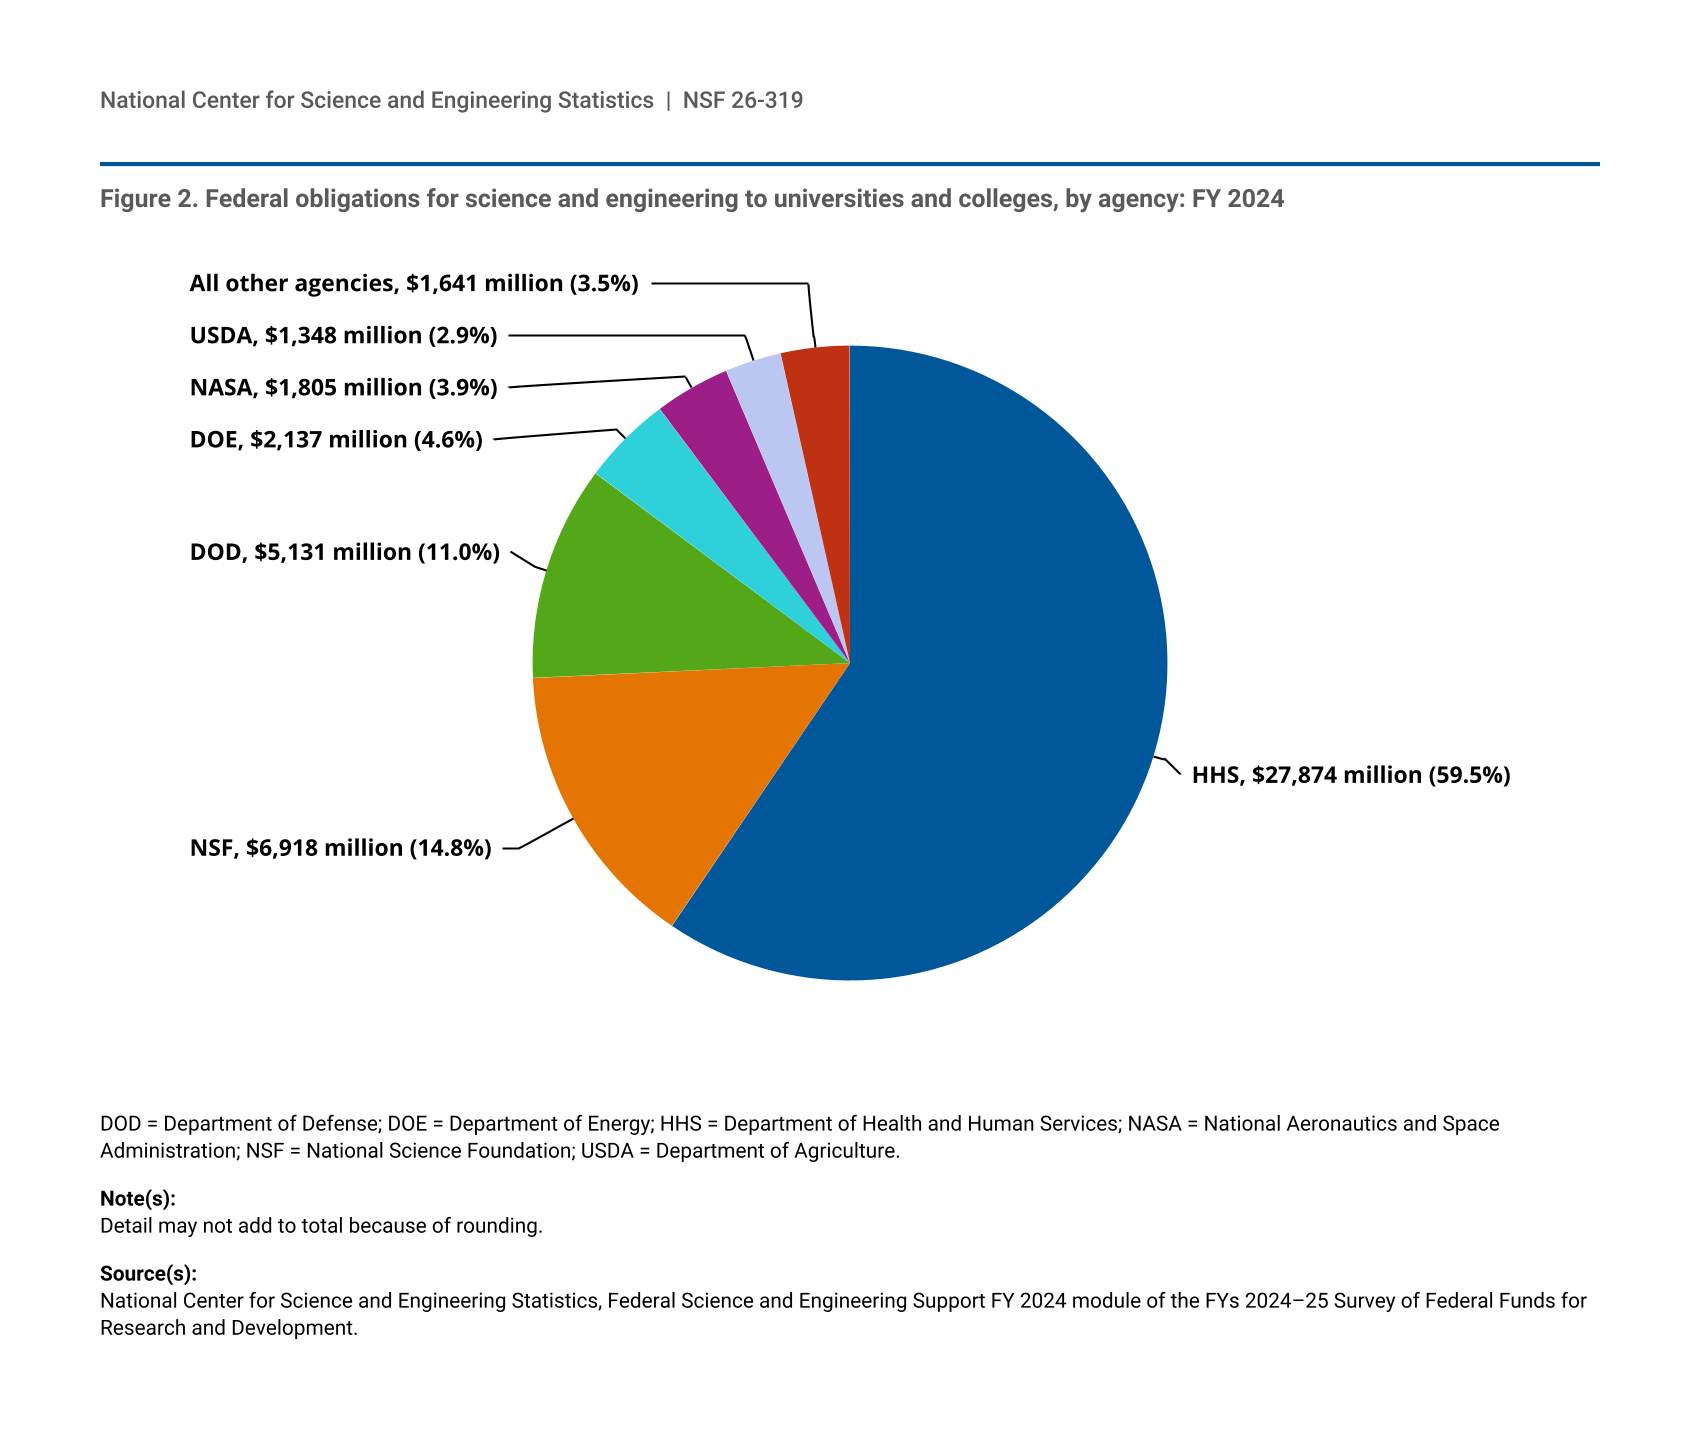
In FY 2024, the Department of Health and Human Services (HHS) obligated $27.9 billion to higher education institutions for the support of S&E, or 59.5% of the total federal obligations (figure 2). NSF, the second-largest funding agency, accounted for $6.9 billion (14.8% of the total), followed by the Department of Defense (DOD) at $5.1 billion (11.0%). The Department of Energy (DOE) obligated $2.1 billion (4.6%). The National Aeronautics and Space Administration (NASA) and the Department of Agriculture (USDA) obligations totaled $1.8 billion (3.9%) and $1.3 billion (2.9%), respectively. All other agencies combined obligated $1.6 billion (3.5%).
| Agency | Dollars in millions | Percent |
|---|---|---|
| HHS | 27,874 | 59.5 |
| NSF | 6,918 | 14.8 |
| DOD | 5,131 | 11.0 |
| DOE | 2,137 | 4.6 |
| NASA | 1,805 | 3.9 |
| USDA | 1,348 | 2.9 |
| All other agencies | 1,641 | 3.5 |
DOD = Department of Defense; DOE = Department of Energy; HHS = Department of Health and Human Services; NASA = National Aeronautics and Space Administration; NSF = National Science Foundation; USDA = Department of Agriculture.
Detail may not add to total because of rounding.
National Center for Science and Engineering Statistics, Federal Science and Engineering Support FY 2024 module of the FYs 2024–25 Survey of Federal Funds for Research and Development.
For the FY 2024 survey responses, nearly all agencies showed declines from FY 2023. However, an analysis of data from the past three data collection cycles suggests that FY 2023 represented a higher than average funding level, and the current levels reflect a return to previous cycles’ funding patterns. Several agencies noted the nearly 10% year-to-year increase (one of the largest year-to-year changes since 1999) in FY 2023 was due to funds initially appropriated in FY 2022 that were not completely obligated until FY 2023. This includes obligations of funds originally appropriated as part of the FY 2022 Consolidated Appropriations Act (P.L. 117-103), which was not signed into law until 15 March 2022. As such, FY 2023 obligations included not only funds from the FY 2023 Consolidated Appropriations Act (P.L. 117-328) but also some FY 2022 appropriations.
Higher Education Recipient Institutions of Federal S&E Support
In FY 2024, federal agencies obligated S&E funding to 1,125 institutions of higher education in the United States. However, federal funding for S&E support is concentrated within a relatively few institutions, as they already have existing capacity for attaining traditional federal R&D funding. For example, the top 25 recipient institutions, nearly all of which include a medical school or university hospital, of federal obligations for S&E support accounted for $19.2 billion, or 41.1% of all federal S&E support to all institutions of higher education (table 2). Of the $19.2 billion obligated to these 25 institutions, $18.4 billion (95.7%) was for R&D and $680 million (3.5%) was for S&E FTTGs. Johns Hopkins University continued to receive the largest amount of federal S&E support with $2.3 billion in FY 2024, nearly $1.4 billion more than the next institution, the University of Michigan, which received $941 million. Data users should note that Johns Hopkins University includes the Applied Physics Laboratory, which is 1 of the 15 University Affiliated Research Centers. The top 100 recipient institutions combined received $37.2 billion, or 79.5% of all federal S&E support to higher education institutions. Therefore, the remaining 1,025 institutions, or 91.1% of all higher education institutions receiving federal funds for S&E support, received $9.6 billion, or 20.5% of all federal S&E support. At these 1,025 institutions, R&D obligations totaled $8.4 billion, or 19.1% of all federal R&D obligations to higher education institutions. When it comes to S&E FTTGs, often considered a means for building capacity for R&D, these same 1,025 institutions received $876 million, or 41.4% of all S&E FTTG obligations in FY 2024.
* = amount greater than $0 but less than $500,000.00.
S&E = science and engineering.
Detail may not add to total because of rounding. Institution order is based on total actual dollars received before amounts are rounded.
National Center for Science and Engineering Statistics, Federal Science and Engineering Support FY 2024 module of the FYs 2024–25 Survey of Federal Funds for Research and Development.
Federal R&D and R&D Plant Obligations to Nonprofit Organizations
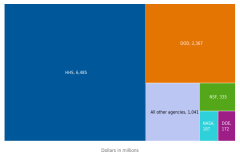
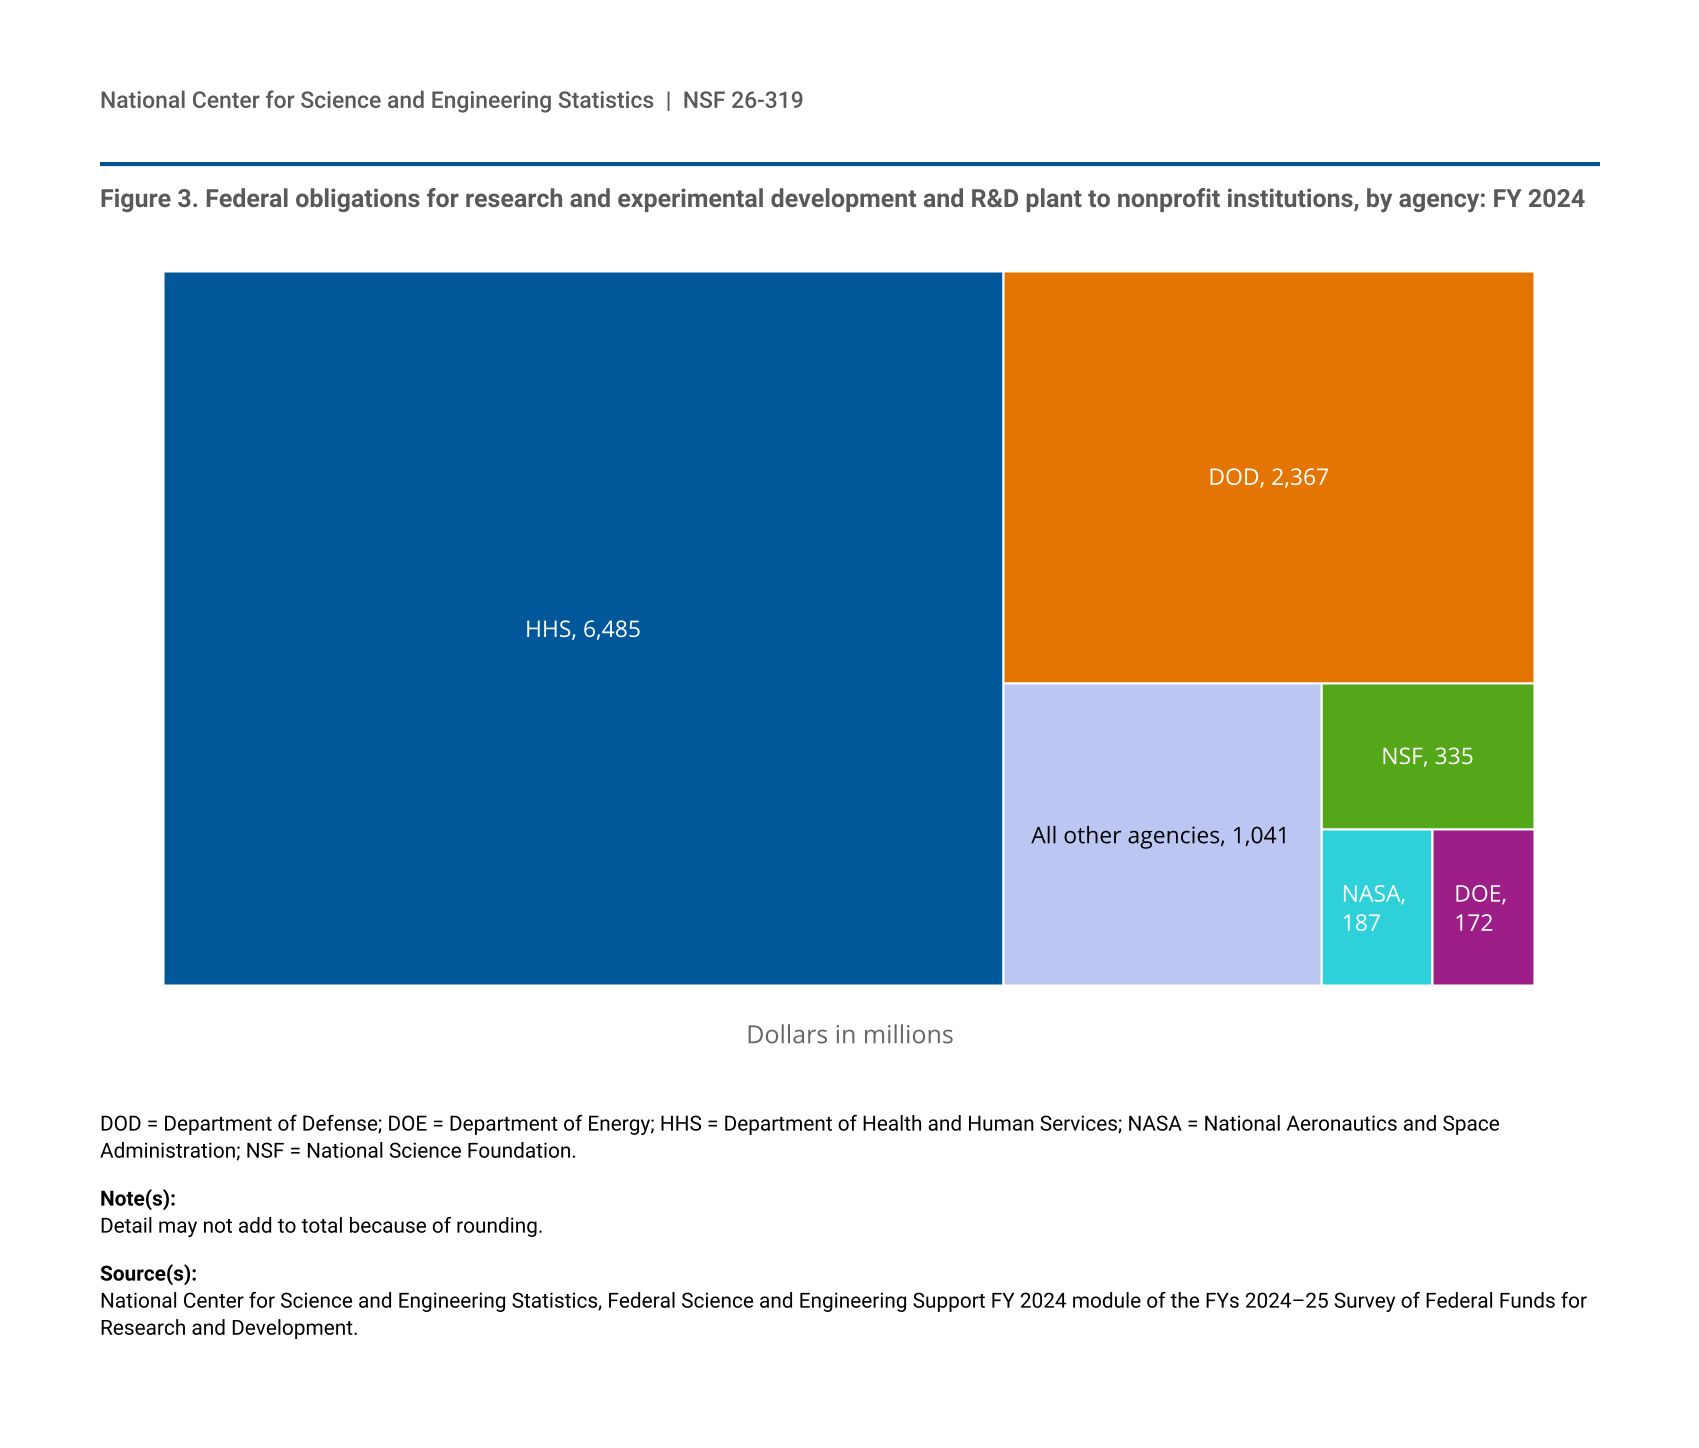
In addition to collecting data on S&E support to higher education institutions, the Survey of Federal Science and Engineering Support to Universities, Colleges, and Nonprofit Institutions collects data on federal obligations to individually identified nonprofit organizations. In FY 2024, total federal obligations to all nonprofit organizations for R&D and R&D plant totaled $10.6 billion. HHS was the largest funder of nonprofits for R&D and R&D plant with $6.5 billion, or 61.3% of the total (figure 3). DOD is the second-largest funder of R&D and R&D plant to nonprofit organizations with $2.4 billion, or 22.4% of total federal obligations.
| Agency | Dollars in millions |
|---|---|
| HHS | 6,485 |
| DOD | 2,367 |
| NSF | 335 |
| NASA | 187 |
| DOE | 172 |
| All other agencies | 1,041 |
DOD = Department of Defense; DOE = Department of Energy; HHS = Department of Health and Human Services; NASA = National Aeronautics and Space Administration; NSF = National Science Foundation.
Detail may not add to total because of rounding.
National Center for Science and Engineering Statistics, Federal Science and Engineering Support FY 2024 module of the FYs 2024–25 Survey of Federal Funds for Research and Development.
The concentration of funding to a relatively small set of recipient organizations discussed previously for federal S&E support to higher education institutions is similar to the distribution of federal obligations for R&D and R&D plant to nonprofit organizations. For example, out of 1,028 recipient nonprofit organizations, the top 25 accounted for $6.1 billion, or 57.6% of all federal obligations for R&D and R&D plant to nonprofits (table 3). The top 100 recipient organizations totaled $8.8 billion in FY 2024. The remaining 928 recipient organizations in total received $1.7 billion, or 16.5% of all federal obligations for R&D and R&D plant to the nonprofit sector.
* = amount greater than $0 but less than $500,000.00.
DOD = Department of Defense; DOE = Department of Energy; HHS = Department of Health and Human Services; NASA = National Aeronautics and Space Administration; NSF = National Science Foundation.
a Other includes obligations from the following agencies: the Agency for International Development, the Appalachian Regional Commission, the Department of Homeland Security, the Department of Justice, the Department of Transportation, the Patient-Centered Outcomes Research Trust Fund, the Social Security Administration, and the Tennessee Valley Authority.
Detail may not add to total because of rounding. Institution order is based on total actual dollars received before amounts are rounded; institutions receiving the same amount of actual dollars are listed alphabetically.
National Center for Science and Engineering Statistics, Federal Science and Engineering Support FY 2024 module of the FYs 2024–25 Survey of Federal Funds for Research and Development.
Data Sources, Limitations, and Availability
Starting with the FY 2021 survey cycle, the Survey of Federal Science and Engineering Support to Universities, Colleges, and Nonprofit Institutions has been collected as a module within the Survey of Federal Funds for R&D. For FY 2024, data were obtained from 29 federal agencies (14 federal departments and 15 independent agencies) that had obligations for R&D during FY 2024 or FY 2025. Because multiple subdivisions of some federal departments completed the survey, there were agency-level responses from 6 federal departments, 46 agencies (within another 8 federal departments), and 15 independent agencies. However, lower offices could also be authorized to enter data. In nomenclature from the Survey of Federal Funds for R&D, agency-level offices could authorize program offices, program offices could authorize field offices, and field offices could authorize branch offices. The module collects federal S&E support data by funding agency, individually named institution, type of activity, type of institution, and geographic location.
The six funding categories of federal S&E support are defined as follows:
- Research and experimental development (R&D) includes all direct, indirect, incidental, or related costs resulting from or necessary to perform R&D by private individuals and organizations under grant, contract, or cooperative agreement.
- R&D plant includes all projects whose principal purpose is to provide support for construction, acquisition, renovation, modification, repair, or rental of facilities, land, works, or fixed equipment for use in scientific or engineering R&D.
- Facilities and equipment for S&E instruction includes all programs whose principal purpose is to provide support for construction, acquisition, renovation, modification, repair, or rental of facilities, land, works, or equipment for use in instruction in S&E.
- S&E fellowships, traineeships, and training grants (FTTGs) includes all fellowship, traineeship, and training grant programs that are directed primarily toward the development and maintenance of the scientific workforce.
- General support for S&E includes funds used for scientific projects and support for activities within a specified discipline; explicit purpose is not specified.
- Other S&E activities includes all academic S&E obligations that cannot be assigned elsewhere and activities in support of technical conferences, teacher institutes, and programs aimed at increasing precollege and undergraduate students’ scientific knowledge.
The Federal Science and Engineering Support module within the Survey of Federal Funds for R&D is a census of federal agencies that fund R&D and S&E support. As such, there is no sampling error; however, survey data are still subject to some degree of unmeasured nonsampling error that may include errors in classification or measurement of certain aspects of an agency’s S&E support. For additional information, see the “Survey Quality Measures” within the Technical Notes of the survey. The full set of data tables on the FY 2024 Survey of Federal Science and Engineering Support to Universities, Colleges, and Nonprofit Institutions are available at https://ncses.nsf.gov/surveys/federal-support-survey/2024. Data for the survey are also available in NCSES’s interactive data tool. For more information, please contact NCSES.
NCSES has reviewed this product for unauthorized disclosure of confidential information and approved its release (NCSES-DRN26-017).
Notes
1 Obligations represent the amount for orders placed, contracts awarded, services received, and similar transactions during a given period, regardless of when the funds were appropriated or when future payment of money is required.
2 Gross domestic product implicit price deflators were used to convert current dollars to constant 2017 dollars. Data on federal fiscal year historical figures, 1951–2024, can be found in: Office of Management and Budget (OMB). 2024. Budget of the U.S. Government, Fiscal Year 2025. Historical Tables. Table 10.1. Gross Domestic Product and Deflators Used in the Historical Tables: 1940–2029. Available at https://www.govinfo.gov/app/details/BUDGET-2025-TAB/BUDGET-2025-TAB-11-1/context. Current dollar obligations for R&D are from the National Center for Science and Engineering Statistics, Survey of Federal Funds for Research and Development.
3 Effective with the FY 2021 survey cycle, the Survey of Federal Science and Engineering Support to Universities, Colleges, and Nonprofit Institutions has been collected as a module within the Survey of Federal Funds for R&D.
4 All other agencies includes the Agency for International Development, Appalachian Regional Commission, Consumer Product Safety Commission, Department of Commerce, Department of Education, Department of Homeland Security, Department of the Interior, Department of Justice, Department of Labor, Department of Transportation, Department of the Treasury, Environmental Protection Agency, General Services Administration, Nuclear Regulatory Commission, the Office of Economic Opportunity, and Social Security Administration.
5 Details available in the full set of data tables: table 2.
6 Details available in the full set of data tables: table 17.
7 For data on specific University Affiliated Research Centers, see the FYs 2024–25 Survey of Federal Funds for Research and Development’s full set of data tables: tables 44–46.
8 Details available in the full set of data tables: table 17.
9 Details available in the full set of data tables: table 34.
10 Survey Technical Notes are available at https://ncses.nsf.gov/surveys/federal-support-survey/2024#technical-notes.
Suggested Citation
National Center for Science and Engineering Statistics (NCSES). 2026. In FY 2024, Federal Science and Engineering Support for Higher Education Declined 4.3% from FY 2023; Federal Obligations to Nonprofits Totaled $11 Billion. NSF 26-319. Alexandria, VA: U.S. National Science Foundation. Available at https://ncses.nsf.gov/pubs/nsf26319.
Contact Us
National Center for Science and Engineering Statistics
Directorate for Social, Behavioral and Economic Sciences
U.S. National Science Foundation
Tel: (703) 292-8780
FIRS: (800) 877-8339
TDD: (800) 281-8749
E-mail: ncsesweb@nsf.gov