An official website of the United States government


R&D Spending at Federally Funded R&D Centers Holds Steady in FY 2025
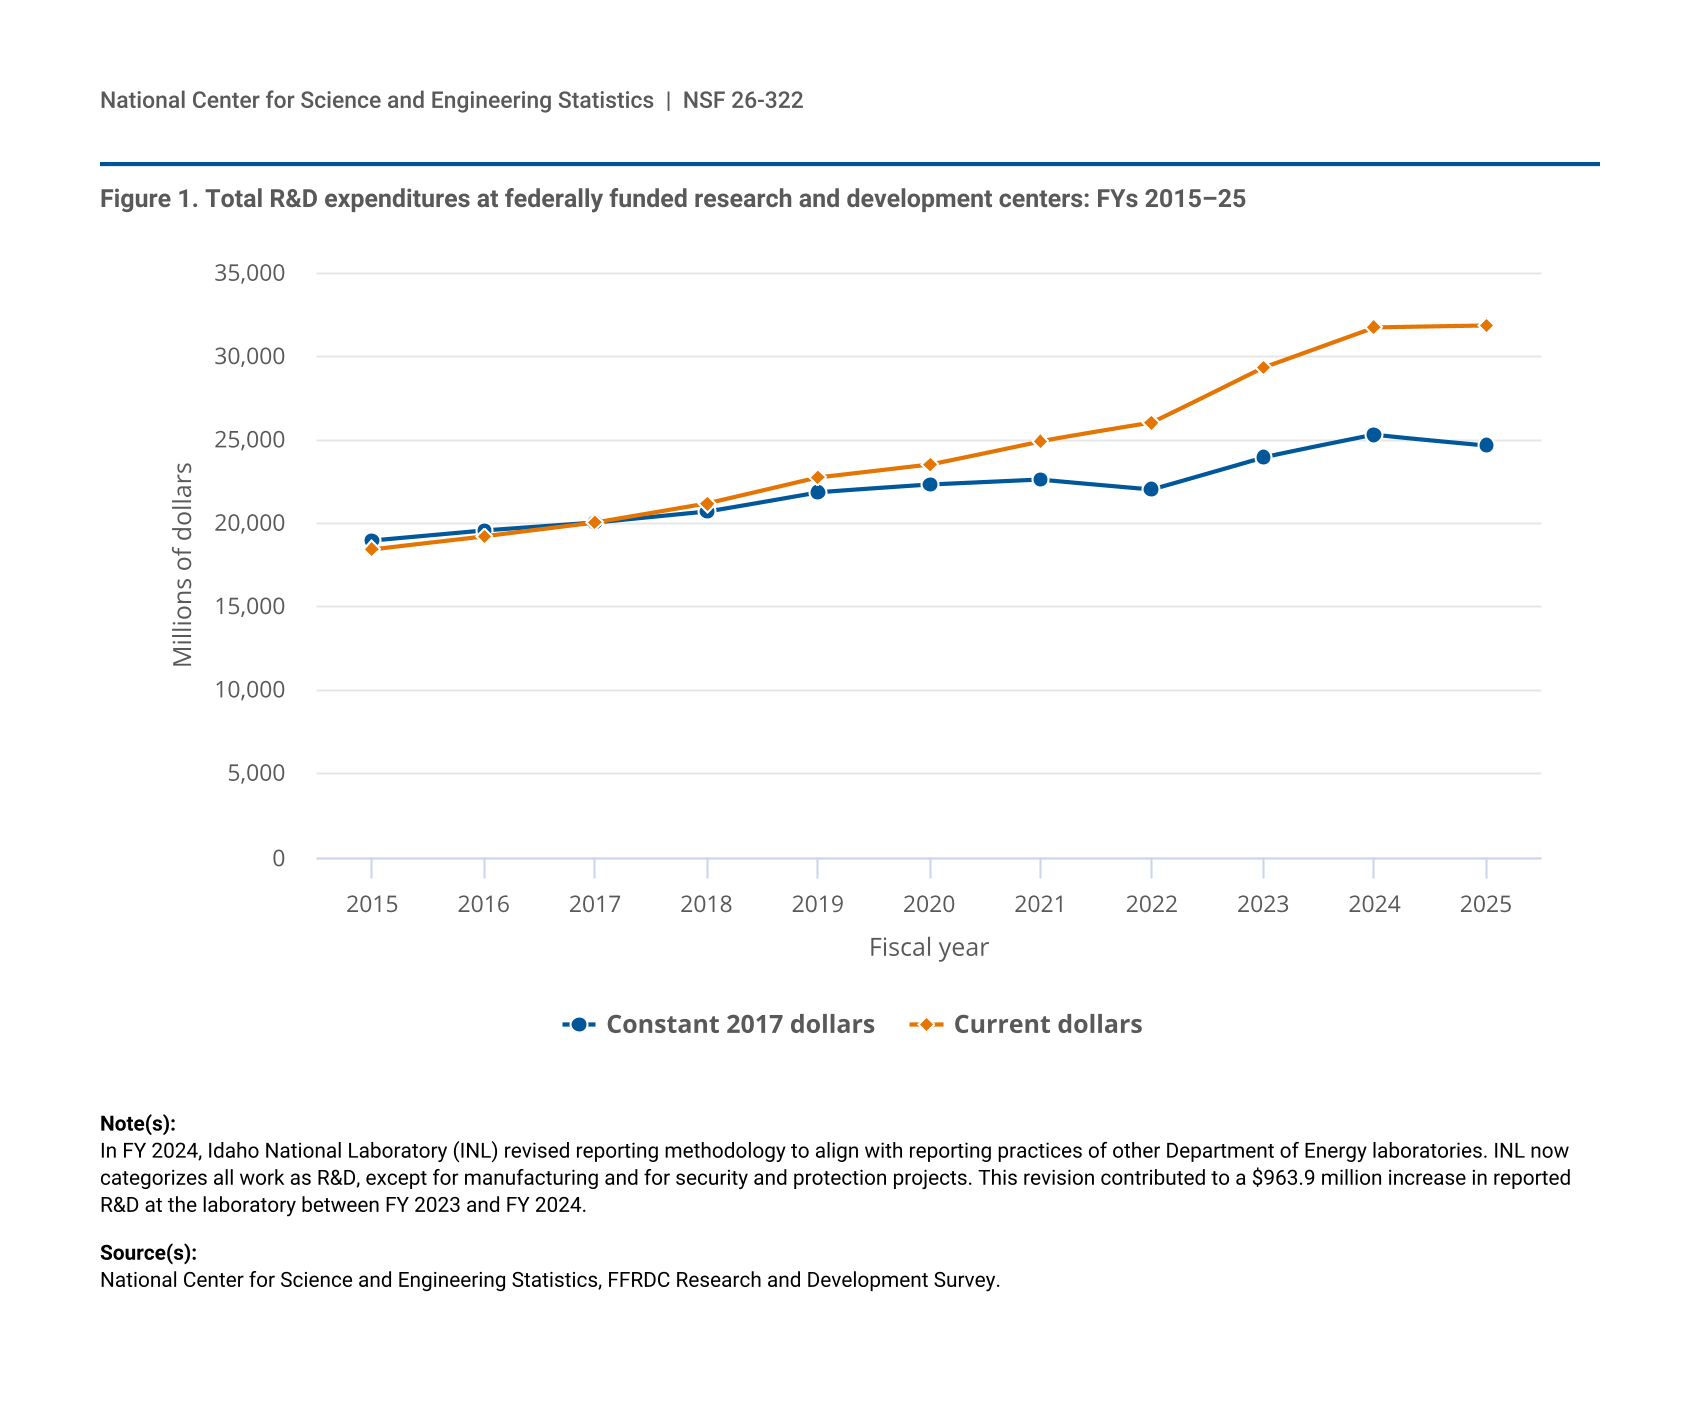
Federally funded research and development centers (FFRDCs) in the United States enable federal agencies to meet their research and development (R&D) needs through government-owned, contractor-operated research centers. These centers provide capabilities that cannot be met as effectively through other resources. The nation’s 41 FFRDCs spent $31.8 billion on R&D in FY 2025, an increase of 0.34% over FY 2024 in current dollars (table 1). (All amounts and calculations are reported in current dollars unless otherwise noted. All growth rates are compound annual growth rates.) The federal government funded $31.3 billion of the R&D total, an increase of 0.27% over FY 2024. This is the smallest nominal growth in FFRDC R&D expenditures since 2014. In constant dollars, total FFRDC R&D expenditures rose an average of 2.7% annually from FY 2015 to FY 2025, although the annual rate of increase measured just 1.5% from FY 2023 to FY 2025 (figure 1). These and the other statistics in this report come from the FY 2025 FFRDC Research and Development Survey, conducted by the National Center for Science and Engineering Statistics within the U.S. National Science Foundation.
National Center for Science and Engineering Statistics, FFRDC Research and Development Survey.
| Fiscal year | Constant 2017 dollars | Current dollars |
|---|---|---|
| 2015 | 18,966 | 18,458 |
| 2016 | 19,564 | 19,220 |
| 2017 | 20,038 | 20,038 |
| 2018 | 20,698 | 21,172 |
| 2019 | 21,868 | 22,738 |
| 2020 | 22,314 | 23,514 |
| 2021 | 22,616 | 24,921 |
| 2022 | 22,036 | 26,007 |
| 2023 | 23,954 | 29,317 |
| 2024 | 25,293 | 31,725 |
| 2025 | 24,681 | 31,833 |
In FY 2024, Idaho National Laboratory (INL) revised reporting methodology to align with reporting practices of other Department of Energy laboratories. INL now categorizes all work as R&D, except for manufacturing and for security and protection projects. This revision contributed to a $963.9 million increase in reported R&D at the laboratory between FY 2023 and FY 2024.
National Center for Science and Engineering Statistics, FFRDC Research and Development Survey.
R&D by Funding Source
Federal funding sources accounted for 98.4% ($31.3 billion) of FFRDC R&D expenditures in FY 2025 (table 1). This level of support is typical for FFRDCs, which are privately operated R&D organizations that are exclusively or substantially financed by the federal government. Nonfederal sources funded the remaining R&D, which totaled $501.0 million: businesses ($256.7 million), nonprofit organizations ($44.0 million), state and local governments ($41.8 million), and all other sources ($158.5 million), such as funds from foreign governments and foreign or U.S. universities.
Federal Agency Sources of R&D Funding
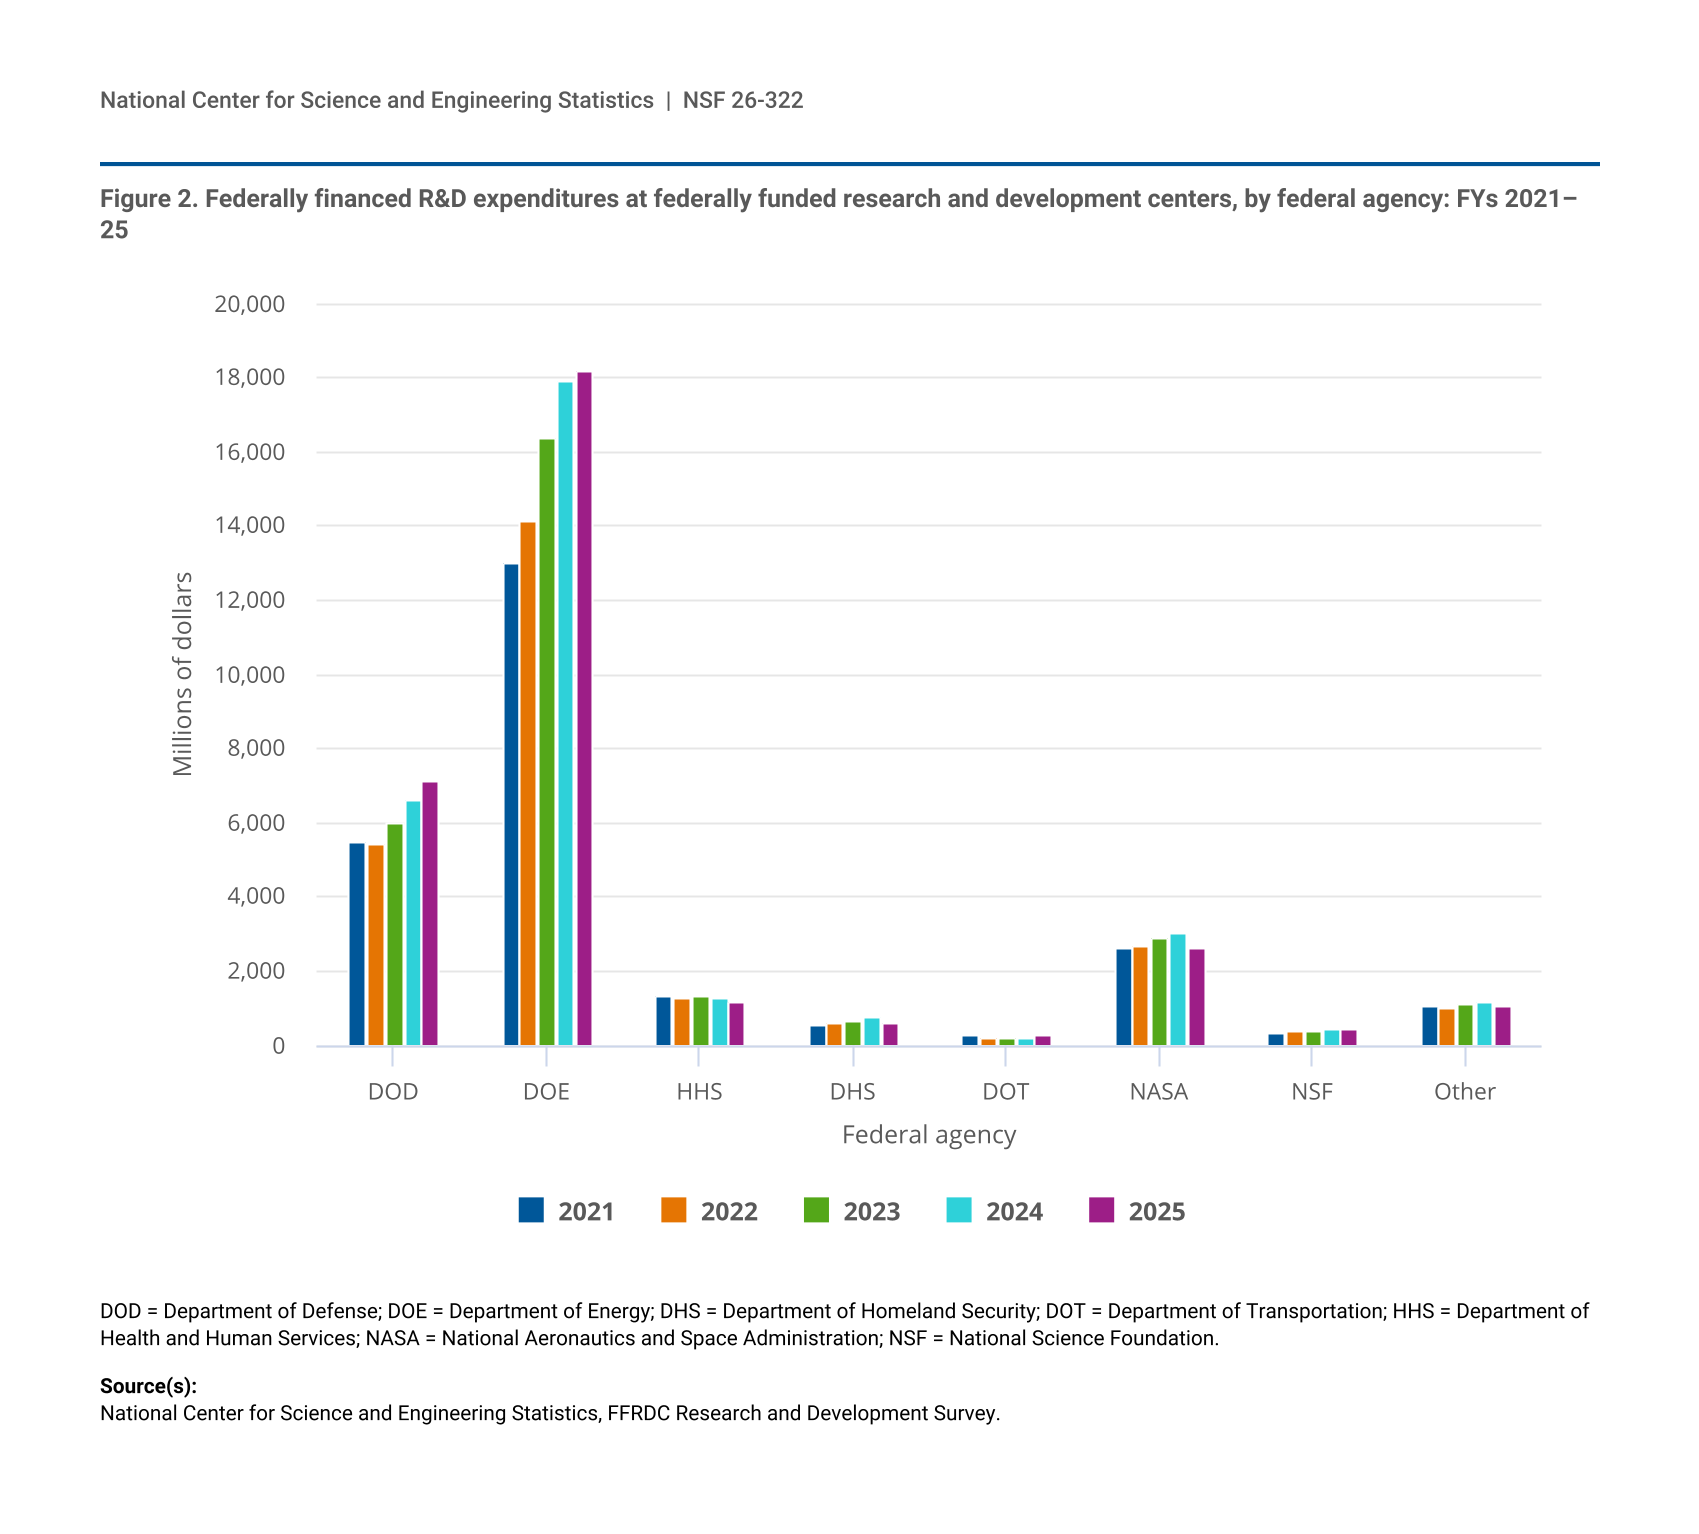
Four agencies accounted for 92.8% of federally funded R&D expenditures at FFRDCs, which is typical: the Department of Energy (DOE), Department of Defense (DOD), National Aeronautics and Space Administration (NASA), and Department of Health and Human Services (HHS) (figure 2). DOE accounted for $18.2 billion of federally funded R&D spending (58.0%); DOD, $7.1 billion (22.6%); NASA, $2.6 billion (8.4%); and HHS, which includes the National Institutes of Health, $1.2 billion (3.7%). These four agencies were the only agencies with funding expenditures greater than $1 billion in FY 2025. FFRDCs identified 22 other agencies as sources of federal funding in FY 2025 (table 2).
| Federal agency | 2021 | 2022 | 2023 | 2024 | 2025 |
|---|---|---|---|---|---|
| DOD | 5,460 | 5,408 | 5,976 | 6,608 | 7,096 |
| DOE | 12,984 | 14,123 | 16,380 | 17,894 | 18,172 |
| HHS | 1,301 | 1,285 | 1,318 | 1,247 | 1,172 |
| DHS | 539 | 612 | 619 | 732 | 569 |
| DOT | 250 | 210 | 214 | 214 | 227 |
| NASA | 2,630 | 2,649 | 2,921 | 3,003 | 2,632 |
| NSF | 316 | 345 | 382 | 407 | 446 |
| Other | 1,030 | 973 | 1,068 | 1,140 | 1,018 |
DOD = Department of Defense; DOE = Department of Energy; DHS = Department of Homeland Security; DOT = Department of Transportation; HHS = Department of Health and Human Services; NASA = National Aeronautics and Space Administration; NSF = National Science Foundation.
National Center for Science and Engineering Statistics, FFRDC Research and Development Survey.
a Some funding sources were not identified for security reasons or because the original source was not known.
National Center for Science and Engineering Statistics, FFRDC Research and Development Survey, FY 2025.
R&D expenditures from the two largest funding agencies nominally grew from FY 2024 to FY 2025—DOE increased by $278 million (1.6%) and DOD increased by $488 million (7.4%). The increase in DOE-funded expenditures during this period was significantly below the annual growth rate of 11.3% for DOE from FY 2021 to FY 2024. R&D expenditures funded by HHS, DHS, and NASA all declined in FY 2025. HHS-funded expenditures decreased by $75 million (6.0%), DHS funded expenditures decreased by $163 million (22.3%), and NASA funded expenditures decreased by $371 million (12.4%). Although DOD and DOE funded more than $1 billion in expenditures at several FFRDCs, the majority of HHS- or NASA-funded expenditures were at two FFRDCs (table 3):
- Jet Propulsion Laboratory accounted for 86.7% ($2.3 billion) of NASA-funded expenditures at FFRDCs ($2.6 billion).
- Frederick National Laboratory for Cancer Research accounted for 73.8% ($865.1 million) of HHS-funded FFRDC expenditures ($1.2 billion).
NA = not available; imputed data not reported at this level.
DOD = Department of Defense; DOE = Department of Energy; DHS = Department of Homeland Security; DOT = Department of Transportation; FFRDC = federally funded research and development center; HHS = Department of Health and Human Services; NASA = National Aeronautics and Space Administration; NSF = National Science Foundation.
National Center for Science and Engineering Statistics, FFRDC Research and Development Survey, FY 2025.
Expenditure Trends at Specific FFRDCs
The majority of FFRDCs (27 centers) increased R&D spending in FY 2025 compared with FY 2024; 14 FFRDCs reported lower R&D totals in FY 2025 (table 4). Twelve FFRDCs had expenditures of more than $1 billion each (a combined $25.5 billion) in R&D expenditures for FY 2025: the NASA-sponsored Jet Propulsion Laboratory; eight DOE-sponsored national laboratories specializing in energy and the environment, national security, and nuclear science (Argonne, Idaho, Lawrence Berkeley, Lawrence Livermore, Los Alamos, Oak Ridge, Pacific Northwest, and Sandia National Laboratories); and three FFRDCs sponsored by DOD (National Security Engineering Center, Lincoln Laboratory, and Aerospace FFRDC). Sandia National Laboratories and Los Alamos National Laboratory were the two largest performers with $4.7 billion and $4.1 billion in total R&D, respectively. Between FY 2024 and FY 2025, four FFRDCs increased their R&D expenditures by more than $100 million: Oak Ridge National Laboratory ($173.4 million), Argonne National Laboratory ($142.3 million), Lincoln Laboratory ($127.1 million), and Los Alamos National Laboratory ($118.7 million). Jet Propulsion Laboratory reported a significant decrease in FY 2025 R&D expenditures ($366.3 million).
na = not applicable. NA = not available; imputed data not reported at this level.
FFRDC = federally funded research and development center.
a Green Bank Observatory split from the National Radio Astronomy Observatory into separate FFRDCs on 1 October 2016; however, its expenditures continued to be reported under the National Radio Astronomy Observatory for FYs 2017–20. On 1 October 2024, Green Bank Observatory was reincorporated into the National Radio Astronomy Observatory and is no longer a separate FFRDC.
b In FY 2024, Idaho National Laboratory (INL) revised reporting methodology to align with reporting practices of other Department of Energy laboratories. INL now categorizes all work as R&D, except for manufacturing and security or protection projects.
c The Judiciary Modernization Engineering Center was decertified as an FFRDC on 31 January 2021.
National Center for Science and Engineering Statistics, FFRDC Research and Development Survey.
Data Sources, Limitations, and Availability
The statistics on FFRDC R&D expenditures presented in this report come from the FY 2025 FFRDC Research and Development Survey. This annual survey is completed by FFRDC administrators and collects data from FFRDCs on R&D expenditures by source of funds (federal government, state and local governments, businesses, nonprofit organizations, or other); federal agency source; type of R&D (basic research, applied research, or experimental development); type of cost (salaries, software, equipment, subcontracts, other direct costs, and indirect costs); R&D personnel headcounts and full-time equivalents; and total operating budget. This survey has been a census of the full population of FFRDCs since FY 2001. For a list of criteria used to define the set of FFRDCs, see the general guidelines of the Master Government List of FFRDCs at https://ncses.nsf.gov/resource/master-gov-lists-ffrdc/general-notes.
The full set of data tables from this survey and more information on the survey methodology are available at https://ncses.nsf.gov/surveys/ffrdc-research-development/2025.
NCSES has reviewed this product for unauthorized disclosure of confidential information and approved its release (NCSES-DRN26-024).
Notes
1 The Master Government List of FFRDCs provides details on sponsoring agencies, administrator types, and locations and contains general and historical notes. See also Congressional Research Service. 2021. Federally Funded Research and Development Centers (FFRDCs): Background and Issues for Congress. Available at https://www.congress.gov/crs-product/R44629. Accessed 27 June 2025. And see Cunningham JA and Link AN. 2022. The Returns to Publicly Funded R&D: A Study of U.S. Federally Funded Research and Development Centers. Annals of Science and Technology Policy: 6(3):228–314. Available at http://dx.doi.org/10.1561/110.00000023.
2 For annual R&D expenditures by source of funds, FY 2001–25, see the full set of data tables: table 1.
3 For FFRDC sponsoring agencies and locations, see the full set of data tables: table 6.
Suggested Citation
National Center for Science and Engineering Statistics (NCSES). 2026. R&D Spending at Federally Funded R&D Centers Holds Steady in FY 2025. NSF 26-322. Alexandria, VA: U.S. National Science Foundation. Available at https://ncses.nsf.gov/pubs/nsf26322.
Contact Us
National Center for Science and Engineering Statistics
Directorate for Social, Behavioral and Economic Sciences
U.S. National Science Foundation
Tel: (703) 292-8780
FIRS: (800) 877-8339
TDD: (800) 281-8749
E-mail: ncsesweb@nsf.gov