 An official website of the United States government


Forthcoming
The Doctorate Recipients from U.S. Universities: 2025 featured report is forthcoming.
An official website of the United States government
Official websites use .gov
A .gov website belongs to an official government organization in the United States.
Secure .gov websites use HTTPS
A lock ( ) or https:// means you’ve safely connected to the .gov website. Share sensitive information only on official, secure websites.


The SED is an annual census of research doctorate recipients from U.S. academic institutions that collects information on educational history, demographic characteristics, graduate funding sources and educational debts, and postgraduation plans.
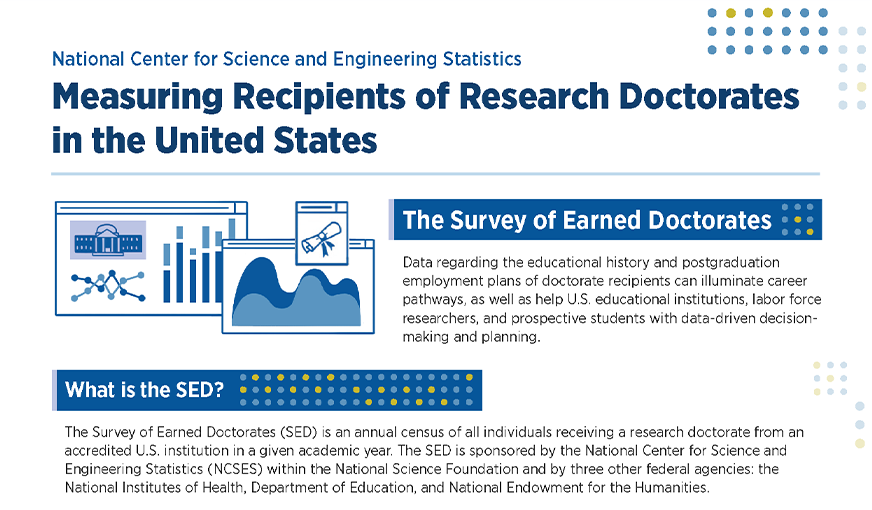
The Survey of Earned Doctorates is an annual census conducted since academic year 1958 of all individuals receiving a research doctorate from an accredited U.S. institution in a given academic year. The SED is sponsored by the National Center for Science and Engineering Statistics (NCSES) within the U.S. National Science Foundation and by three other federal agencies: the National Institutes of Health, Department of Education, and National Endowment for the Humanities. The SED collects information on the doctoral recipient’s educational history, demographic characteristics, and postgraduation plans. Results are used to assess characteristics of the doctoral population and trends in doctoral education and degrees.
The 2025 survey was conducted by RTI International under contract to NCSES.
| Status | Active |
|---|---|
| Frequency | Annual |
| Reference Period | Academic year 2025 |
|---|---|
| Released | 25 September 2026 |
The Survey of Earned Doctorates (SED) collects data on the number and characteristics of individuals receiving research doctoral degrees from U.S. academic institutions.
RTI International.
None.
Annual.
Academic year 1958.
Academic year 2025 (1 July 2024 to 30 June 2025).
Individuals.
Census.
59,015.
Not applicable.
Key variables of interest are listed below.
The population for the 2025 SED consists of all individuals receiving a research doctorate from a U.S. academic institution in the 12-month period beginning 1 July 2024 and ending 30 June 2025. A research doctorate is a doctoral degree that (1) requires completion of an original intellectual contribution in the form of a dissertation or an equivalent culminating project (e.g., musical composition) and (2) is not primarily intended as a degree for the practice of a profession. The most common research doctoral degree is the doctor of philosophy (PhD). Recipients of professional doctoral degrees, such as MD, DDS, DVM, JD, DPharm, DMin, and PsyD, are not included in the SED.
The total universe of doctorate recipients is created by first identifying all institutions that confer research doctorates and then identifying all individuals receiving a research doctorate from those institutions in the 12-month period ending 30 June 2025. The list of institutions is based principally on the institutions in the prior survey cycle augmented by any new institutions on the Integrated Postsecondary Education Data System (IPEDS) and other higher education resource databases. The list of doctorate recipients is created from administrative sources such as commencement lists from the institutions and commercial databases of doctorate dissertations. The frame of the 2025 SED included 59,015 persons from 460 institutions that conferred research doctorates.
The SED is a census.
Two modes of data collection are used in the SED: self-administered Web survey and computer-assisted telephone interview (CATI). The self-administered Web survey is the primary mode of SED completion. The proportion of SED completions using the Web has increased steadily since it was introduced in 2001 and was 99.2% in 2025.
Nonrespondents are contacted by email, mail, and text messages to complete the Web survey. If the series of follow-up emails, mailings, and text messages is unsuccessful, the survey contractor attempts to reach nonrespondents to complete an abbreviated survey by CATI. Approximately 0.8% of SED completions were from CATI in 2025. At the end of the data collection phase, institutional coordinators were contacted to obtain information on a small number of critical SED data items for nonrespondents from their institution.
The data collected in the SED are subject to editing and coding procedures. Imputation is not performed for missing survey data items except for the month value used in the calculation of the age at doctorate and time to degree variables.
The survey is a census of all recipients of U.S. research doctoral degrees with no sampling variability.
Not applicable because the SED is a census.
Due to the availability of comprehensive lists of doctorate-granting institutions, coverage error of institutions is minimal. Because the graduate schools identify degree recipients at the time of doctorate completion, coverage error for individual doctorate recipients is also minimal. In 2025, 17 doctorate-granting institutions declined to fully enumerate their doctorate recipients for academic year 2025. Information on the graduates for all of these institutions was found from other sources, such as ProQuest or published information. Comparisons of the institutions with research doctorate recipients covered by the SED that also report to the IPEDS Completions Survey confirm that there is minimal coverage error.
Measurement error in the SED is attributable to several sources, including errors in respondent reporting and errors that occur during data collection or processing.
Data on doctorate recipients for previous years are updated with data received from institutions and respondents after the close of data collection for a given year. Updates and corrections to graduation dates can also change the overall counts for prior years. The published tables reflect these changes and thus may not match previously published data.
Each year’s survey data are added to the Doctorate Records File (DRF), which includes cumulative SED data dating back to 1958; more limited information (sex, institution, field, and year of doctorate) is contained on the DRF for PhDs who graduated in 1920–56.
Because of procedural changes implemented during the 1990 survey cycle to improve the completeness of race, ethnicity, and citizenship data, the data from 1990 and later years are not directly comparable to data before 1990.
In 2021, the education history section was changed to a table format in which respondents can select all the postsecondary degrees received, up to nine degrees. Based on the degrees reported, follow-up questions asked about each type of degree, including any professional doctorate being earned.
Beginning in 2021, field of study and doctorate dissertation field data have been collected using a modified version of the 2020 Classification of Instructional Programs (CIP) codes. Therefore, the field of study data prior to the 2021 survey cycle may not be comparable to the data in subsequent years; see the working paper Survey of Earned Doctorates Field of Study Taxonomy Changes in 2021 and Impact on Trend Data for more information.
The data from this survey are published annually in detailed tables and the report series Doctorate Recipients from U.S. Universities. Other products are also available at the SED home page. Information from the survey is also included in congressionally mandated reports, such as Science and Engineering Indicators.
Access to tabular data on selected variables from 1958 onward is available in an NCSES interactive data tool. Users can create custom tables of the number of doctorate recipients by academic discipline and institutional characteristics of either the doctorate-granting institution or the baccalaureate-granting institution of doctorate recipients. A limited set of demographic characteristics is available to create custom tables by academic discipline.
A more comprehensive set of analysis variables is available in the SED Restricted Data Analysis System (RDAS) for the data user to generate custom data tables in a secured platform.
Researchers interested in analyzing restricted microdata can apply for a restricted-use license by submitting a proposal through the Standard Application Process (SAP). The proposal will be evaluated based on the benefit to the sponsoring agencies, scientific merit, feasibility, and risk of disclosure. To learn more and apply for access, visit the Standard Application Process.
Purpose. The Survey of Earned Doctorates (SED) collects data on the number and characteristics of individuals receiving research doctoral degrees from U.S. academic institutions.
Data collection authority. The information collected by the SED is solicited under the authority of the National Science Foundation Act of 1950, as amended, and the America COMPETES Reauthorization Act of 2010. The Office of Management and Budget control number for the 2025 survey cycle is 3145-0019, expiration date 31 May 2026. The National Center for Science and Engineering Statistics (NCSES) has reviewed this product for unauthorized disclosure of confidential information and approved its release (NCSES-DRN26-034).
Survey contractor. RTI International.
Survey sponsors. The SED is sponsored by NCSES within the U.S. National Science Foundation (NSF) and by three other federal agencies: the National Institutes of Health, Department of Education, and National Endowment for the Humanities.
Frequency. Annual.
Initial survey year. Academic year 1958.
Reference period. Academic year 2025 (1 July 2024 to 30 June 2025).
Response unit. Individuals.
Sample or census. Census.
Population size. 59,015.
Sample size. Not applicable.
Target population. The population for the 2025 SED consists of all individuals receiving a research doctorate from a U.S. academic institution in the 12-month period beginning 1 July 2024 and ending 30 June 2025. A research doctorate is a doctoral degree that (1) requires completion of an original intellectual contribution in the form of a dissertation or an equivalent culminating project (e.g., musical composition) and (2) is not primarily intended as a degree for the practice of a profession.
The SED recognized 18 distinct types of research doctorates in 2025 (table A-1). Recipients of professional doctoral degrees, such as MD, DDS, DVM, JD, DPharm, DMin, and PsyD, are not included in the SED.
The doctor of philosophy (PhD) constitutes the vast majority of research doctoral degrees. Of the 59,015 new research doctorates granted in 2025, 98.6% were PhDs. The next most frequently occurring type of research doctorate was the doctor of education (EdD), which accounted for 0.9% of the total in 2025. No other type of doctoral degree accounted for more than 0.3% of the new research doctorates in 2025.
Sampling frame. The SED is a census of all recipients of U.S. research doctoral degrees. The frame of doctorate recipients is created by first identifying all institutions that confer research doctorates and then identifying all individuals receiving a research doctorate from those institutions in the 12-month period ending 30 June 2025. The list of institutions is based principally on the institutions in the prior survey cycle augmented by any new institutions in the Integrated Postsecondary Education Data System (IPEDS) and other higher education resource databases. The list of doctorate recipients is created from administrative sources, such as commencement lists provided by institutions, institution websites, and commercial databases of doctorate dissertations. For 2025, 470 research doctorate-granting institutions were identified; however, 10 of these institutions reported 0 graduates, thus there were 460 institutions in the SED universe that conferred research doctorates. Of the institutions that conferred research doctorates, 17 institutions refused to provide lists of graduates. For all of the 17 refusing institutions, the survey contractor was able to construct graduate lists using secondary data sources. Thus, the SED frame consisted of 59,015 persons in the 460 institutions that conferred research doctorates in 2025.
Sample design. The SED is a census.
Data collection. SED collects data using two modes: self-administered Web survey and computer-assisted telephone interview (CATI).
The self-administered Web survey is the primary mode of SED completion. When students apply for graduation, institutional coordinators at the universities give students the link to the survey registration website. Students who sign up at the survey registration website receive PIN and password information via email, as well as the URL of the SED Web survey. The proportion of SED completions using the Web has increased steadily since it was introduced in 2001, and it was 99.2% in 2025.
Nonrespondents are contacted by email, mail, and text message to complete the Web survey. If the series of follow-up emails, mailings, and text messages is unsuccessful, the survey contractor attempts to reach nonrespondents to complete an abbreviated survey by CATI. Approximately 0.8% of SED completions were from CATI in 2025. At the end of the data collection phase, institutional coordinators were contacted to obtain information on a small number of critical SED data items for nonrespondents from their institution.
A small but growing number of research doctoral degrees awarded were part of joint doctoral programs (i.e., a research doctorate recipient studied at more than one institution in pursuit of the doctoral degree). In these instances, the survey contractor relies on information provided by the institutions to appropriately attribute the doctorate to one of the doctorate-granting institutions.
The survey collects complete college education history data. For degrees earned from most U.S. postsecondary degree-granting institutions, the institutions are coded to their unique identification number (UnitID) from IPEDS; non-IPEDS institutions are maintained in a supplementary database. To code the degree-granting institutions for postsecondary degrees earned from foreign countries, survey staff maintain a database of foreign institutions, updating it annually to include new entries for foreign institutions reported by SED respondents. About one-third of 2025 U.S. research doctorate recipients received an undergraduate degree from foreign institutions.
Mode. In 2025, 99.2% of survey responses were obtained via the Web survey and 0.8% via CATI.
Response rate. Of the 59,015 individuals who received a research doctorate in 2025, 91.0% completed the survey (table A-2). Additional information on response rate is below, under “Nonresponse error.”
Data editing. Approved automated edits are applied to the SED, a number of which pertain to the education history section.
Imputation. In producing the 2025 SED Doctorate Records File, limited imputation was performed to support derivation of age and time to degree. Imputation was applied when month data for calculating measures involving age and time was not reported. The missing month values described below were either randomly or logically imputed.
In certain cases, community college attendance was statistically imputed. See “Survey Quality Measures” for additional information.
Weighting. Survey data were not weighted.
Variance estimation. The SED is a census of all recipients of U.S. research doctoral degrees with no sampling variability.
Disclosure protection. To protect against the disclosure of confidential information provided by SED respondents, data values based on counts of respondents that fall below a predetermined threshold are suppressed in the data tables. Secondary or complementary suppressions are applied as needed to prevent reconstruction of the data values from primary suppressions. Beginning in 2021, the detailed fields in the data tables are based on the aggregation of SED Classified Instructional Program (CIP) fields. All suppressed values in the data tables are replaced with “D.”
Sampling error. Not applicable because the SED is a census.
Coverage error. Due to the availability of comprehensive lists of doctorate-granting institutions, coverage error of institutions is minimal. Because the graduate schools identify degree recipients at the time of doctorate completion, coverage error for individual doctorate recipients is also minimal. Comparisons of the institutions with research doctorate recipients covered by the SED that also report to the IPEDS Completions Survey, collected by the National Center for Education Statistics, confirm that there is minimal coverage error.
Institutions that begin to confer research doctorates are invited to join the SED. If a university that confers research doctorates does not wish to participate in the SED, slight undercounts may result. Graduation lists provided by institutions serve as the primary frame to determine eligible doctorate recipients. In 2025, 17 doctorate-granting universities declined to fully enumerate their doctorate recipients for academic year 2025. Information on the graduates for all but one of these institutions was found from other sources, such as ProQuest. Differences in counts of research doctorate recipients between SED and IPEDS are due to definitional differences.
Nonresponse error.
Unit nonresponse was concentrated in a small number of institutions: 12 of the 460 doctorate-granting institutions accounted for about 40% of the total nonrespondents, with an additional 7 institutions accounting for another 10% of the total nonrespondents. Thus, about half of survey nonrespondents were from 19 institutions.
Measurement error. The primary source of measurement error in the SED is attributable to incomplete or updated information provided by respondents or degree-granting institutions and to educational history provided by respondents.
Data on doctorate recipients for previous years are updated with data received from institutions and respondents after the close of data collection for a given year. Updates and corrections to graduation dates can also change the overall counts for prior years. The published tables reflect these changes and thus may not match previously published data.
An instrument change made to reduce respondent burden resulted in substantial increase in nonresponse for the community college credit question. Response to a pop-up asking whether or not an associate’s degree was earned was made optional in 2025; however, 10,322 respondents declined to confirm they had not received an associate’s degree and therefore were not shown the community college question. To maintain data comparability, the 10,322 respondents were assumed to have no associate’s degree and their community college credit response was statistically imputed.
Changes in survey coverage and population. For the 2025 cycle, two institutions were added and two institutions were removed from the SED universe.
Changes in questionnaire. The following changes were made to the questionnaire in 2025:
New questions.
None.
Revisions to existing questions.
Sex. During the 2025 data collection, a nonsubstantive change was made to the wording of the sex question in alignment with Executive Order 14168. The question was updated to read “What is your sex?” and the response options remained the same: “Male” and “Female.”
Of the 59,015 doctorate recipients in 2025, 32,216 responded to the survey with the original question wording in the 11 months of data collection before the change. The remaining respondents received the revised question. The 2025 SED data files and products derive sex data using the responses to both the original question wording and the revised wording. The resulting distribution of respondents on the sex item was similar to prior years.
Earned credits from a community college. In an effort to reduce respondent burden, answering whether an associate’s degree was earned became optional, reducing the number of responses. But as a result, the follow-up question about earning any credit at a community college was not asked for those who skipped confirming that they did not earn an associate’s degree, reducing response on this item as well. To keep these items comparable with prior years, those who did not answer the associate’s degree item were assumed to have no associate’s degree and their community college credit response was statistically imputed.
Changes in reporting procedures or classification.
As of 2021, SED collects field of study and doctorate dissertation field data using a modified version of the 2020 Classification of Instructional Programs (CIP) codes maintained by the National Center for Education Statistics. The SED-CIP modifications are as follows:
The SED-CIP code list includes over 1,650 fields for reporting, compared to 334 field codes collected prior to 2021. The SED-CIP codes are aggregated into 315 detailed fields, 68 major fields, and 16 broad fields (table A-4). In 2025, minor revisions were made to the detailed field taxonomy to improve data utility. Specifically, seven detailed fields were added, one was removed due to low counts, and one was renamed (table A-4 and table A-5). This SED-CIP taxonomy includes multidisciplinary/interdisciplinary sciences and multidisciplinary /interdisciplinary studies to capture and track emerging fields aligned to the NCSES Taxonomy of Disciplines for comparison with other NCSES surveys. The complete SED-CIP list with corresponding detailed, major, and broad fields is in table A-5. All single-year and 2021–present data tables (table 3-1 through table 9-18) use the new SED-CIP taxonomy.
To facilitate the trend data comparison with prior years, the trend field taxonomy presents modified aggregation for multiyear data tables with data earlier than 2021 (table 1-1 through table 2-8). The trend broad and major fields are available from 1958 to the present. The trend field taxonomy was designed to align the historical field of study codes used to collect data in 2020 and earlier and the new broad and major fields in the SED-CIP taxonomy to the extent possible (table A-7). The trend field taxonomy aggregates historical field of study and SED-CIP data into 14 trend broad fields and 62 trend major fields as compared with 8 broad fields and 35 major fields in the historical field taxonomy. Table A-6 provides the alignment of the historical fine field codes to the new trend broad and major fields. The trend field taxonomy replaced the historical field taxonomy used in SED tables in 2020 and earlier, as well as trend tables prior to 2023. Table A-7 provides a comparison of the historical, trend, and current field taxonomies.
This results in generally comparable trend broad and major fields with some limitations. For example, it is not known how respondents who reported the SED-CIP field of “electrical engineering and computer science” in the current survey would have chosen their field under the historical SED-FOS list that included two separate fields “electrical engineering” and “computer science” only. For more information, see the working paper Survey of Earned Doctorates Field of Study Taxonomy Changes in 2021 and Impact on Trend Data.
|
Code |
Citizenship category |
|
0 |
U.S. native born |
|
1 |
U.S. naturalized citizen |
|
2 |
Non-U.S. immigrant (permanent resident) |
|
3 |
Non-U.S. non-immigrant (temporary U.S. visa) |
|
4 |
Non-U.S., visa status unknown |
|
U |
U.S. citizen, unspecified |
|
Blank |
Missing or citizenship unknown |
Respondents who indicated a U.S. birthplace, regardless of what they reported for citizenship status, were assigned code 0.
In 1999, code 4 (non-U.S., visa status unknown) was introduced, and data were back-coded through 1997. Respondents who designated a non-U.S. country for the country of citizenship item but did not respond to the citizenship status item were assigned code 4 for citizenship status. From 1997 to 2003, foreign-born respondents who did not indicate their country of citizenship or citizenship status were assigned to code 4 if three out of four geographic variables—place of birth, place of high school, place of college entry, and postgraduation location—were non-U.S. locations. Beginning with the 2004 SED, the variable “place of baccalaureate institution” replaced “place of college entry” in the assignment of a citizenship code for respondents who did not indicate citizenship status.
For tabulations in this report, code 4 was combined with code 3—that is, counts of doctorate recipients in the temporary visa holder category include non-U.S. citizens with unknown visa status. This is consistent with coding procedures in previous data collections. However, the existence of code 4 allows the microdata user to exclude cases for which visa status is unknown. Prospective data users should note, however, that the number of cases in the code 4 group is not sufficient to warrant analysis as a separate citizenship category.
Non-U.S. citizens who did not report a country of citizenship but reported the same non-U.S. country for three out of four geographic variables—place of birth, place of high school, place of baccalaureate institution, and postgraduation location—were assigned that reported country as their country of citizenship.
Basic annual salary. Annual salary expected to be earned from the doctorate recipient’s principal job in the next year after receiving the doctorate, not including bonuses or additional compensation for summertime teaching or research.
Carnegie classification (institution categories). In this report, four types of doctorate-granting institutions identified in the figures and tabulations are defined according to the Carnegie classification scheme as updated in 2021: doctoral very high research, doctoral high research, doctoral/professional universities, and other universities (comprised of all other classifications). Institutions are classified according to their aggregate and per-capita levels of research activity, using indicators of research and development expenditures, staffing (including postdoctoral appointees and other nonfaculty research staff with doctorates), and doctoral conferrals in science and engineering and other fields.
Definite plans to stay in the United States. A respondent is coded as having definite plans to stay in the United States if the reported postgraduation location was in the United States and the reported postgraduation plans for employment or postdoc were coded “definite.”
Definite postgraduation plans. The status of postgraduation plans is coded using the values from item B2 of the survey questionnaire, which indicate whether the doctorate recipient’s postgraduation plans for employment or a postdoc position were definite at the time the survey was completed.
Ever attended community college. A respondent is coded as having attended community college if the respondent reported earning an associate’s degree or credit from a community college.
Field of study. The SED collects data on over 1,650 fields of study aggregated into 315 detailed fields, 68 major fields, and 16 broad fields. See table A-5 for a full listing of the SED-CIP codes and their alignment to the detailed, major, and broad fields of study and trend broad and major fields in 2025. See table A-6 for the pre-2021 historical field to trend field crosswalk. See table A-7 for a comparison of the taxonomies.
Doctorate recipients report their fields of study and doctorate dissertation. Their choices may differ from departmental names. Field groupings may differ from those in other reports published by federal sponsors of the SED. The “general” field categories (e.g., “chemistry, general”) include individuals who either received the doctorate in the general subject area or who did not indicate a particular specialty field. The “nec” or not elsewhere classified field categories (e.g., “chemistry nec”) include individuals whose specified doctoral discipline either did not fit into aggregation within major fields or who reported the “other” CIP code (i.e., “chemistry, other”) (table A-4).
Some respondents do not self-code their field of degree and instead provide a text string that must be manually coded by the survey contractor. When manual coding is required, a pair of trained reviewers independently code each text entry, and any discrepancies between the two coders are resolved by a third, more expert reviewer. All manual coding is subject to a final review by NCSES. Generally, the percentage of responses in these data requiring manual coding is low. In 2025, 0.2% of doctorate fields of study reported by respondents were manually coded, as well as 0.6% of associate’s degree fields, 0.2% of bachelor’s degree fields, and 0.4% of master’s degree fields.
Median age at doctorate. One-half of the respondents received the doctorate at or before this age. A recipient’s age is obtained by subtracting the month and year of birth from the month and year of doctorate.
Percentage with master’s. This variable is the percentage of doctorate recipients in a field who received a master’s degree in any field before earning the doctorate.
Research doctorate. A research doctoral degree is oriented toward preparing students to make original intellectual contributions in a field of study and is not primarily intended for the practice of a profession. Research doctorates require the completion of a dissertation or equivalent project.
Time to doctorate. The time it takes to complete a doctoral degree is measured in three ways: (1) the time elapsed from completion of the baccalaureate to completion of the doctorate (total time to degree), (2) the time elapsed from the start of any graduate school program to completion of the doctorate (graduate school time to degree), and (3) the time elapsed from the start of the doctoral program. Time-to-doctorate measures herein are reported as medians. In 2017, the method for accounting for leap days changed to reflect the actual number of leap days during the time period specified, rather than the prior method of adding 0.25 days to each year.
U.S. regions of employment. This variable is used to classify the location of U.S. employment after award of the doctorate.
|
U.S. Region |
U.S. States and Territories |
|
Midwest |
Illinois, Indiana, Iowa, Kansas, Michigan, Minnesota, Missouri, Nebraska, North Dakota, Ohio, South Dakota, Wisconsin |
|
Northeast |
Connecticut, Maine, Massachusetts, New Hampshire, New Jersey, New York, Pennsylvania, Rhode Island, Vermont |
|
South |
Alabama, Arkansas, Delaware, District of Columbia, Florida, Georgia, Kentucky, Louisiana, Maryland, Mississippi, North Carolina, Oklahoma, South Carolina, Tennessee, Texas, Virginia, West Virginia |
|
West |
Alaska, Arizona, California, Colorado, Hawaii, Idaho, Montana, Nevada, New Mexico, Oregon, Utah, Washington, Wyoming, American Samoa, Guam, Puerto Rico, Trust Territories, Virgin Islands |
Recommended data tables
The Survey of Earned Doctorates (SED) is an annual census of all individuals receiving a research doctorate from an accredited U.S. institution in a given academic year. The 2025 data tables present detailed data on the educational history, time to degree, sources of financial support, education-related debt, and postgraduation plans of doctorate recipients, such as definite commitments for postdoc and other employment, employment sector, and median salary. The tables also report demographic characteristics of doctorate recipients, such as sex, race, ethnicity, and citizenship. Explore SED data further via the interactive data tool and the Restricted Data Analysis System.
The National Center for Science and Engineering Statistics has reviewed this product for unauthorized disclosure of confidential information and approved its release (NCSES-DRN26-034).
The Survey of Earned Doctorates (SED) is conducted and sponsored by the National Center for Science and Engineering Statistics (NCSES) within the U.S. National Science Foundation (NSF) and co-sponsored by the National Institutes of Health, Department of Education, and National Endowment for the Humanities. These federal agencies gratefully acknowledge the support and assistance of graduate deans and their staff, registrars, dissertation officers, and other administrators who participate in the SED effort and contribute to its success. Appreciation is also extended to the new research doctorate recipients who completed the 2025 survey.
National Center for Science and Engineering Statistics (NCSES). 2026. Doctorate Recipients from U.S. Universities: 2025 Data Tables. NSF 26-326. Alexandria, VA: U.S. National Science Foundation. Available at https://ncses.nsf.gov/surveys/earned-doctorates/2025.
For additional information about this survey or the methodology, contact