 An official website of the United States government

U.S. R&D Increased by $62 Billion in 2019 to $667 Billion; Estimate for 2020 Indicates a Further Rise to $708 Billion
New data from the National Center for Science and Engineering Statistics (NCSES) within the National Science Foundation indicate that research and experimental development (R&D) performed in the United States totaled $666.9 billion in 2019 (table 1). The estimated total for 2020, based on performer-reported expectations, is $708.0 billion. These numbers compare with U.S. R&D totals of $494.5 billion in 2015 and $406.6 billion in 2010. (All amounts and calculations are reported in current dollars, unless otherwise noted.)
The U.S. R&D system consists of the activities of a diverse group of R&D performers and sources of funding. Included here are private businesses, the federal government, nonfederal governments, higher education institutions, and nonprofit organizations. The organizations that perform R&D often receive significant levels of outside funding, and organizations that fund R&D may also themselves be performers. The data for this InfoBrief derive mainly from NCSES surveys of the annual R&D expenditures of these performers and funders.
The “Data Sources and Availability” section at the end of this InfoBrief summarizes the main data sources and methodology and provides further details on the data. Data described in this report that do not appear in one of this InfoBrief’s tables or figures come from the companion data tables, National Patterns of R&D Resources: 2019–20 Data Update, found at https://ncses.nsf.gov/pubs/nsf22320/.
U.S. R&D expenditures, by performing sector and source of funds: 2010–20
FFRDC = federally funded R&D center.
a The data for 2020 include estimates and are likely to later be revised.
b Includes expenditures of federal intramural R&D as well as costs associated with administering extramural R&D contracts.
c Some components of the R&D performed by nonprofit organizations are estimated and may later be revised.
Note(s):
Data are based on annual reports by performers, except for the nonprofit sector. Expenditure levels for higher education, federal government, and nonfederal government performers are calendar-year approximations based on fiscal year data.
Source(s):
National Center for Science and Engineering Statistics, National Patterns of R&D Resources (annual series).
Current Trends in U.S. Total R&D and National R&D Intensity
U.S. Total R&D
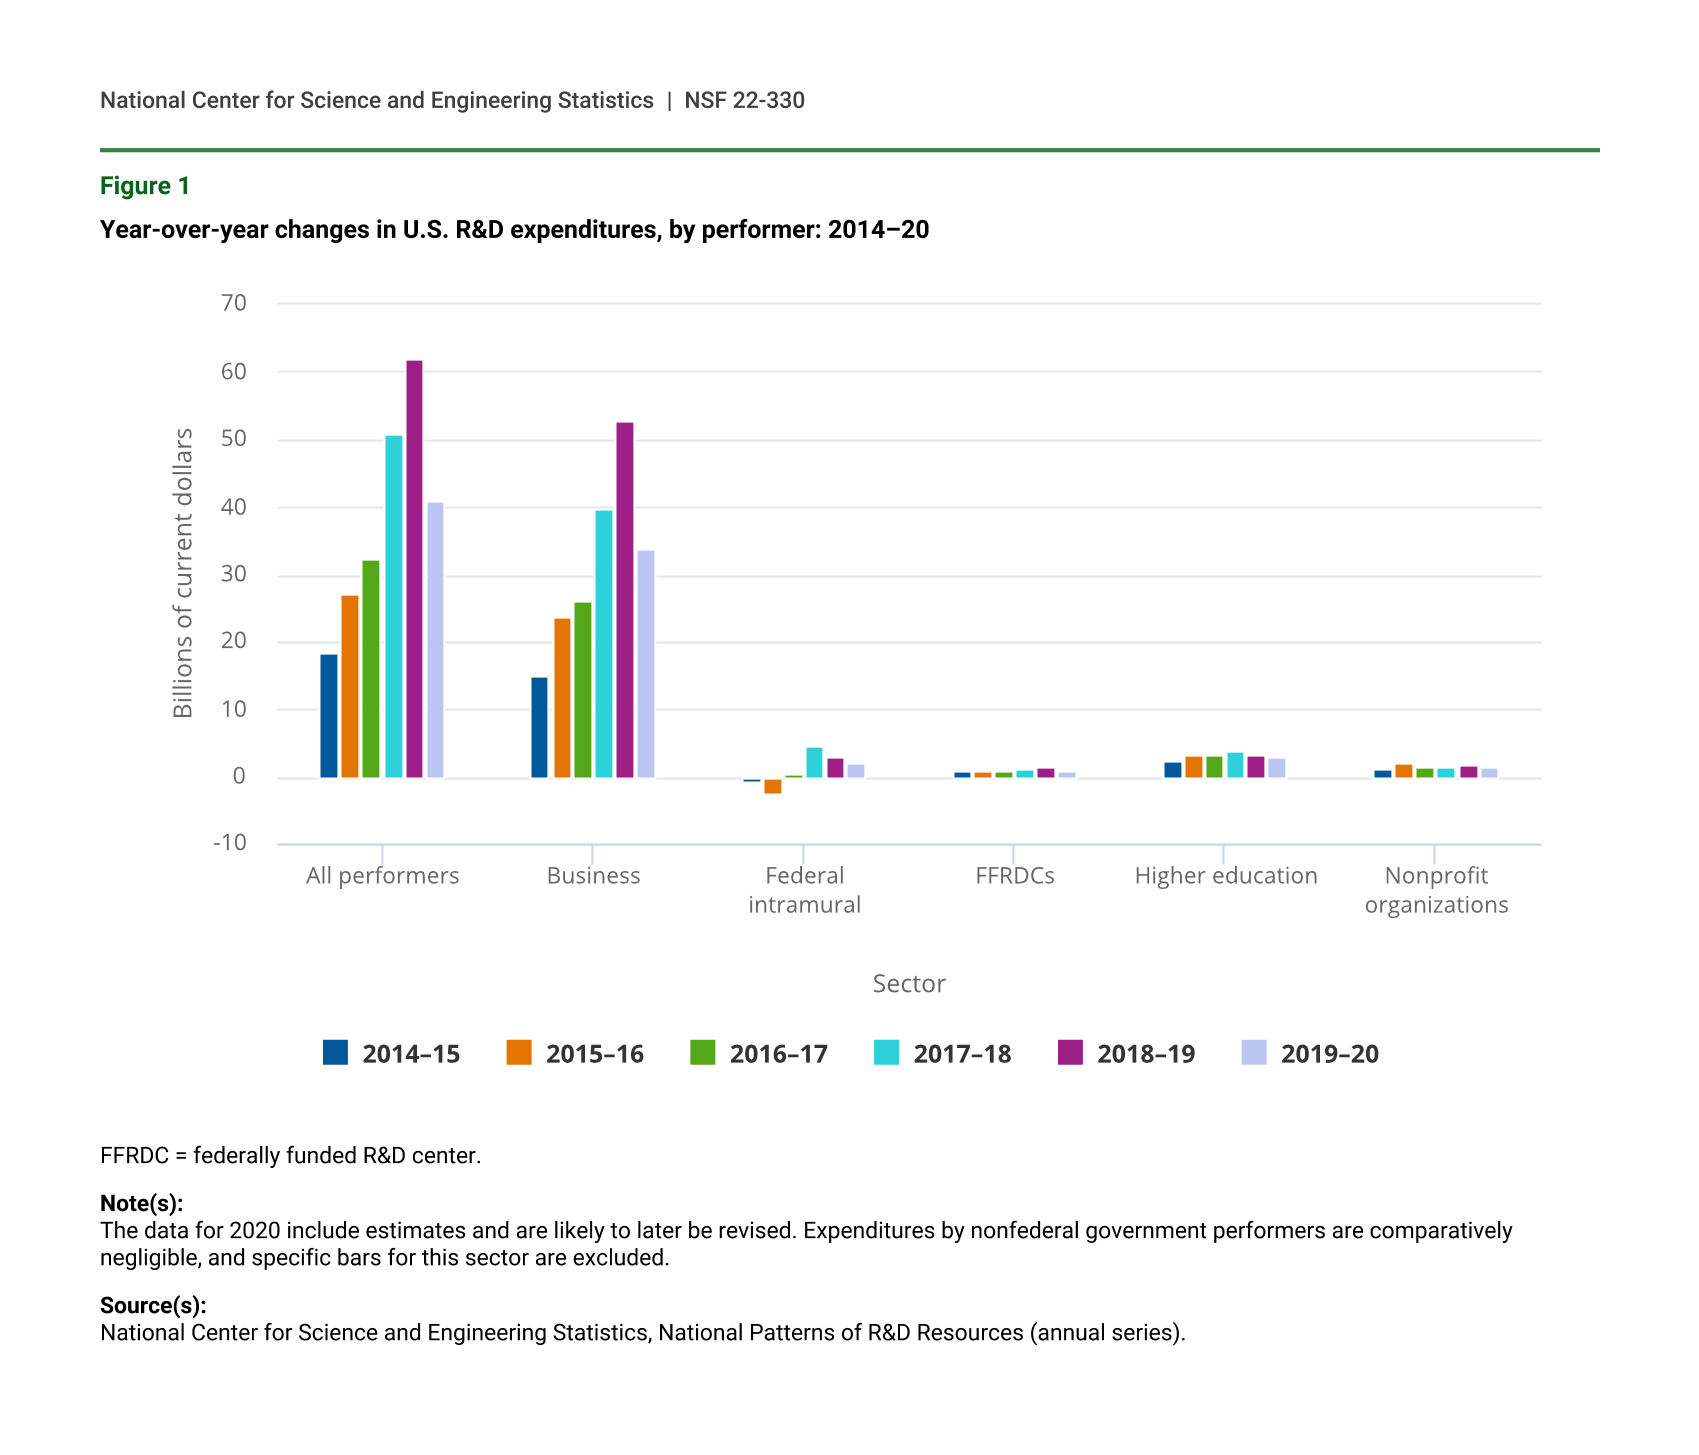
Year-over-year increases in U.S. total R&D expenditures averaged $19.2 billion over the 2010–16 period (table 1). Nonetheless, an even stronger level of yearly R&D increases has emerged in the years since. The U.S. R&D total in 2017 was $32.3 billion ahead of the previous year; $50.8 billion ahead in 2018; $62.0 billion ahead in 2019; and, as presently estimated, $41.1 billion ahead in 2020 (figure 1). This pattern of sustained annual increases in U.S. total R&D since 2010 has been due mainly to consistently higher levels of business R&D performance, which have accounted for near 80% or more of the total annual increases since 2010 (figure 1).
Year-over-year changes in U.S. R&D expenditures, by performer: 2014–20
| Sector | 2014–15 | 2015–16 | 2016–17 | 2017–18 | 2018–19 | 2019–20 |
|---|---|---|---|---|---|---|
| All performers | 18.530 | 27.201 | 32.312 | 50.825 | 62.038 | 41.092 |
| Business | 15.093 | 23.708 | 26.263 | 39.771 | 52.612 | 33.766 |
| Federal intramural | -0.585 | -2.436 | 0.469 | 4.562 | 3.077 | 2.066 |
| FFRDCs | 0.745 | 0.776 | 0.897 | 1.241 | 1.369 | 0.818 |
| Higher education | 2.284 | 3.157 | 3.324 | 3.799 | 3.262 | 2.936 |
| Nonprofit organizations | 0.981 | 1.971 | 1.348 | 1.440 | 1.687 | 1.486 |
FFRDC = federally funded R&D center.
Note(s):
The data for 2020 include estimates and are likely to later be revised. Expenditures by nonfederal government performers are comparatively negligible, and specific bars for this sector are excluded.
Source(s):
National Center for Science and Engineering Statistics, National Patterns of R&D Resources (annual series).
Adjusting for inflation, growth in U.S. total R&D averaged 3.8% annually over the 2010–19 period, well above the 2.2% average growth of U.S. gross domestic product (GDP) over the same period (table 2). By comparison, average annual growth of U.S. total R&D in the prior decade (2000–10) was lower at 2.1%, although still marginally outpacing the 1.8% rate of GDP expansion. The estimate for 2020 shows inflation-adjusted R&D growing at 4.9% compared with a 3.4% decline of GDP.
Annual changes in U.S. R&D expenditures and gross domestic product, by performing sector: 1990–2020
NA = not available.
FFRDC = federally funded R&D center.
a The R&D data for 2020 include estimates and are likely to later be revised.
b Survey data on state internal R&D performance were not available prior to 2006; data for 2008 were not collected.
c Some components of the R&D performed by nonprofit organizations are estimated and may later be revised.
Note(s):
The longer-term trend rates are calculated as compound annual growth rates.
Source(s):
National Center for Science and Engineering Statistics, National Patterns of R&D Resources (annual series).
R&D-to-GDP Ratio
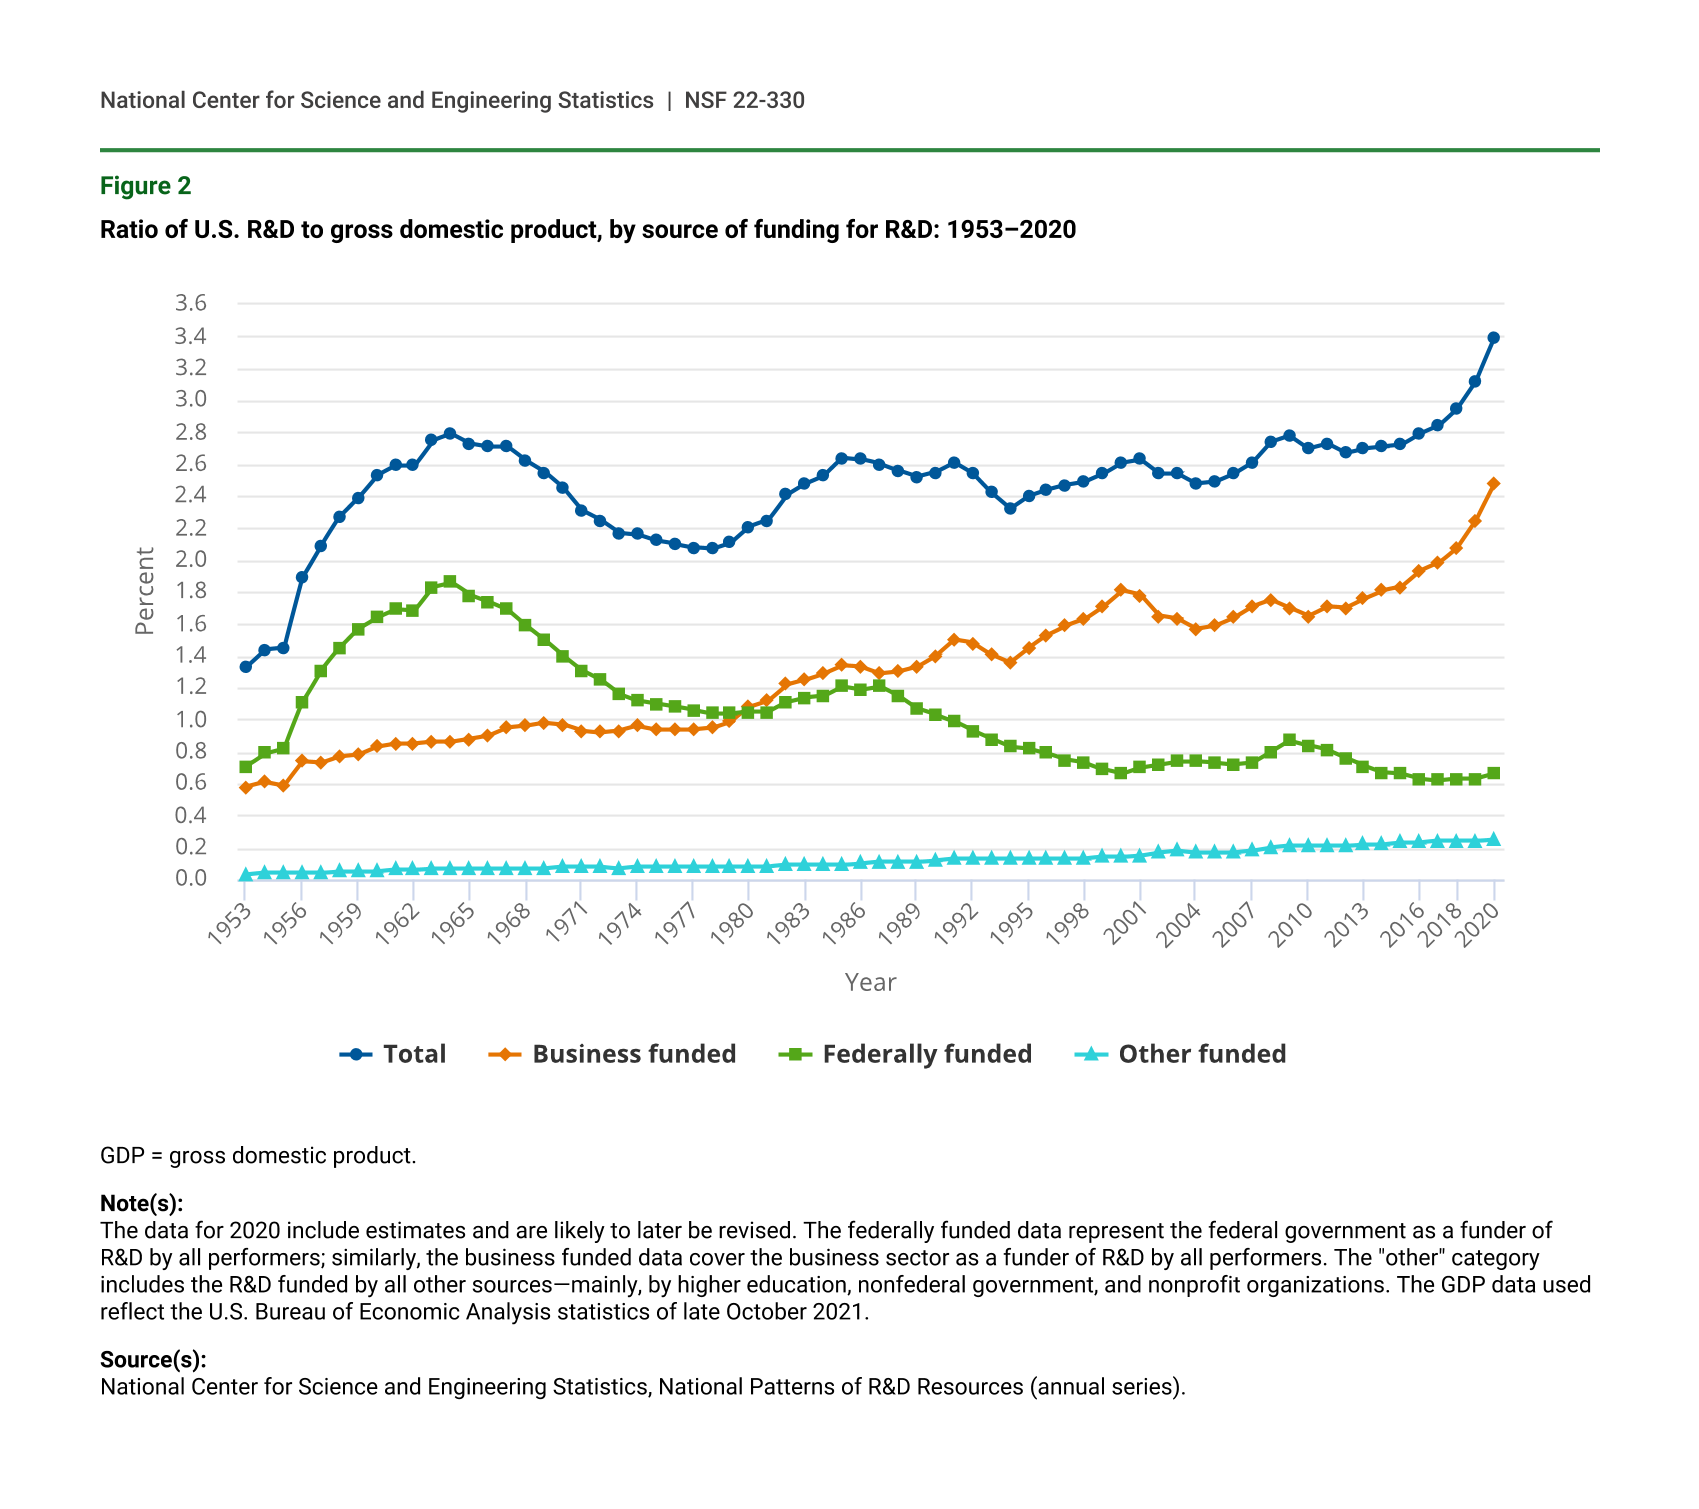
The ratio of total national R&D expenditures to GDP is widely used by national statistical offices and other policy analysts as an overall gauge of the intensity of a nation’s R&D effort. In this new edition of the National Patterns series, the ratio of U.S. R&D to GDP was 3.12% in 2019 and is estimated to be 3.39% in 2020.
The U.S. ratio generally has been rising since the mid-1990s, although with some periods of decline (figure 2). Prior to 2019, the highest U.S. ratios recorded were 2.79% in 1964, 2.78% in 2009, 2.79% again in 2016, 2.84% in 2017, and 2.95% in 2018. Reaching an R&D intensity level above 3.0% is widely regarded in the R&D policy community as a notable national achievement. Some further maturity in the data is warranted in interpreting the reported 3.39% for 2020—due both to its estimated nature and the fact that the sizable uptick from 2019 reflects both a rising R&D level and a declining GDP.
Ratio of U.S. R&D to gross domestic product, by source of funding for R&D: 1953–2020
| Year | Total | Business funded | Federally funded | Other funded |
|---|---|---|---|---|
| 1953 | 1.33 | 0.58 | 0.71 | 0.03 |
| 1954 | 1.44 | 0.61 | 0.79 | 0.04 |
| 1955 | 1.45 | 0.59 | 0.82 | 0.04 |
| 1956 | 1.89 | 0.74 | 1.11 | 0.04 |
| 1957 | 2.09 | 0.73 | 1.31 | 0.04 |
| 1958 | 2.27 | 0.77 | 1.45 | 0.05 |
| 1959 | 2.39 | 0.78 | 1.57 | 0.05 |
| 1960 | 2.53 | 0.83 | 1.64 | 0.05 |
| 1961 | 2.59 | 0.85 | 1.69 | 0.06 |
| 1962 | 2.59 | 0.85 | 1.68 | 0.06 |
| 1963 | 2.75 | 0.86 | 1.83 | 0.07 |
| 1964 | 2.79 | 0.86 | 1.86 | 0.07 |
| 1965 | 2.73 | 0.88 | 1.78 | 0.07 |
| 1966 | 2.71 | 0.90 | 1.74 | 0.07 |
| 1967 | 2.71 | 0.95 | 1.69 | 0.07 |
| 1968 | 2.62 | 0.96 | 1.59 | 0.07 |
| 1969 | 2.55 | 0.98 | 1.50 | 0.07 |
| 1970 | 2.45 | 0.97 | 1.40 | 0.08 |
| 1971 | 2.31 | 0.93 | 1.31 | 0.08 |
| 1972 | 2.25 | 0.92 | 1.25 | 0.08 |
| 1973 | 2.17 | 0.93 | 1.16 | 0.07 |
| 1974 | 2.16 | 0.96 | 1.12 | 0.08 |
| 1975 | 2.12 | 0.94 | 1.10 | 0.08 |
| 1976 | 2.10 | 0.94 | 1.08 | 0.08 |
| 1977 | 2.08 | 0.94 | 1.06 | 0.08 |
| 1978 | 2.07 | 0.95 | 1.04 | 0.08 |
| 1979 | 2.11 | 0.99 | 1.04 | 0.08 |
| 1980 | 2.21 | 1.08 | 1.05 | 0.08 |
| 1981 | 2.25 | 1.12 | 1.05 | 0.08 |
| 1982 | 2.41 | 1.22 | 1.11 | 0.09 |
| 1983 | 2.48 | 1.25 | 1.14 | 0.09 |
| 1984 | 2.53 | 1.29 | 1.15 | 0.09 |
| 1985 | 2.64 | 1.34 | 1.21 | 0.09 |
| 1986 | 2.63 | 1.33 | 1.19 | 0.10 |
| 1987 | 2.60 | 1.29 | 1.21 | 0.11 |
| 1988 | 2.56 | 1.30 | 1.15 | 0.11 |
| 1989 | 2.52 | 1.33 | 1.07 | 0.11 |
| 1990 | 2.55 | 1.40 | 1.03 | 0.12 |
| 1991 | 2.61 | 1.50 | 0.99 | 0.13 |
| 1992 | 2.54 | 1.48 | 0.93 | 0.13 |
| 1993 | 2.42 | 1.41 | 0.88 | 0.13 |
| 1994 | 2.32 | 1.36 | 0.83 | 0.13 |
| 1995 | 2.40 | 1.45 | 0.82 | 0.13 |
| 1996 | 2.44 | 1.53 | 0.79 | 0.13 |
| 1997 | 2.47 | 1.59 | 0.75 | 0.13 |
| 1998 | 2.49 | 1.63 | 0.73 | 0.13 |
| 1999 | 2.54 | 1.71 | 0.69 | 0.14 |
| 2000 | 2.61 | 1.81 | 0.66 | 0.14 |
| 2001 | 2.63 | 1.78 | 0.70 | 0.15 |
| 2002 | 2.54 | 1.65 | 0.72 | 0.17 |
| 2003 | 2.54 | 1.63 | 0.74 | 0.18 |
| 2004 | 2.48 | 1.57 | 0.74 | 0.17 |
| 2005 | 2.49 | 1.59 | 0.73 | 0.17 |
| 2006 | 2.54 | 1.64 | 0.72 | 0.17 |
| 2007 | 2.61 | 1.71 | 0.73 | 0.18 |
| 2008 | 2.74 | 1.75 | 0.80 | 0.20 |
| 2009 | 2.78 | 1.70 | 0.87 | 0.21 |
| 2010 | 2.70 | 1.65 | 0.84 | 0.21 |
| 2011 | 2.73 | 1.71 | 0.81 | 0.21 |
| 2012 | 2.67 | 1.70 | 0.76 | 0.21 |
| 2013 | 2.70 | 1.76 | 0.71 | 0.22 |
| 2014 | 2.71 | 1.81 | 0.67 | 0.22 |
| 2015 | 2.72 | 1.83 | 0.66 | 0.23 |
| 2016 | 2.79 | 1.93 | 0.63 | 0.23 |
| 2017 | 2.84 | 1.98 | 0.62 | 0.24 |
| 2018 | 2.95 | 2.08 | 0.63 | 0.24 |
| 2019 | 3.12 | 2.25 | 0.63 | 0.24 |
| 2020 | 3.39 | 2.48 | 0.66 | 0.25 |
GDP = gross domestic product.
Note(s):
The data for 2020 include estimates and are likely to later be revised. The federally funded data represent the federal government as a funder of R&D by all performers; similarly, the business funded data cover the business sector as a funder of R&D by all performers. The "other" category includes the R&D funded by all other sources—mainly, by higher education, nonfederal government, and nonprofit organizations. The GDP data used reflect the U.S. Bureau of Economic Analysis statistics of late October 2021.
Source(s):
National Center for Science and Engineering Statistics, National Patterns of R&D Resources (annual series).
Most of the rise in R&D-to-GDP ratio over the past several decades is owed to the increased nonfederal spending on R&D, particularly by the business sector. This arises largely from the growing role of business R&D in the national R&D system, which in turn reflects the increase of R&D-dependent goods and services in the national and global economies. By contrast, the share of federally funded R&D expenditures declined from the mid-1980s to the late 1990s, notably from cuts in defense-related R&D. This was followed by a gradual uptick through 2009, driven by increased federal spending on biomedical and national security R&D and the one-time incremental funding for R&D provided by the American Recovery and Reinvestment Act of 2009 (ARRA). However, the federally funded share has returned to a path of mainly decline since 2010 (figure 2).
Performers of R&D
Business
The business sector is by far the largest performer of U.S. R&D. In 2019, domestically performed business R&D accounted for $498.2 billion, or 75% of the $666.9 billion national R&D total (table 1 and table 3). The business sector’s predominance in national R&D performance has long been the case, with its annual share ranging between 69% and 75% over the nearly two-decade period of 2000–19.
Adjusted for inflation, growth in business R&D averaged 4.8% annually over 2010–19, well ahead of the 3.8% annual average for U.S. total R&D and the 2.2% annual average for GDP (table 2).
R&D performed in the domestic United States by businesses occurs widely in manufacturing and nonmanufacturing. Presently, most occurs in five industries: chemicals manufacturing (which includes the pharmaceuticals industry); computer and electronic products manufacturing; transportation equipment manufacturing (which includes the automobiles and aerospace industries); information (which includes the software publishing industry); and professional, scientific, and technical services (which include the computer systems design and scientific R&D services industries).
Higher Education
R&D performed in the United States by the higher education sector totaled $78.2 billion in 2019, or 12% of U.S. total R&D (table 1 and table 3). Over the period 2000–19, the higher education share of U.S. total R&D ranged between 11% and 14%.
U.S. R&D expenditures, by performing sector, source of funds, and type of R&D: 2019
* = amount < $0.5 million; ** = small to negligible amount, included as part of the funding provided by nonprofit organizations; *** = small to negligible amount, included as part of the funding provided by other sectors.
FFRDC = federally funded R&D center.
Note(s):
Some components of R&D performance and funding by other nonprofit organizations are projected and may later be revised.
Source(s):
National Center for Science and Engineering Statistics, National Patterns of R&D Resources (annual series).
Adjusted for inflation, growth in this sector’s R&D performance averaged 1.6% annually over 2010–19, well behind both U.S. total R&D (3.8%) and GDP (2.2%). The year-by-year trajectory in higher education R&D expenditures has been marked by contrasts: relatively low growth in 2010–11, noticeable slowdown in 2012–14, and higher but still comparatively modest rates (similar to those for GDP) in 2015–19 (table 2).
Federal Agencies and Federally Funded Research and Development Centers
The federal government performed $62.8 billion, or 9% of the U.S. R&D total in 2019 (table 1 and table 3). This amount included $39.9 billion (6% of the U.S. total) performed by the intramural R&D facilities of federal agencies and $22.9 billion (3%) performed by the 42 federally funded research and development centers (FFRDCs). The federal share of U.S. R&D performance rose from about 11% in 2000 to 12% in 2010 but has declined since then to its current 9% share.
Adjusted for inflation, this sector’s R&D performance in 2010–19 increased at an annual average rate of 0.6%, in contrast to the 3.8% rate for U.S. total R&D and 2.2% for GDP over the same period (table 2). In the previous decade (2000–10), federal R&D performance grew an average of 3.8% yearly, well ahead of U.S. total R&D (2.1%). However, the year-over-year changes for 2010–19 were a varied picture: outright declines or low growth rates in 2012–17 but a turn to markedly higher rates of increase in 2018–19. Part of this history reflects the waning of the incremental funding from ARRA after 2010 and the more challenging environment for federal budget support after 2011; in 2018 and 2019, the results of lengthy congressional debates on federal spending resulted in substantial increases overall in the agency budgets to conduct R&D.
State Government
Nonprofit Organizations
R&D performed in the United States by nonprofit organizations (excluding higher education institutions, the federal government, and nonfederal governments) was an estimated $27.0 billion in 2019 (table 1 and table 3). This was 4% of U.S. total R&D, a share that has changed little since the early 2000s.
Sources of R&D Funding
Business
Matching its predominant role in R&D performance, the business sector is also the leading source of funding for R&D performed in the United States. In 2019, business sector funding accounted for $481.8 billion, or 72% of U.S. total R&D performance (table 3). Nearly all (98%) of the business sector’s funding for R&D that year supported business R&D performance—whether performed by the company itself or in funding provided for the R&D performed by other companies. Most of the remainder went to R&D performers in higher education and nonprofit organizations, along with small amounts to FFRDCs and nonfederal governments.
The business sector’s predominant role in U.S. R&D funding began in the early 1980s when its support first started to exceed 50% of the total. Over 2000–19, the business sector’s share of the U.S. R&D funding total ranged from 61% to 72% yearly.
Federal Government
The federal government is the second-largest source of funding for U.S. R&D, behind the business sector. It is a significant resource for most all U.S. R&D performer sectors, except the business sector where business’s own funds greatly overshadow the federal role.
Funds from the federal government accounted for $133.8 billion, or 20% of U.S. total R&D, in 2019. The largest amounts of federal funding were directed to R&D performance by the federal government, higher education, and businesses (table 3). In 2019, federal funding supported about 51% of academic R&D performance, 5% of business R&D performance, 33% of nonprofit R&D performance, all of federal intramural R&D performance, and almost all (98%) of FFRDC R&D performance.
Several decades ago, the federal government was the leading sponsor of the nation’s R&D, funding 67% of all U.S. R&D in 1964 (figure 2). The federal share decreased to just below half (49%) of all funding in the late 1970s, to a little over a third (36%) in the mid-1990s, and to a quarter (25%) by the turn of the century. (A major factor in the decrease of the federal share of national R&D was the sharp decline in funding for space R&D after the United States won the race to the moon in the late 1960s. At largely the same time, the business sector was rapidly expanding its energy-related R&D in response to the world oil supply crises.) The share ticked up again to 31% in 2009 and 2010 amid changing business conditions and expanded federal funding for health, defense, and counterterrorism R&D (including ARRA funding). The federal share, however, again declined in the subsequent years and stood at 20% in 2019. Some of this recent year’s decline reflects the waning of the ARRA incremental funding and also the more challenging federal budget environment since 2011. Some, however, is a natural consequence of the large increases in R&D funding from the business sector that also have been happening in these recent years.
Other Sources
The remainder of R&D funding from other sources is a smaller component: $51.3 billion in 2019, or about 8% of U.S. total R&D performance that year (table 3). Of this amount, $21.6 billion was from higher education’s own institutional funds, nearly all of which remained in the academic sector; $4.9 billion was from state and local governments, primarily supporting academic research; and $24.8 billion was from nonprofit organizations, mostly funding this sector’s own R&D. Of the estimated nonprofit total, some funds ($7.9 billion) supported R&D in higher education, smaller amounts supported that of business ($0.9 billion) and FFRDCs ($0.2 billion), and a slight amount ($0.01 billion) supported state government (table 3).
R&D by Type of R&D
In 2019, basic research activities accounted for $102.9 billion, or 15% of U.S. total R&D expenditures (table 4). Applied research was $132.0 billion, or 20% of the total. Most of the total of U.S. R&D expenditures was experimental development at $432.0 billion, or 65%.
U.S. R&D expenditures, by type of R&D: selected years, 2000–20
a The data for 2020 include estimates and are likely to later be revised.
Note(s):
Data throughout the span of time reported here are consistently based on Organisation for Economic Co-operation and Development Frascati Manual definitions for basic research, applied research, and experimental development. Prior to 2010, however, some changes had been introduced in the questionnaires of the sectoral expenditure surveys to improve the accuracy of respondents' classification of their R&D by type. Accordingly, small percentage changes in the historical data may not be meaningful.
Source(s):
National Center for Science and Engineering Statistics, National Patterns of R&D Resources (annual series).
Higher education accounted for just under half (48%) of the $102.9 billion of basic research in 2019 (table 3). The business sector was the second-largest basic research performer (32%). Business was the majority performer (58%) of the $132.0 billion of applied research in 2019. Higher education was second at 17%, and federal intramural performers plus FFRDCs accounted for 16% of the applied research total. Business continued to dominate experimental development, accounting for 90% of the $432.0 billion of that category in 2019.
Federal funding accounted for 41% of the $102.9 billion of basic research in 2019. But federal funds were less prominent for applied research (32% of $132.0 billion) and experimental development (12% of $432.0 billion). The business sector provided the greatest share of funding for applied research (56%) and the predominant share for experimental development (87%). Interestingly, it also accounted for a sizable share (33%) of funding for basic research.
Over the 2010–19 period, the split of U.S. total R&D expenditures among the three types of R&D did not largely change (table 4). Applied research tracked in the range of 19% to 21% throughout the period (table 4). However, there was the appearance of a gradual drop in basic research’s share, from 19% in 2010 down to 15% in 2019. And the opposite for experimental development, rising, for the most part, from 62% in 2010 to 65% in 2019. Nonetheless, adjusting for inflation, about $12 billion more in basic research was performed in 2019 than in 2010, $35 billion more in applied research, and $124 billion more in experimental development.
The most interesting shifts in the relative roles of performers and funders continue to be in the realm of basic research. In 2010, businesses performed 21% of U.S. basic research, but the sector’s role rose to 32% in 2019—this was due in good part to substantial increases in basic research performed by the pharmaceuticals and medicines industries, as well as the information industry and the professional, scientific, and technical services sector. Over the same period, the share of U.S. basic research performed by higher education institutions—historically, the nation’s largest basic research performer—declined from 51% in 2010 to 48% in 2019. Further, businesses funded 23% of U.S. basic research in 2010, rising to 33% in 2019. Over the same period, the federally funded share declined from 52% to 41%.
Data Sources and Availability
The statistics on U.S. R&D presented in this report derive mainly from integrating the data on R&D expenditures and funding collected by NCSES’s annual national surveys of the organizations that perform and fund the vast majority of U.S. R&D. In some cases, the primary data from these surveys are adjusted to enable consistent integration of the statistics across these separately conducted surveys. In addition, preliminary or otherwise estimated values may be used where final data from one or more of the surveys are not yet available but can reasonably be calculated.
The R&D surveys include NCSES’s annual surveys of business R&D (the Business Enterprise Research and Development Survey for 2019, the preceding Business Research and Development Survey for 2017–18, the Business R&D and Innovation Survey for 2008–16, and the Survey of Industrial R&D for 2007 and earlier years). In addition, the business R&D totals include the R&D expenditures reported by “micro” companies (defined as companies with fewer than 10 employees) through NCSES surveys fielded for 2016 and forward (the 2016 Business R&D and Innovation Survey-Microbusiness and the 2017, 2018, and 2019 editions of the Annual Business Survey). Other NCSES survey data sources are the Higher Education Research and Development Survey (for FYs 2010–20), and the preceding Survey of R&D Expenditures at Universities and Colleges (FY 2009 and earlier years), the Survey of Federal Funds for Research and Development (FYs 2020–21 and earlier years), and the FFRDC Research and Development Survey (FY 2020 and earlier years). Amounts for the R&D performed by nonprofit organizations with funding from the nonprofit sector and from business sources are estimated based on data and parameters from the 2016 Nonprofit Research and Development Activities Survey and the 1996–97 Survey of R&D Funding and Performance by Nonprofit Organizations.
A full set of detailed statistical tables associated with the National Patterns data is available in a companion report: National Patterns of R&D Resources: 2019–20 Data Update, available at https://ncses.nsf.gov/pubs/nsf22320. This supplementary report also provides further details on the nature of the data and the methodologies used to produce the National Patterns statistics. For further information and questions, contact the author.
Notes
1Essential definitions: Research and experimental development (R&D) comprises creative and systematic work undertaken in order to increase the stock of knowledge—including knowledge of humankind, culture, and society—and to devise new applications of available knowledge. Basic research: Experimental or theoretical work undertaken primarily to acquire new knowledge of the underlying foundations of phenomena and observable facts without any particular application or use in view. Applied research: Original investigation undertaken in order to acquire new knowledge; directed primarily toward a specific, practical aim or objective. Experimental development: Systematic work drawing on knowledge gained from research and practical experience and producing additional knowledge, which is directed to producing new products or processes or to improving existing products or processes (see Organisation for Economic Co-Operation and Development (OECD). Frascati Manual 2015: Guidelines for Collecting and Reporting Data on Research and Experimental Development. Paris. Available at https://doi.org/10.1787/9789264239012-en).
2In this report, dollars adjusted for inflation (i.e., constant dollars) are based on the GDP implicit price deflator (currently indexed to 2012 dollars) as published by the Department of Commerce, Bureau of Economic Analysis (see U.S. Bureau of Economic Analysis, https://apps.bea.gov/iTable/iTable.cfm?reqid=19&step=2#reqid=19&step=2&isuri=1&1921=survey). Note that GDP deflators are calculated on an economy-wide scale and do not explicitly focus on R&D.
3Due to sample variability in the data for the business R&D component (particularly the variability for 2000), the compound annual growth rate of the U.S. R&D total over the 2000–10 period fails (but only barely so) to exceed the corresponding rate of growth of GDP at a 90% confidence level.
4By comparison to the world’s other largest R&D performers in 2019, the U.S. ratio was well ahead of China’s 2.23%, France’s 2.20%, and the United Kingdom’s 1.76%; was considerably behind South Korea’s 4.64%; but was nearly on par with Germany’s 3.19% and Japan’s 3.20%. See Organisation for Economic Co-Operation and Development (OECD). 2021. OECD Main Science and Technology Indicators. R&D Highlights in the September 2021 Publication. OECD Directorate for Science, Technology and Innovation. Available at https://www.oecd.org/sti/msti.htm.
5Due to sample variability in the data for the business R&D component, the calculated R&D-to-GDP ratios for 1964, 2009, 2016, and 2017 are not significantly different from one another at a 90% confidence level.
6For further details and statistics on the R&D performed in the United States by the business sector, see the upcoming report (data year 2019) of the NCSES Business Enterprise R&D Survey, which will be available at https://www.nsf.gov/statistics/srvyberd/#tabs-2.
7The data on higher education R&D reported by National Patterns differ from the underlying survey data in several respects. First, National Patterns translates the Higher Education R&D (HERD) Survey’s primary data in academic fiscal years to calendar year equivalents. Second, National Patterns reports higher education R&D expenditures that are adjusted to remove the double-counting of pass-through funding that are included in HERD Survey source data. For further details on this topic, see “Technical Notes” in National Center for Science and Engineering Statistics (NCSES). 2022. National Patterns of R&D Resources: 2019–20 Data Update. NSF 22-320. Alexandria, VA: National Science Foundation. Available at https://ncses.nsf.gov/pubs/nsf22320.
8Estimates from the NCSES business R&D surveys mentioned are all derived from sample data and thereby contain sampling error. Consequently, estimates of U.S. total R&D also contain sampling errors. For more information on this topic and other surveys used in the National Patterns tabulations, see “Technical Notes” in National Center for Science and Engineering Statistics (NCSES). 2022. National Patterns of R&D Resources: 2019–20 Data Update. NSF 22-320. Alexandria, VA: National Science Foundation. Available at https://ncses.nsf.gov/pubs/nsf22320.
Suggested Citation
Boroush M; National Center for Science and Engineering Statistics (NCSES). 2022. U.S. R&D Increased by $62 Billion in 2019 to $667 Billion; Estimate for 2020 Indicates a Further Rise to $708 Billion. InfoBrief NSF 22-330. Alexandria, VA: National Science Foundation. Available at https://ncses.nsf.gov/pubs/nsf22330/.
Contact Us
NCSES
National Center for Science and Engineering Statistics
Directorate for Social, Behavioral and Economic Sciences
National Science Foundation
2415 Eisenhower Avenue, Suite W14200
Alexandria, VA 22314
Tel: (703) 292-8780
FIRS: (800) 877-8339
TDD: (800) 281-8749
E-mail: ncsesweb@nsf.gov
NSF 22-330
|June 1, 2022