 An official website of the United States government

Innovation Data from the 2020 Annual Business Survey
Of the estimated 4.9 million for-profit companies with at least one employee, a quarter (25%) introduced an innovation during 2017–19 (table 1). Eleven percent of these for-profit companies introduced one or more product innovations, and 22% introduced one or more business process innovations.
Data are from the Annual Business Survey (ABS), which provides a comprehensive view of business innovation in the United States. ABS survey questions are based on the Oslo Manual (2018 edition), developed by the Organisation for Economic Co-operation and Development (OECD) and Eurostat (the Statistical Office of the European Union). The manual provides internationally recognized definitions and guidelines for measuring innovation. In the Oslo framework, innovation is “the introduction of new or improved products (goods or services) or business processes that differed significantly from the business’s previous products or processes.”
This InfoBrief provides findings from the third year of the ABS and, when appropriate, comparisons to the previous years of data collection. The ABS was developed and is cosponsored by the National Center for Science and Engineering Statistics within the National Science Foundation and by the Census Bureau.
Product and business process innovating companies, by industry and company size: 2017–19
na = not applicable; r = relative standard error > 50%.
NAICS = 2017 North American Industry Classification System.
Note(s):
Detail may not add to total because of rounding or unavailable NAICS detail for select records beyond the 4-digit industry classification. Industry classification based on dominant establishment payroll. Statistics are representative of companies located in the United States.
Source(s):
National Center for Science and Engineering Statistics and Census Bureau, 2020 Annual Business Survey: Data Year 2019.
ABS Innovation Trends
Among for-profit companies with at least one employee in the United States, overall innovation decreased from 30% of companies in 2016–18 (ABS 2019) to 25% in 2017–19 (ABS 2020). Product innovation decreased from 19% of companies in 2016–18 to 11% in 2017–19, whereas business process innovation increased slightly from 19% of companies in 2016–18 to 22% in 2017–19. These changes in overall innovation rates were not uniform across types of innovation, company size, or economic sector. Questions on innovation have been asked since the inaugural ABS in 2018 (reference period 2015–17). The Oslo Manual sets forth a framework to develop a statistical approach to support the measurement of innovation in firms. The definition of innovation and the types of innovation were revised between the Oslo Manual 2005 and the Oslo Manual 2018. Between the ABS 2018 (reference period 2015–17), which used the Oslo Manual 2005 definition, and the ABS 2019 (reference period 2016–18), which used the Oslo Manual 2018 definition, the overall rate of innovation decreased from 43% of companies to 30% (table 2). The difference between these 2 years can most likely be attributed to the change in the Oslo Manual definition, sampling variation, and changes in the questionnaire. However, the ABS 2020 (reference period 2017–19) and the ABS 2019 (reference period 2016–18) had the same innovation questions and the sampling procedures, so differences between these two survey cycles cannot be attributable to the same reasoning.
Innovating companies, by industry: 2015–17, 2016–18, and 2017–19
na = not applicable; r = relative standard error > 50%.
NAICS = 2017 North American Industry Classification System.
Note(s):
Detail may not add to total because of rounding or unavailable NAICS detail for select records beyond the 4-digit industry classification. Industry classification based on dominant establishment payroll. Statistics are representative of companies located in the United States.
Source(s):
National Center for Science and Engineering Statistics and Census Bureau, 2020, 2019, and 2018 Annual Business Survey.
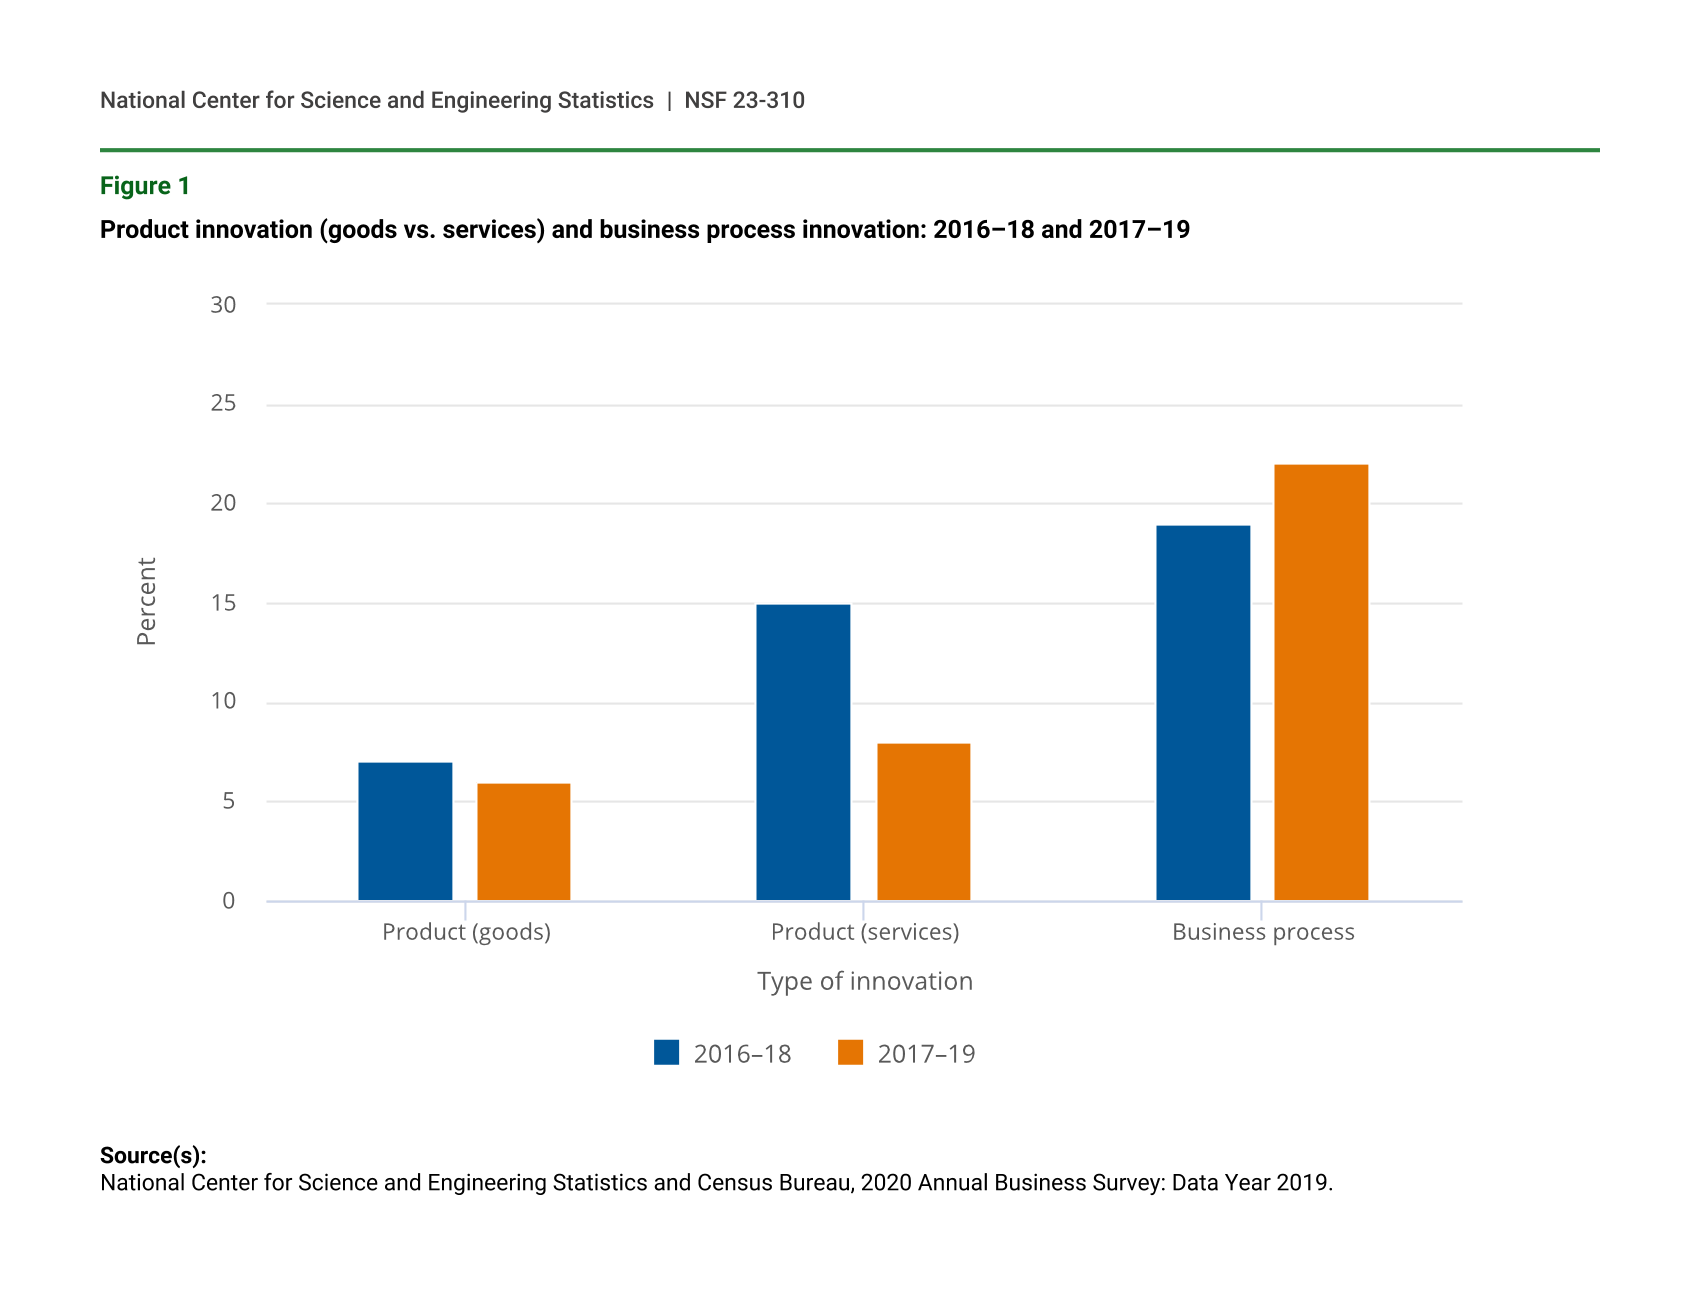
Product innovation includes both innovation in goods and in services. Further examination suggests that it was the services aspect of the product innovation that drove the decrease in innovation rates between the ABS 2019 and the ABS 2020. Among for-profit companies with at least one employee in the United States, goods innovation was steady at 7% of companies in 2016–18 (ABS 2019) and 6% in 2017–19 (ABS 2020), but innovation in services decreased by nearly half, from 15% in 2016–18 to 8% in 2017–19 (figure 1). Table 3 suggests that the change in the rate of service innovation was concentrated in microbusinesses (businesses with fewer than 10 employees). For microbusinesses, the percentage of companies that were service innovators decreased by approximately half between the ABS 2019 and the ABS 2020. However, for the large companies, the percentages of companies that were service innovators were almost identical across these two survey cycles. These results suggest that the differences in overall innovation are attributed to less frequent reports of service innovation in 2017–19 among smaller companies—companies that are more susceptible to changes in the business environment.
Product innovation (goods vs. services) and business process innovation: 2016–18 and 2017–19
| Type of innovation | 2016–18 | 2017–19 |
|---|---|---|
| Product (goods) | 7 | 6 |
| Product (services) | 15 | 8 |
| Business process | 19 | 22 |
Source(s):
National Center for Science and Engineering Statistics and Census Bureau, 2020 Annual Business Survey: Data Year 2019.
Services and goods innovating companies, by industry and size of company: 2016–18 and 2017–19
r = relative standard error > 50%.
Note(s):
Detail may not add to total because of rounding. Industry classification based on dominant establishment payroll. Statistics are representative of companies located in the United States.
Source(s):
National Center for Science and Engineering Statistics and Census Bureau, 2020 Annual Business Survey: Data Year 2019.
Trends in the degree of novelty of innovation also show that the overall decline in the percentage of companies reporting innovation from 2016–18 to 2017–19 was not consistent across all types of innovation. Products that are new to the market are assumed to have a higher degree of novelty than are products that are new only to the business. Four percent of all companies covered by the ABS introduced a product that was considered new to the market during 2017–19 (table 4). This was virtually identical to the figures from 2016–18 (4%). Seven percent of companies introduced product innovations that were new only to the business in both 2017–19 and 2016–18. This was despite the changes in rates of overall innovation among companies over the past two survey cycles.
Companies with new to the market and new to the business product innovation, by industry: 2017–19
r = relative standard error > 50%.
NAICS = 2017 North American Industry Classification System.
Note(s):
Detail may not add to total because of rounding or unavailable NAICS detail for select records beyond the 4-digit industry classification. Industry classification based on dominant establishment payroll. Statistics are representative of companies located in the United States.
Source(s):
National Center for Science and Engineering Statistics and Census Bureau, 2020 Annual Business Survey: Data Year 2019.
These percentages stay consistent even when we examine changes over the last two cycles of the ABS for the manufacturing and nonmanufacturing industries. Product innovation that was new to the market for manufacturing companies was steady at 8% of companies in 2017–19 and 2016–18, and for nonmanufacturing companies, it was steady at 4% (table 5). Product innovation that was new to the business was similarly consistent.
Companies with new to market and new to the business product innovation, by industry and size of company: 2016–18 and 2017–19
na = not applicable; r = relative standard error > 50%.
NAICS = 2017 North American Industry Classification System.
Note(s):
Detail may not add to total because of rounding or unavailable NAICS detail for select records beyond the 4-digit industry classification. Industry classification based on dominant establishment payroll. Statistics are representative of companies located in the United States.
Source(s):
National Center for Science and Engineering Statistics and Census Bureau, 2020 Annual Business Survey: Data Year 2019.
Additional ABS 2020 Findings
By Industry
Substantial differences in innovation incidence exist between manufacturing and nonmanufacturing industries. Although rates of companies reporting innovation generally are higher for manufacturing companies than for nonmanufacturing companies, the absolute number of companies reporting innovation is larger in nonmanufacturing industries. In 2017–19, 34% of the companies classified in manufacturing industries reported any kind of innovation, compared with 25% of companies classified in nonmanufacturing industries. Sixteen percent of manufacturing companies reported product innovations, compared with 11% of nonmanufacturing companies. For business process innovation, 29% of manufacturing industries and 21% of nonmanufacturing industries reported this type of innovation.
Company Ownership by Sex, Race, and Ethnicity
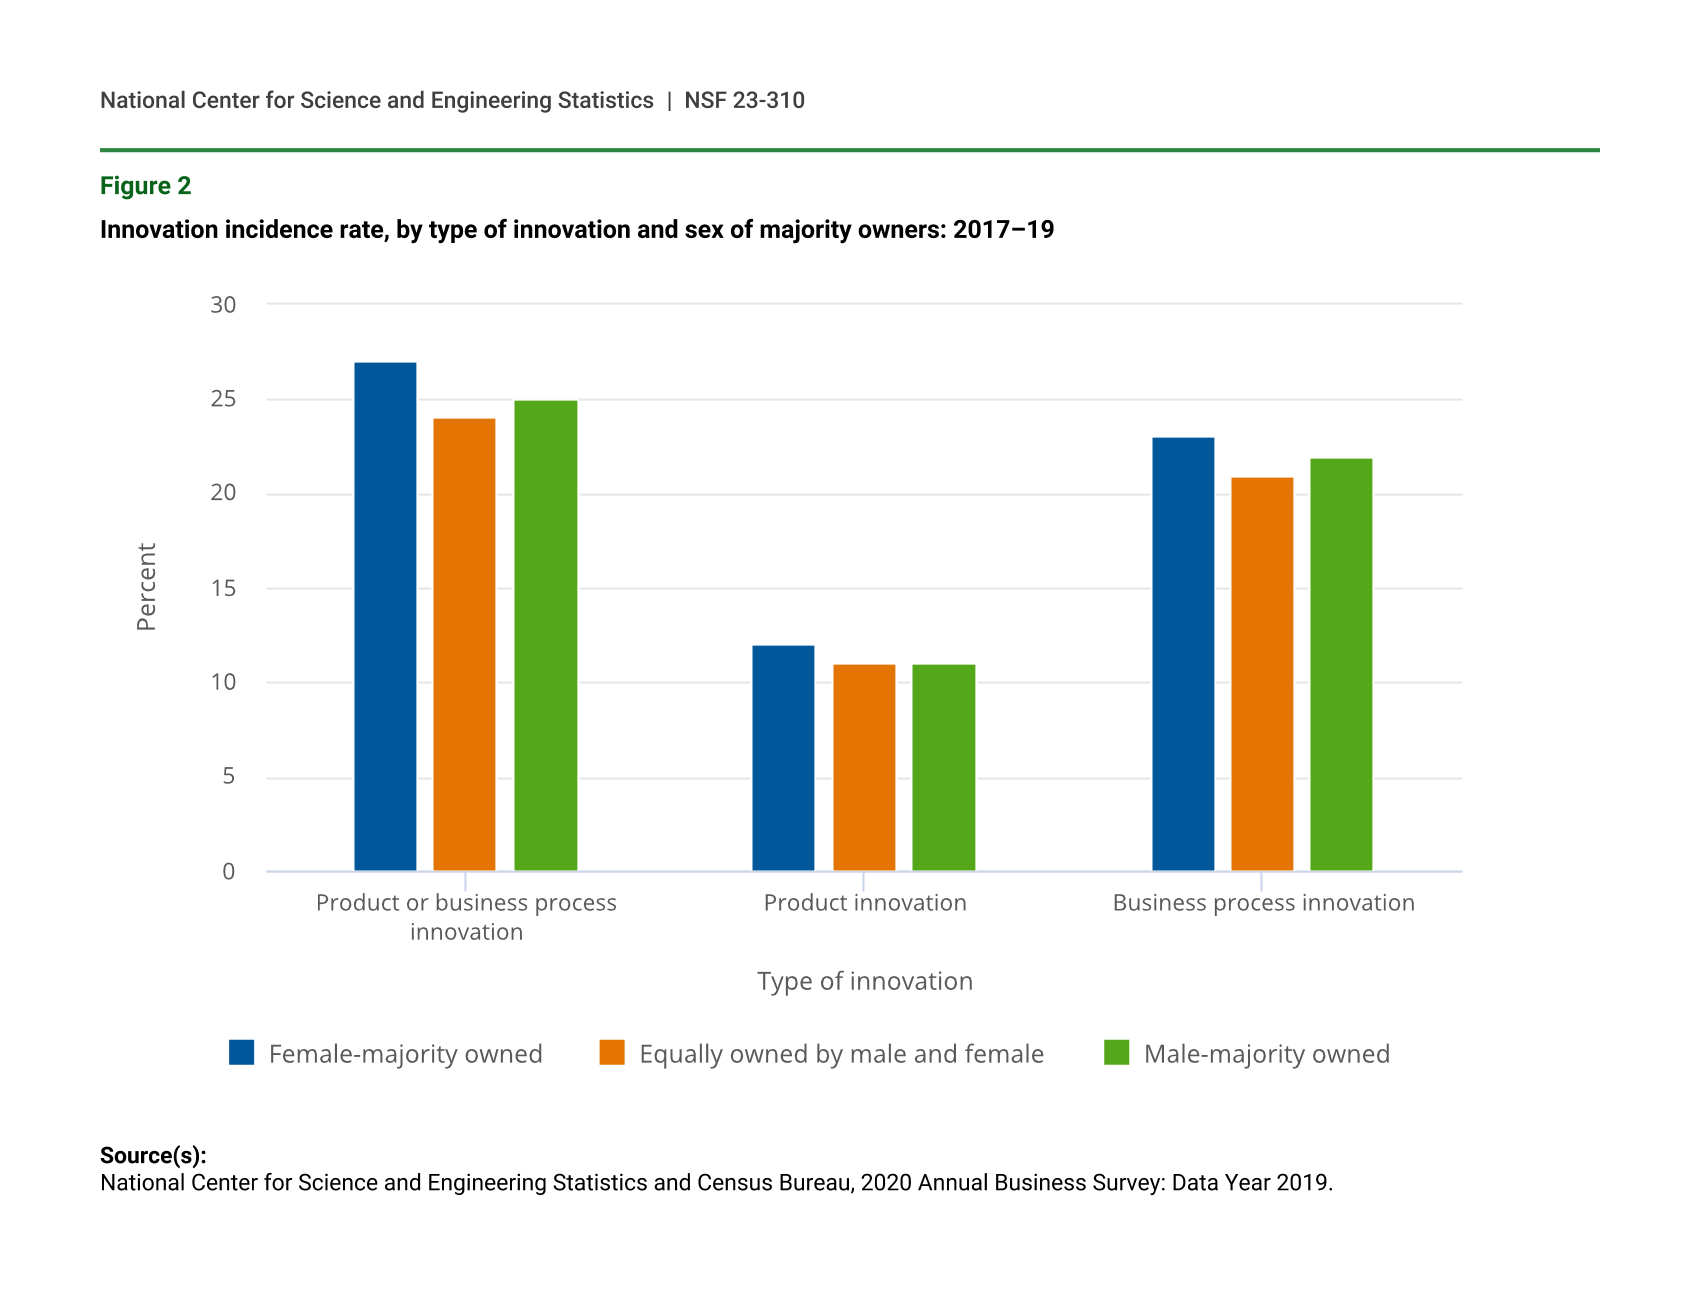
There were no significant differences in innovation incidence between female- and male-majority–owned companies. A nearly identical proportion of female-majority–owned companies and male-majority–owned companies were product innovators (12% versus 11%) or process innovators (22% versus 23%) (figure 2).
Innovation incidence rate, by type of innovation and sex of majority owners: 2017–19
| Type of innovation | Female-majority owned | Equally owned by male and female | Male-majority owned |
|---|---|---|---|
| Product or business process innovation | 27 | 24 | 25 |
| Product innovation | 12 | 11 | 11 |
| Business process innovation | 23 | 21 | 22 |
Source(s):
National Center for Science and Engineering Statistics and Census Bureau, 2020 Annual Business Survey: Data Year 2019.
However, the differences in innovation rates with respect to the race and ethnicity of the company’s owners are statistically significant. Thirteen percent of companies that were primarily owned by minority owners (any racial or ethnic combination other than White, not Hispanic) and 10% that were primarily owned by nonminority owners (White, not Hispanic) were product innovators. Over a quarter (26%) of companies that were primarily owned by minority owners and a fifth (21%) that were primarily owned by nonminority owners were business process innovators (figure 3).
Companies with product or business process innovation, by firm classification of race and ethnicity of majority owners: 2017–19
| Race and ethnicity of owner | Product or business process innovation | Product innovation | Business process innovation |
|---|---|---|---|
| Minority | 30.3 | 13.4 | 26.3 |
| Underrepresented minority | 30.4 | 12.9 | 26.6 |
| Equally minority and nonminority | 30.3 | 15.3 | 24.9 |
| Nonminority | 24.0 | 10.2 | 20.5 |
Note(s):
Companies may be included in one or more race and ethnicity categories. Companies classified as minority are those companies classified as any race and ethnicity combination other than White, not Hispanic. Underrepresented minority groups include Hispanic or Latino, Black or African Americans, and American Indian or Alaska Native.
Source(s):
National Center for Science and Engineering Statistics and Census Bureau, 2020 Annual Business Survey: Data Year 2019.
By State
For the most part, there were only small differences in the percentage of companies that reported innovation among the fifty states and the District of Columbia. Nineteen states and the District of Columbia were estimated to have 25% or more of the companies reporting innovation, whereas only four states had 20% or less of companies reporting innovation (table 6). Examining product innovation among companies, only Hawaii had 13% or more of companies reporting innovation, and seven states and the District of Columbia showed 12% reported innovation. For business process innovation, only Rhode Island and Delaware had more than 25% of companies reporting innovation, and California had at least 24% reporting innovation.
Companies with product or business process innovation, by state: 2017–19
NAICS = 2017 North American Industry Classification System.
Note(s):
Detail may not add to total because of rounding. State is based on the physical location of the business (or the mailing address if the physical location is missing). Firms with establishments operating in more than one state are tabulated as undistributed and counted only once in state and national totals.
Source(s):
National Center for Science and Engineering Statistics and Census Bureau, 2020 Annual Business Survey: Data Year 2019.
Product Innovating Companies and Partners
Seventy percent of product innovating companies indicated that they had at least one partner. Three-quarters (75%) of manufacturing companies and 69% of nonmanufacturing companies indicated they had innovation partners (table 7).
Product innovating companies and partners, by company size: 2017–19
na = not applicable; r = relative standard error > 50%.
Note(s):
Detail may not add to total because of rounding. Statistics are representative of companies located in the United States.
Source(s):
National Center for Science and Engineering Statistics and Census Bureau, 2020 Annual Business Survey: Data Year 2019.
Companies were also asked to characterize their innovation partners. The most frequently noted partners were suppliers and customers (estimated at 41% and 40%, respectively). This is followed by other businesses (31%), not including parent or affiliated or subsidiary businesses, and households and individuals (18%).
Although most industries have a similar distribution with respect to innovation partners, some differences are worth highlighting. Among the scientific research and development services industry (North American Industry Classification System [NAICS] code 5417), 85% of companies cited an innovation partner. Only 6% of all companies cited universities or colleges as innovation partners, whereas 35% of the scientific research and development services industry companies cited universities or colleges as innovation partners.
Larger companies reported greater incidences of partnering. Approximately four out of five (82%) companies with 250 or more employees reported at least one partner (table 7). Companies reported greater incidences of partners residing in the United States than in other countries regardless of company size.
Barriers to Innovation
Businesses were asked about 11 potential barriers to innovation. The lack of partners and lack of access to external knowledge were cited as being very discouraging by 73% of businesses. These barriers were followed by difficulties in obtaining government grants or subsidies (72%) and lack of credit or private equity (69%). Uncertain market demand for ideas and different priorities within this business were each cited by 67% of businesses as being very discouraging (table 8).
Companies reporting barriers of innovation: 2017–19
Note(s):
Detail may not add to total because of rounding. Statistics are representative of companies located in the United States.
Source(s):
National Center for Science and Engineering Statistics and Census Bureau, 2020 Annual Business Survey: Data Year 2019.
Innovation and Government Aid
Although some businesses do partner with governments on innovation, few businesses use government programs to aid in innovation activities. Overall, 4% of companies use tax incentives or tax credit programs to aid in innovation activities, whereas only 1% each use grants and contribution programs, training and hiring programs, procurement, or other government programs.
Survey Information and Data Availability
The ABS is a sample survey, designed to collect a wide range of data on business R&D, intellectual property, company and primary owner characteristics, and innovation activities in the United States. The ABS was developed and is cosponsored by the National Center for Science and Engineering Statistics within the National Science Foundation and by the Census Bureau. The statistics from the survey are based on a sample, and as such, they are subject to both sampling and nonsampling errors (see the Technical Notes in the data tables report Annual Business Survey: 2020 (Data Year 2019) that are available at https://ncses.nsf.gov/pubs/nsf22344/).
For the 2020 ABS, a total of 300,000 employer companies were sampled to represent the population of 4.9 million employer companies. For the 2020 ABS, the unit response rate was 71.7%.
The full set of data tables on innovation, R&D, company demographics, technology, and patent and intellectual property protection from this survey are available in the report Annual Business Survey: 2020 (Data Year 2019) (https://ncses.nsf.gov/pubs/nsf22344/). Individual data tables and tables with relative standard errors and imputation rates from the 2020 survey are available in advance of the full report.
The estimates in this InfoBrief are based on responses from a sample of the population and may differ from actual values because of sampling variability or other factors. As a result, apparent differences between the estimates for two or more groups may not be statistically significant. All comparative statements in this InfoBrief have undergone statistical testing and are significant at the 90% confidence level unless otherwise noted. The ABS used the extended delete-a-group jackknife variance estimator.
Notes
1Organisation for Economic Co-operation and Development (OECD) and Statistical Office of the European Communities (Eurostat). 2018. Oslo Manual: Guidelines for Collecting and Interpreting Innovation Data, 4th edition, Paris.
2Kindlon AE, Jankowski J; National Center for Science and Engineering Statistics (NCSES). 2022. Innovation Data from the 2019 Annual Business Survey. NSF 22-325. Alexandria, VA: National Science Foundation. Available at https://ncses.nsf.gov/pubs/nsf22325/.
3Only 10 states were statistically significantly over 25%, and no states were statistically significantly below 20%. The data in the text does not include sampling variability.
Suggested Citation
Kindlon A; National Center for Science and Engineering Statistics (NCSES). 2022. Innovation Data from the 2020 Annual Business Survey. NSF 23-310. Alexandria, VA: National Science Foundation. Available at https://ncses.nsf.gov/pubs/nsf23310.
Contact Us
NCSES
National Center for Science and Engineering Statistics
Directorate for Social, Behavioral and Economic Sciences
National Science Foundation
2415 Eisenhower Avenue, Suite W14200
Alexandria, VA 22314
Tel: (703) 292-8780
FIRS: (800) 877-8339
TDD: (800) 281-8749
E-mail: ncsesweb@nsf.gov
NSF 23-310
|December 28, 2022