 An official website of the United States government

Geographic Distribution of Nonprofit R&D Performance in FY 2020
About 80% of U.S. nonprofit organizations’ estimated FY 2020 research and development (R&D) performance was accounted for by nine states and the District of Columbia in FY 2020. Nonprofit R&D was more concentrated geographically than the R&D of for-profit businesses and institutions of higher education in 2020 (figure 1). Data in this InfoBrief are from the Nonprofit Research Activities (NPRA) FY 2020 module of the 2021 Annual Business Survey, conducted by the Census Bureau for the National Center for Science and Engineering Statistics (NCSES) within the National Science Foundation. Although most higher education institutions are nonprofits, their R&D activities are tracked separately by NCSES’s Higher Education R&D (HERD) Survey. Unless explicitly noted, the R&D performance of institutions of higher education—including university-owned research hospitals—are not included in the estimates of nonprofit R&D discussed in this InfoBrief. These organizations are analyzed alongside other nonprofits at the end of this report.
Nonprofits’ Role in the U.S. Economy
Nonprofit organizations employed almost 17 million people in the United States in 2020, about one-seventh as many as for-profit companies employed. Most nonprofit employment is in the health care and social assistance (North American Industry Classification System [NAICS] 62) and educational services (NAICS 61) sectors, which together account for 70% of all nonprofit employment. Nonprofits account for a small share of employment in most industries, but they account for about two-thirds of employment in hospitals (NAICS 622). Nonprofits also employ more workers than for-profit businesses in the educational services sector.
In 2020, nonprofit organizations performed $28 billion of R&D in the United States, compared with $86 billion performed by institutions of higher education and $538 billion performed by for-profit businesses.
State concentration of R&D performance, by sector: 2020
| Sector | State with most R&D performed in sector | 2nd and 3rd largest state performers | 4th–10th largest state performers | All other state performers |
|---|---|---|---|---|
| Nonprofit organizations | 19.0 | 26.6 | 33.6 | 20.8 |
| For-profit businesses | 35.9 | 13.8 | 25.3 | 25.0 |
| Higher education institutions | 12.6 | 16.0 | 29.8 | 41.6 |
Note(s):
Estimates for nonprofit organizations exclude nonprofit universities and colleges and federally funded research and development centers administered by nonprofit organizations. Total R&D performance in 2020 was $28.0 billion for nonprofit organizations, $537.6 billion for for-profit businesses, and $86.2 billion for higher education institutions.
Data for higher education institutions have not been adjusted to eliminate the double counting of funds passed through from an academic institution to subrecipients (other academic institutions, businesses, nonprofit organizations, and others). At the national level, funds passed through to such subrecipients accounted for 8% of total R&D expenditures reported by higher education institutions in FY 2020.
Source(s):
National Center for Science and Engineering Statistics and Census Bureau, Nonprofit Research Activities FY 2020 module of the 2021 Annual Business Survey; Business Enterprise Research and Development Survey, 2020; Higher Education Research and Development Survey, 2020.
State Concentration of Nonprofit R&D
Nonprofit organizations performed more R&D in Massachusetts in FY 2020 than in any other state or the District of Columbia, primarily due to health care–related organizations, such as research hospitals (table 1). California, the state with the largest amount of business R&D (accounting for 36% of for-profit business R&D in the United States), accounted for about 13% of U.S. nonprofit R&D during FY 2020.
R&D expenditures at nonprofit organizations, by selected state and type of organization: ranked by FY 2020 total expenditures
r = relative standard error is more than 50%; i = more than 50% of the estimate is a combination of imputation and reweighting to account for nonresponse.
Note(s):
These data exclude nonprofit universities and colleges and federally funded research and development centers administered by nonprofit organizations. Organizations are assigned to states based on their mailing address. States were selected for this table based on large amounts of estimated R&D performed by nonprofit organizations. Rankings are based on point estimates and do not consider the variance of the survey sample. Detail may not add to total because of rounding.
Source(s):
National Center for Science and Engineering Statistics and Census Bureau, Nonprofit Research Activities FY 2020 module of the 2021 Annual Business Survey.
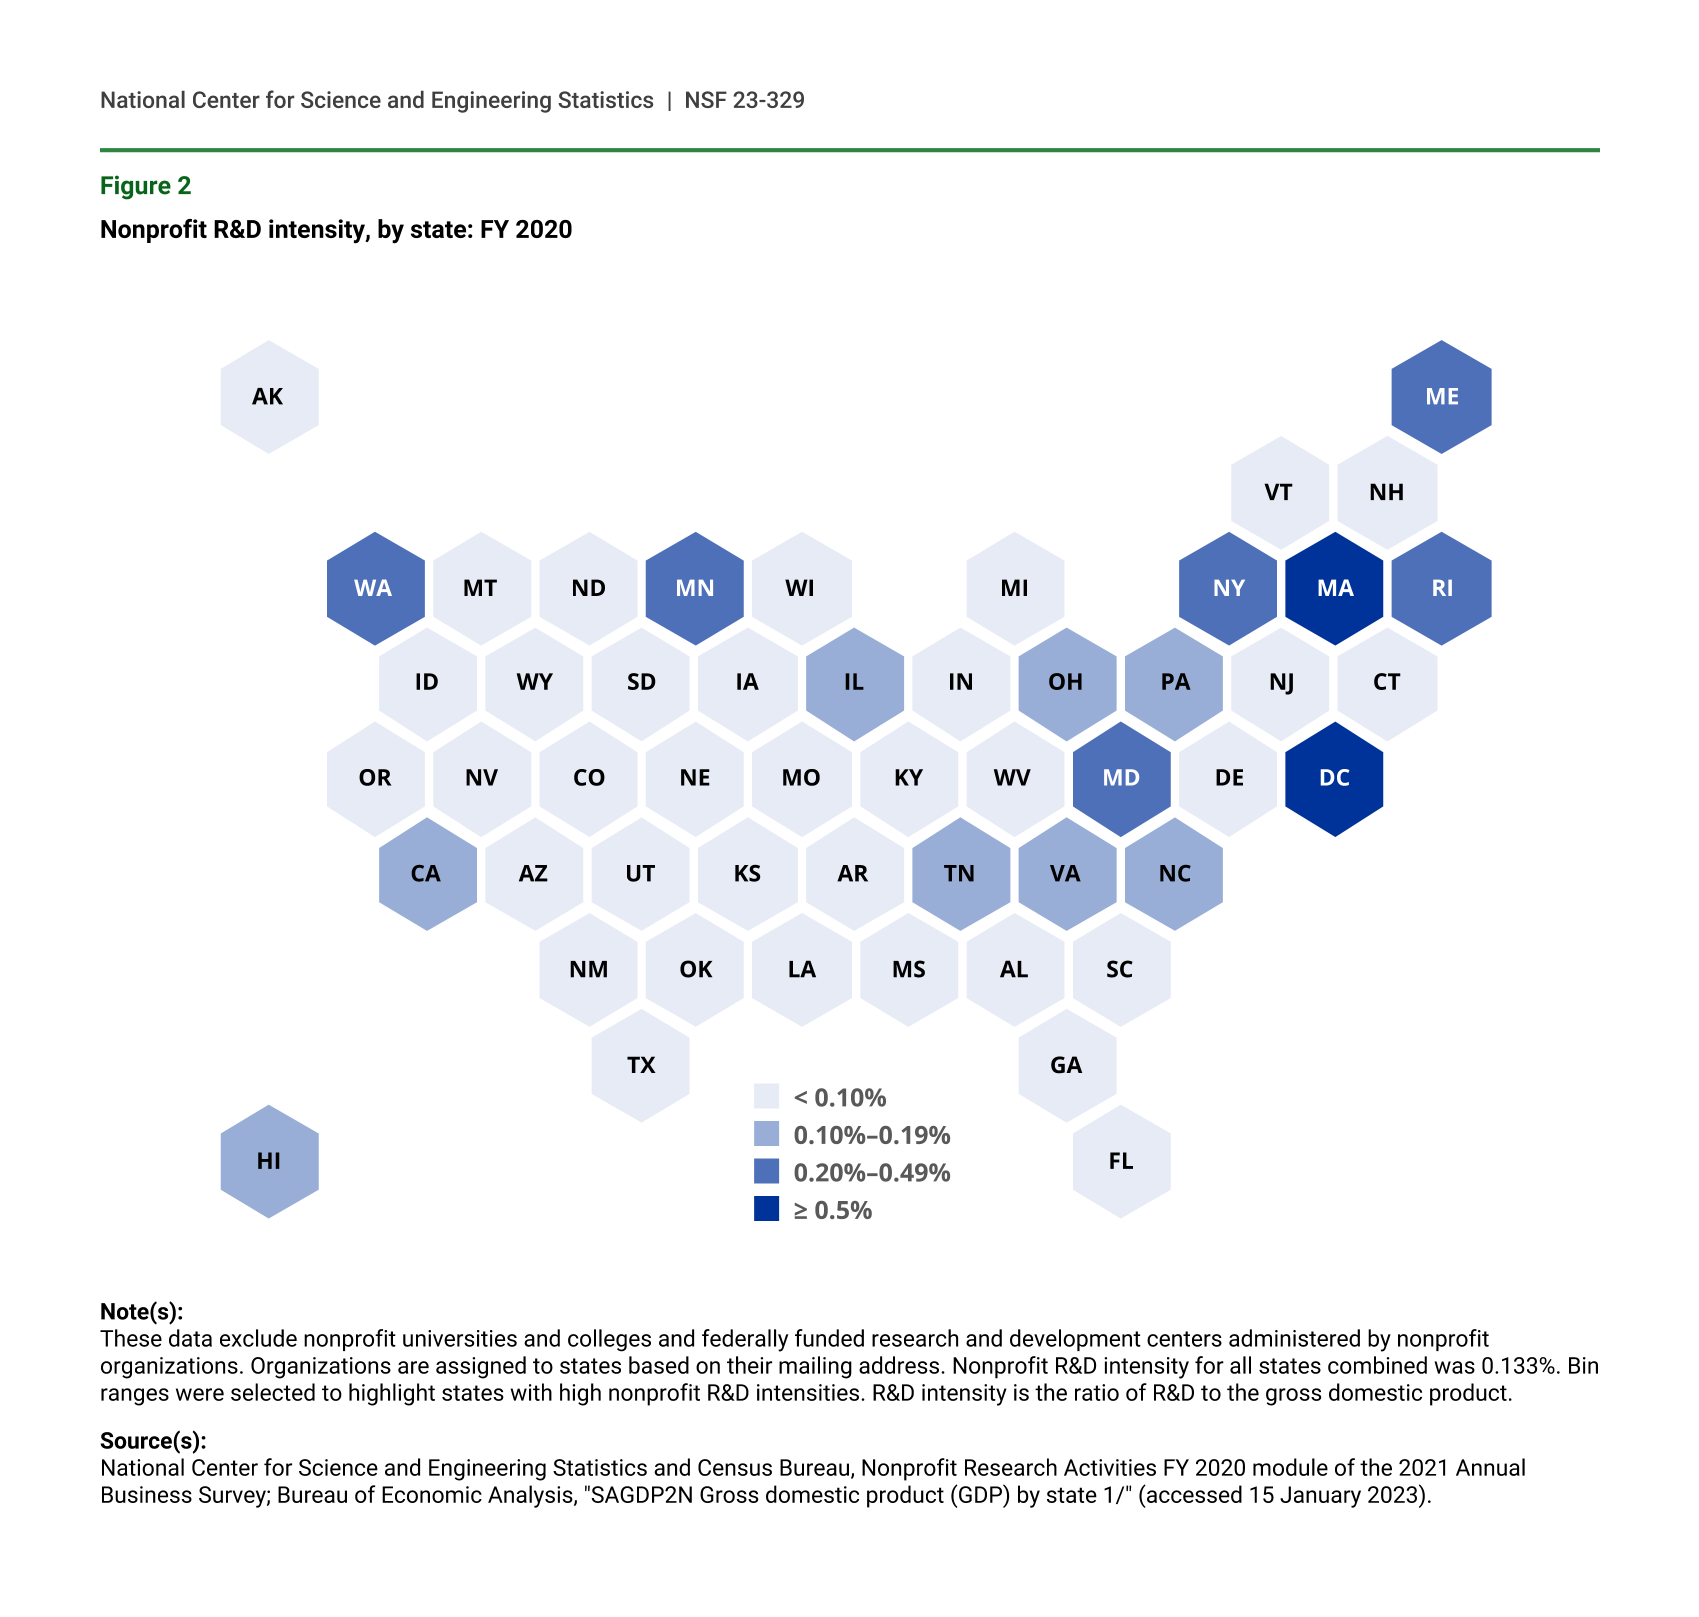
A notable inclusion in the list of locations with the most nonprofit R&D is the District of Columbia, which has a very high R&D intensity—ratio of R&D to the gross domestic product (GDP)—among nonprofits (figure 2). The District of Columbia’s nonprofit R&D was performed largely by organizations classified in non-health-care–related industries such as science and technology institutes and professional organizations.
Figure 2 shows a cartogram of the nonprofit R&D intensity for each state. The District of Columbia and Massachusetts have the highest values on this indicator, with R&D intensities about eight and seven times greater, respectively, than the United States as a whole. Maryland, Minnesota, and Rhode Island were the only other states with nonprofit R&D intensities greater than twice that of the U.S. total in FY 2020.
Nonprofit R&D intensity, by state: FY 2020
| State | R&D intensity |
|---|---|
| Alabama | 0.052 |
| Alaska | 0.034 |
| Arizona | 0.029 |
| Arkansas | 0.049 |
| California | 0.123 |
| Colorado | 0.038 |
| Connecticut | 0.052 |
| Delaware | 0.000 |
| District of Columbia | 1.087 |
| Florida | 0.041 |
| Georgia | 0.013 |
| Hawaii | 0.145 |
| Idaho | 0.012 |
| Illinois | 0.117 |
| Indiana | 0.006 |
| Iowa | 0.000 |
| Kansas | 0.007 |
| Kentucky | 0.001 |
| Louisiana | 0.024 |
| Maine | 0.243 |
| Maryland | 0.395 |
| Massachusetts | 0.907 |
| Michigan | 0.063 |
| Minnesota | 0.352 |
| Mississippi | 0.011 |
| Missouri | 0.045 |
| Montana | 0.009 |
| Nebraska | 0.019 |
| Nevada | 0.003 |
| New Hampshire | 0.033 |
| New Jersey | 0.007 |
| New Mexico | 0.098 |
| New York | 0.215 |
| North Carolina | 0.157 |
| North Dakota | 0.060 |
| Ohio | 0.181 |
| Oklahoma | 0.047 |
| Oregon | 0.026 |
| Pennsylvania | 0.111 |
| Rhode Island | 0.310 |
| South Carolina | 0.003 |
| South Dakota | 0.001 |
| Tennessee | 0.145 |
| Texas | 0.060 |
| Utah | 0.016 |
| Vermont | 0.019 |
| Virginia | 0.119 |
| Washington | 0.257 |
| West Virginia | 0.066 |
| Wisconsin | 0.031 |
| Wyoming | 0.001 |
Note(s):
These data exclude nonprofit universities and colleges and federally funded research and development centers administered by nonprofit organizations. Organizations are assigned to states based on their mailing address. Nonprofit R&D intensity for all states combined was 0.133%. Bin ranges were selected to highlight states with high nonprofit R&D intensities. R&D intensity is the ratio of R&D to the gross domestic product.
Source(s):
National Center for Science and Engineering Statistics and Census Bureau, Nonprofit Research Activities FY 2020 module of the 2021 Annual Business Survey; Bureau of Economic Analysis, "SAGDP2N Gross domestic product (GDP) by state 1/" (accessed 15 January 2023).
Nonprofit Organizations and Higher Education Institutions
As noted at the beginning of this InfoBrief, nonprofit higher education institutions including university-owned research hospitals are surveyed by NCSES separately from other nonprofits. However, the R&D of these two groups of nonprofit organizations (higher education institutions measured by the HERD Survey and other nonprofits measured by NPRA) can be combined to produce an estimate of the R&D performance of all nonprofit organizations in the United States. This combined estimate amounts to $114 billion of R&D performance in FY 2020, or about one-fifth of the R&D performed by for-profit businesses in the United States. When estimates from NPRA and the HERD Survey are combined, California becomes the state with the largest combined nonprofit R&D estimate (table 2). Eight of the top 10 states based on this combined measure are also in the top 10 discussed earlier using NPRA estimates alone, but North Carolina and Pennsylvania move up to replace the District of Columbia and Minnesota.
R&D expenditures at nonprofit organizations and higher education institutions, by state: ranked by FY 2020 total expenditures
Note(s):
Data for nonprofit organizations exclude nonprofit universities and colleges and federally funded research and development centers administered by nonprofit organizations. Organizations are assigned to states based on their mailing address. Rankings are based on point estimates and do not consider the variance of the survey sample.
Data for higher education institutions have not been adjusted to eliminate the double counting of funds passed through from an academic institution to subrecipients (other academic institutions, businesses, nonprofit organizations, and others). At the national level, funds passed through to such subrecipients accounted for 8% of total R&D expenditures reported by higher education institutions in FY 2020.
Source(s):
National Center for Science and Engineering Statistics and Census Bureau, Nonprofit Research Activities FY 2020 module of the 2021 Annual Business Survey; Higher Education Research and Development Survey, FY 2020.
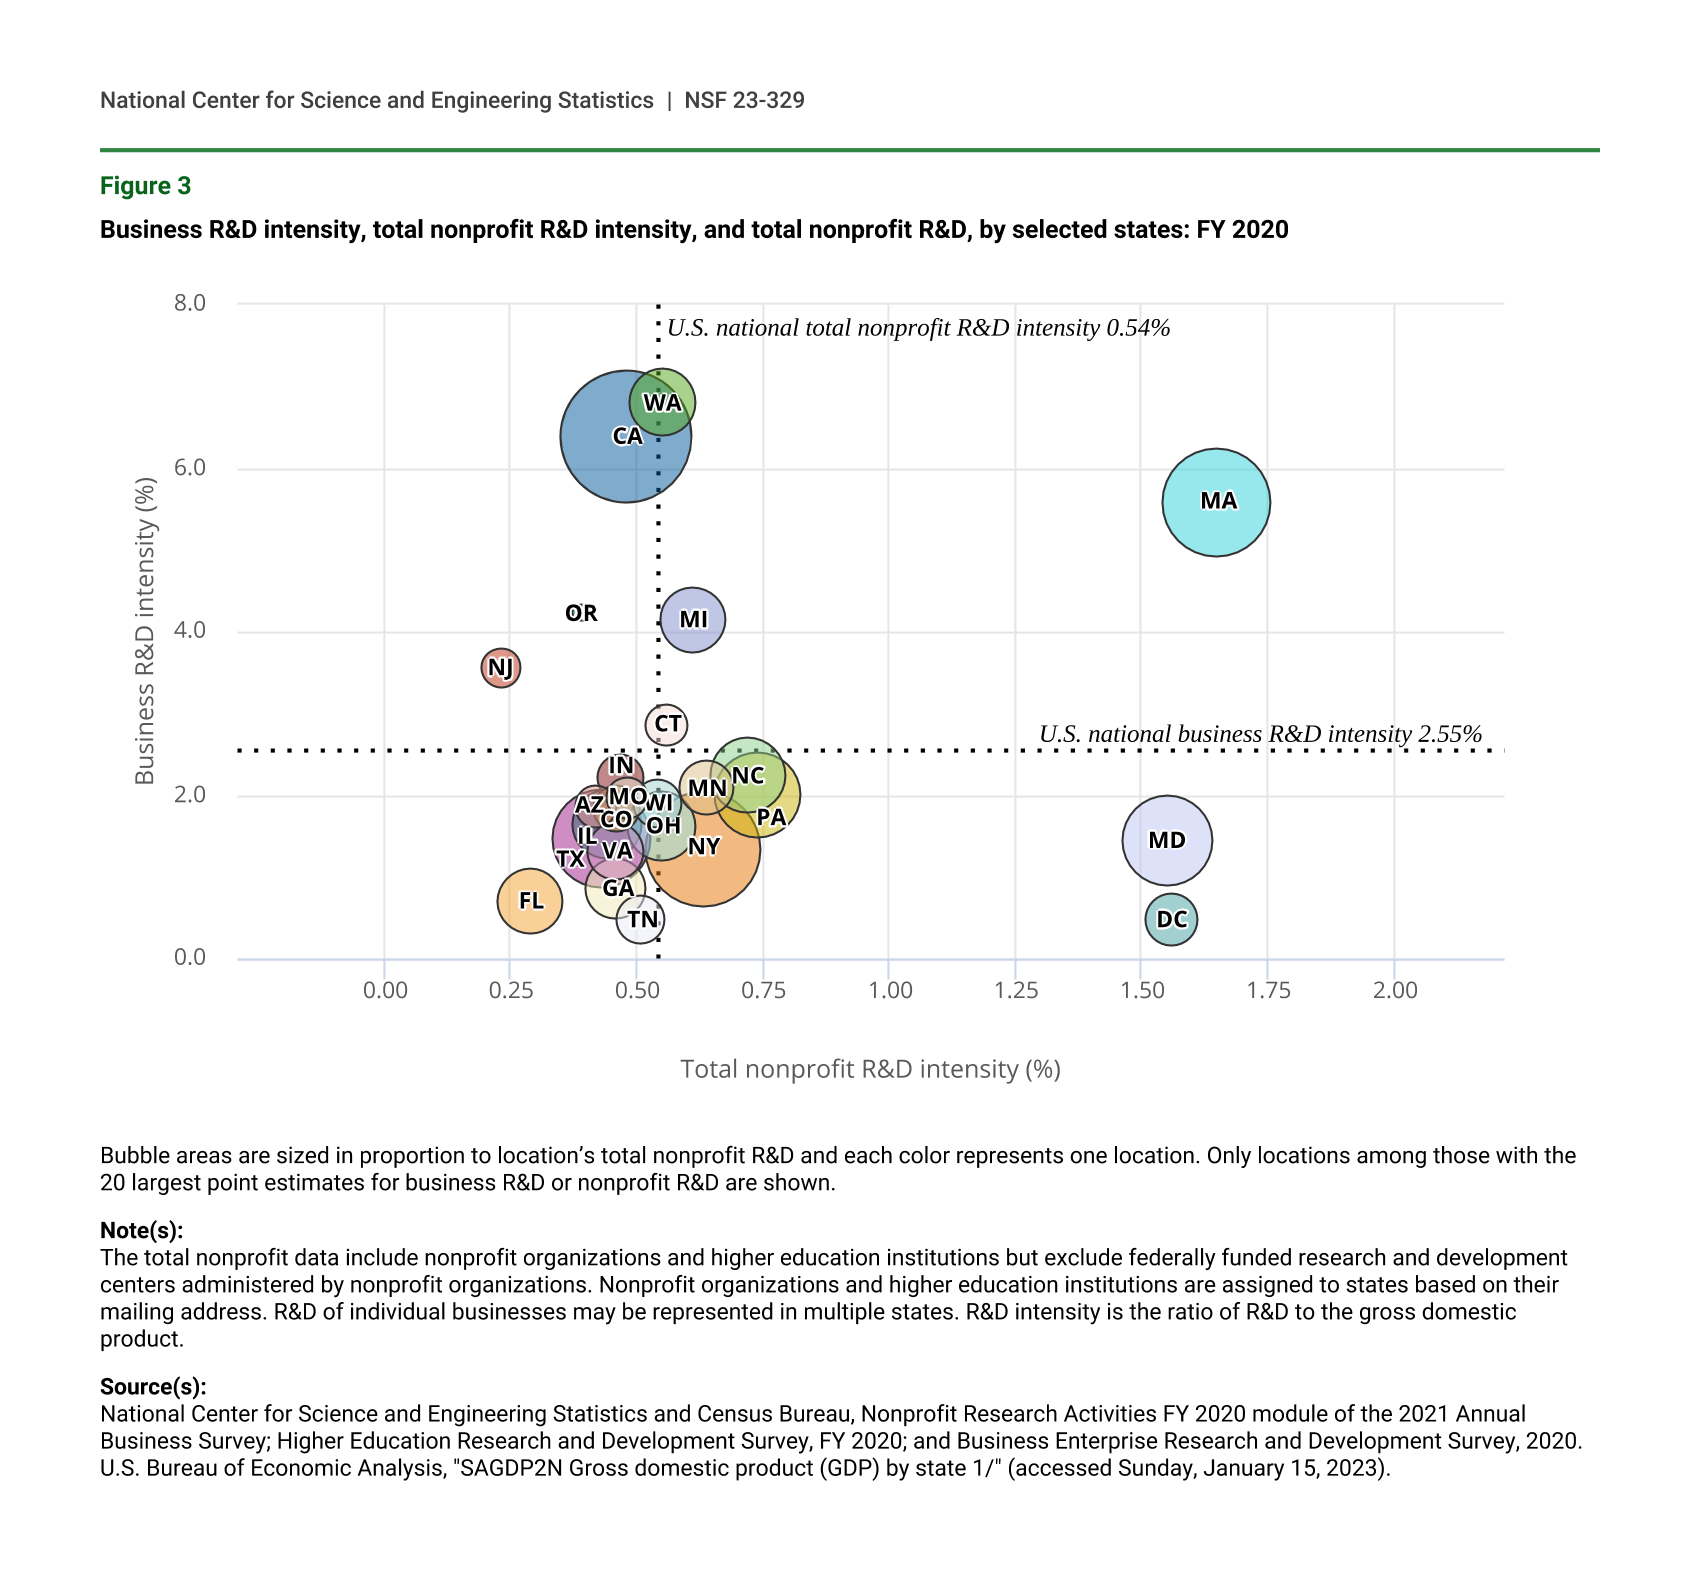
Although the District of Columbia is not among the 10 largest locations for combined nonprofit R&D, it remains in the top 3 in terms of combined nonprofit R&D intensity (figure 3). Figure 3 uses a bubble chart to show the combined nonprofit R&D intensity (x-axis), business (for profit) R&D intensity (y-axis), and relative amount of combined nonprofit R&D (size of bubble) for a subset of states. Massachusetts, the District of Columbia, and Maryland each have more nonprofit R&D relative to the size of their economies than other states or the nation as a whole. Massachusetts also stands out in terms of business R&D intensity, with a business R&D-to-GDP ratio close to twice that of the United States as a whole. California, Washington, and Michigan each have high business R&D intensities compared to that of the nation as a whole, but they are not apparent outliers in terms of nonprofit R&D intensity.
Business R&D intensity, total nonprofit R&D intensity, and total nonprofit R&D, by selected states: FY 2020
| State | Business R&D intensity (%) | Total nonprofit R&D intensity (%) | Total nonprofit R&D ($ millions) |
|---|---|---|---|
| California | 6.39 | 0.48 | 14,618 |
| New York | 1.35 | 0.63 | 10,892 |
| Washington | 6.79 | 0.55 | 3,400 |
| Massachusetts | 5.59 | 1.65 | 9,671 |
| Texas | 1.46 | 0.43 | 7,685 |
| Maryland | 1.44 | 1.55 | 6,369 |
| New Jersey | 3.55 | 0.23 | 1,432 |
| Pennsylvania | 2.00 | 0.74 | 5,675 |
| Michigan | 4.15 | 0.61 | 3,194 |
| North Carolina | 2.23 | 0.72 | 4,328 |
| Illinois | 1.65 | 0.44 | 3,766 |
| Ohio | 1.61 | 0.55 | 3,755 |
| Florida | 0.71 | 0.29 | 3,184 |
| Oregon | 4.22 | 0.39 | 960 |
| Georgia | 0.86 | 0.46 | 2,865 |
| Indiana | 2.22 | 0.47 | 1,755 |
| Connecticut | 2.86 | 0.56 | 1,543 |
| Virginia | 1.30 | 0.46 | 2,582 |
| Minnesota | 2.08 | 0.64 | 2,414 |
| District of Columbia | 0.46 | 1.56 | 2,258 |
| Tennessee | 0.48 | 0.51 | 1,947 |
| Colorado | 1.83 | 0.46 | 1,814 |
| Wisconsin | 1.89 | 0.54 | 1,854 |
| Arizona | 1.86 | 0.42 | 1,608 |
| Missouri | 1.97 | 0.48 | 1,593 |
Bubble areas are sized in proportion to location’s total nonprofit R&D and each color represents one location. Only locations among those with the 20 largest point estimates for business R&D or nonprofit R&D are shown.
Note(s):
The total nonprofit data include nonprofit organizations and higher education institutions but exclude federally funded research and development centers administered by nonprofit organizations. Nonprofit organizations and higher education institutions are assigned to states based on their mailing address. R&D of individual businesses may be represented in multiple states. R&D intensity is the ratio of R&D to the gross domestic product.
Source(s):
National Center for Science and Engineering Statistics and Census Bureau, Nonprofit Research Activities FY 2020 module of the 2021 Annual Business Survey; Higher Education Research and Development Survey, FY 2020; and Business Enterprise Research and Development Survey, 2020. U.S. Bureau of Economic Analysis, "SAGDP2N Gross domestic product (GDP) by state 1/" (accessed Sunday, January 15, 2023).
Data Source, Limitations, and Availability
The NPRA FY 2020 module of the 2021 Annual Business Survey was conducted in 2021 with a sample of 8,000 nonprofit organizations representing 48,500 total eligible nonprofit organizations in the United States. Higher education institutions and nonprofit-administered federally funded R&D centers (FFRDCs) are not included in this survey, as these populations are already included in NCSES’s HERD and FFRDC R&D Surveys.
FY 2020 expenditures data from the HERD Survey were collected from a census of 915 universities and colleges that grant a bachelor’s degree or higher and expended at least $150,000 in R&D in FY 2019. The sample for the Business Enterprise Research and Development (BERD) Survey was selected to represent all for-profit, nonfarm companies that were publicly or privately held, had 10 or more employees in the United States, and performed or funded R&D either domestically or abroad. For 2020, a total of 47,500 companies were sampled for the BERD Survey, representing 1,140,000 companies.
In this InfoBrief, money amounts are expressed in current U.S. dollars and are not adjusted for inflation. For HERD and NPRA data, FY 2020 represents the FY periods of the reporting institutions and organizations, which ranges from July 2019 to June 2020 to January to December 2020. For BERD data, the year represents January to December 2020 unless the business was unable to report this way and reported for their fiscal year.
The estimates in this InfoBrief are based on responses from samples of different populations of organizations and may differ from actual values because of sampling variability or other factors. As a result, apparent differences between the estimates for two or more groups may not be statistically significant. All comparative statements in this InfoBrief have undergone statistical testing and are significant at the 90% confidence level unless otherwise noted.
Notes
1For reference, 54% of U.S. population was accounted for by the 10 most populous states and 56% of U.S. gross domestic product (GDP) was accounted for by the 10 largest state economies in 2020. For more information, see County Business Patterns, a data product produced using the Census Bureau’s Business Register (https://www.census.gov/programs-surveys/cbp.html) and state population estimates (https://www.census.gov/data/tables/time-series/demo/popest/2020s-state-total.html). GDP data are from the Bureau of Economic Analysis: https://www.bea.gov/data/gdp/gdp-state.
2Nonprofit and for-profit employment data come from County Business Patterns, a data product produced using the Census Bureau’s Business Register: https://data.census.gov/cedsci/table?q=legal%20form%20of%20organization&tid=CBP2020.CB2000CBP.
3See https://ncses.nsf.gov/pubs/nsf23317 (NPRA FY 2020), https://ncses.nsf.gov/pubs/nsf22311 (HERD Survey FY 2020), and https://ncses.nsf.gov/pubs/nsf22343 (BERD Survey 2020) for the source data for these totals.
4The R&D of federally funded R&D centers (FFRDCs) administered by nonprofits are excluded from this estimate as they are typically analyzed alongside federal intramural R&D. Data for these FFRDCs are available from the NCSES FFRDC R&D Survey: https://www.nsf.gov/statistics/srvyffrdc/.
5Rankings are based on point estimates and do not consider the variance of the survey sample.
6Only locations among those with the 20 largest point estimates for business R&D or total nonprofit R&D are shown, resulting in a total of 24 states and the District of Columbia.
7See the technical notes to the FY 2020 data tables at for details on the survey frame and exclusions (https://ncses.nsf.gov/pubs/nsf23317).
Suggested Citation
Britt R, Shackelford B; National Center for Science and Engineering Statistics (NCSES). 2023. Geographic Distribution of Nonprofit R&D Performance in FY 2020. NSF 23-329. Alexandria, VA: National Science Foundation. Available at https://ncses.nsf.gov/pubs/nsf23329.
Contact Us
NCSES
National Center for Science and Engineering Statistics
Directorate for Social, Behavioral and Economic Sciences
National Science Foundation
2415 Eisenhower Avenue, Suite W14200
Alexandria, VA 22314
Tel: (703) 292-8780
FIRS: (800) 877-8339
TDD: (800) 281-8749
E-mail: ncsesweb@nsf.gov
NSF 23-329
|May 9, 2023