 An official website of the United States government

State Government Agencies’ Expenditures for R&D Totaled $2.6 Billion in FY 2022, an Increase of 5% from FY 2021
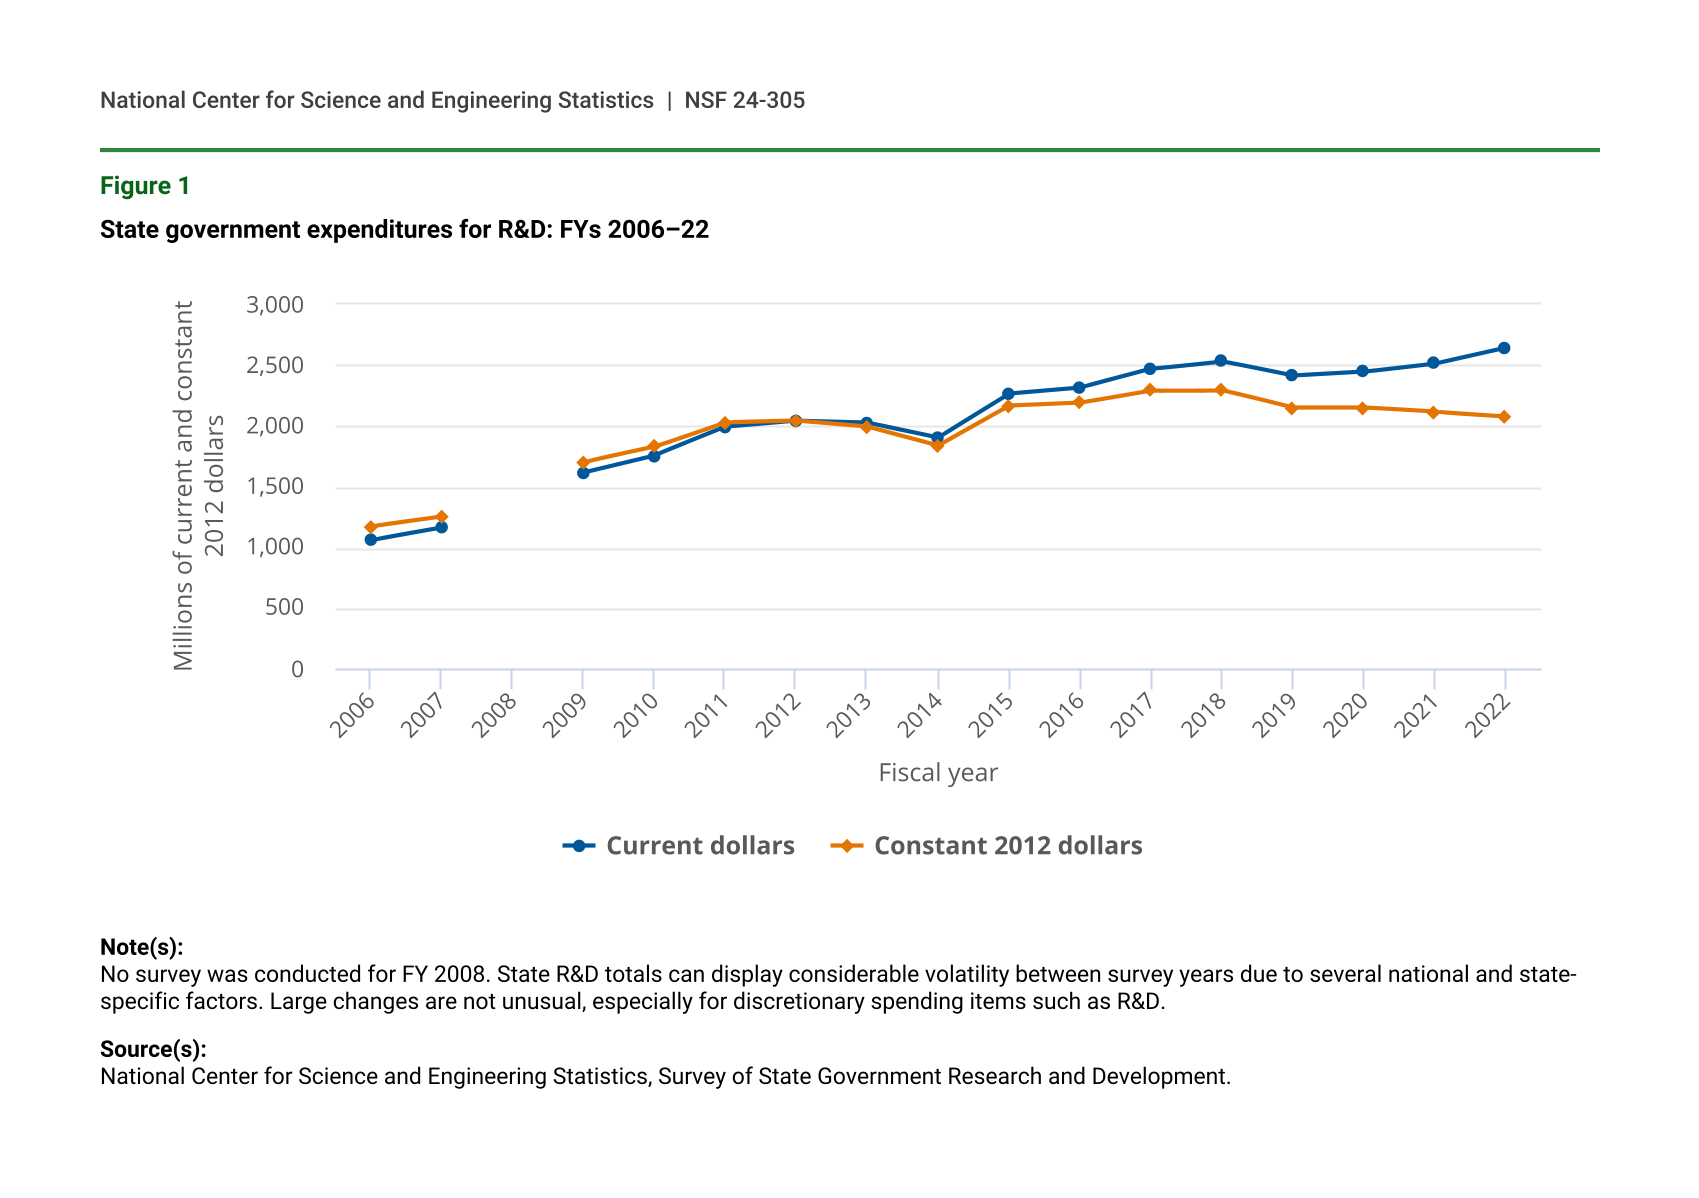
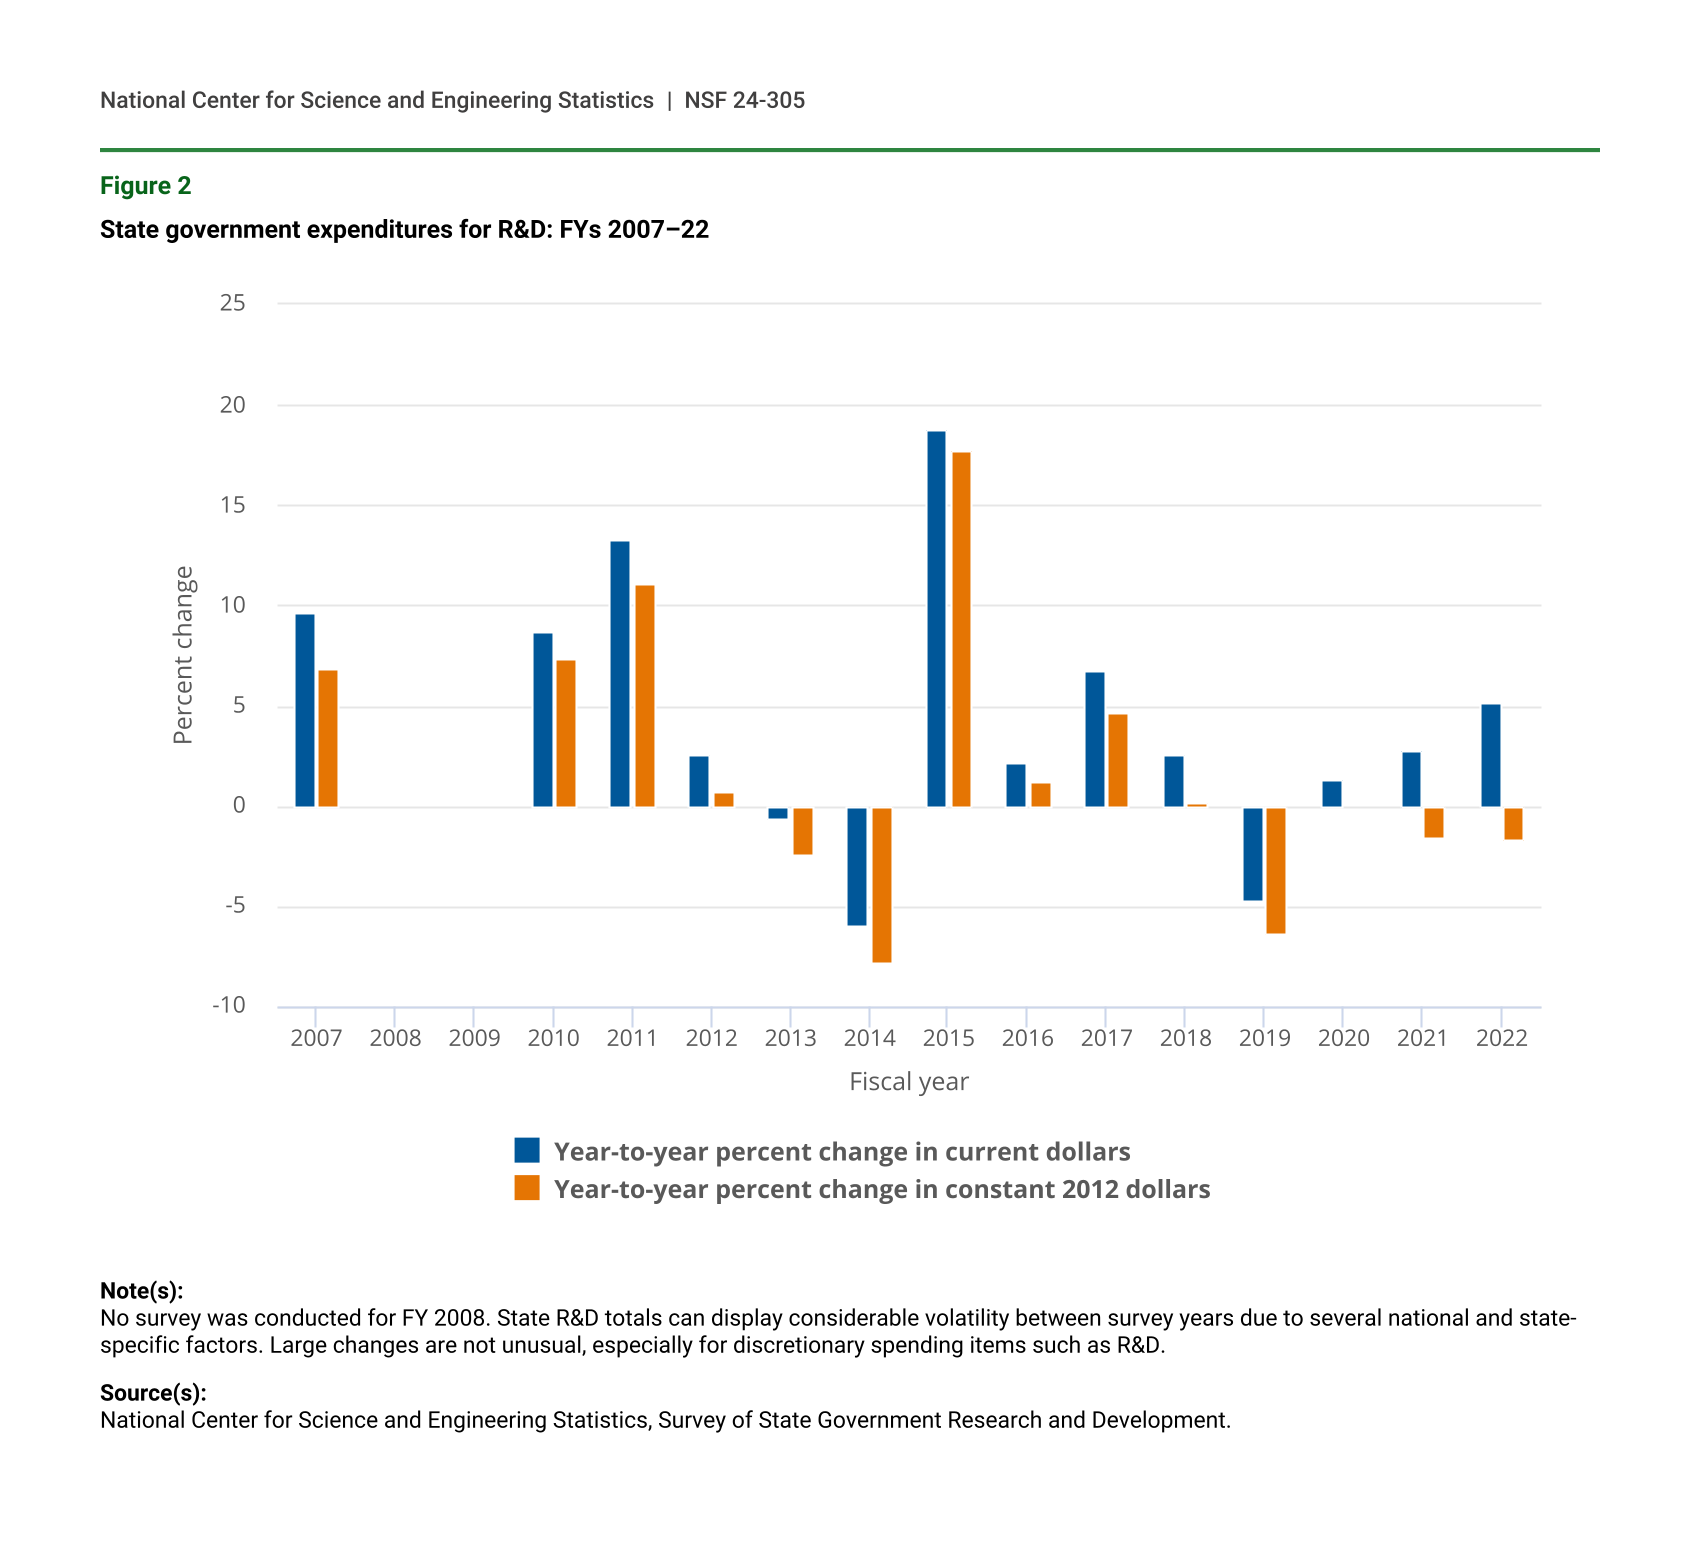
In FY 2022, state government agencies’ expenditures on research and experimental development (R&D) were $2.644 billion, an increase of 5.2% from FY 2021 expenditures of $2.513 billion (figure 1 and figure 2). However, when adjusted for inflation, state government agency R&D expenditures totaled $2.078 billion in FY 2022, a decrease of 1.7% from the FY 2021 adjusted amount of $2.114 billion and lower than the FY 2015 adjusted amount of $2.164 billion.
This InfoBrief presents summary statistics from the FY 2022 Survey of State Government Research and Development, sponsored by the National Center for Science and Engineering Statistics (NCSES) within the National Science Foundation. Amounts reported do not include direct appropriations from state legislatures to universities, colleges, and private organizations. Data presented in this InfoBrief are in current dollars unless otherwise noted.
State government expenditures for R&D: FYs 2006–22
| Fiscal year | Current dollars | Constant 2012 dollars |
|---|---|---|
| 2006 | 1,059 | 1,174 |
| 2007 | 1,161 | 1,254 |
| 2008 | NA | NA |
| 2009 | 1,616 | 1,701 |
| 2010 | 1,756 | 1,826 |
| 2011 | 1,990 | 2,028 |
| 2012 | 2,042 | 2,042 |
| 2013 | 2,028 | 1,993 |
| 2014 | 1,906 | 1,838 |
| 2015 | 2,265 | 2,164 |
| 2016 | 2,314 | 2,189 |
| 2017 | 2,468 | 2,290 |
| 2018 | 2,531 | 2,294 |
| 2019 | 2,412 | 2,148 |
| 2020 | 2,444 | 2,148 |
| 2021 | 2,513 | 2,114 |
| 2022 | 2,644 | 2,078 |
Note(s):
No survey was conducted for FY 2008. State R&D totals can display considerable volatility between survey years due to several national and state-specific factors. Large changes are not unusual, especially for discretionary spending items such as R&D.
Source(s):
National Center for Science and Engineering Statistics, Survey of State Government Research and Development.
State government expenditures for R&D: FYs 2007–22
| Fiscal year | Year-to-year percent change in current dollars | Year-to-year percent change in constant 2012 dollars |
|---|---|---|
| 2007 | 9.6 | 6.8 |
| 2008 | NA | NA |
| 2009 | NA | NA |
| 2010 | 8.7 | 7.3 |
| 2011 | 13.3 | 11.1 |
| 2012 | 2.6 | 0.7 |
| 2013 | -0.7 | -2.4 |
| 2014 | -6.0 | -7.8 |
| 2015 | 18.8 | 17.7 |
| 2016 | 2.2 | 1.2 |
| 2017 | 6.7 | 4.6 |
| 2018 | 2.6 | 0.2 |
| 2019 | -4.7 | -6.4 |
| 2020 | 1.3 | 0.0 |
| 2021 | 2.8 | -1.6 |
| 2022 | 5.2 | -1.7 |
Note(s):
No survey was conducted for FY 2008. State R&D totals can display considerable volatility between survey years due to several national and state-specific factors. Large changes are not unusual, especially for discretionary spending items such as R&D.
Source(s):
National Center for Science and Engineering Statistics, Survey of State Government Research and Development.
Summary of State Government R&D Totals
State governments’ FY 2022 expenditures for both R&D and R&D plant totaled $2.676 billion (table 1). R&D accounted for 98.8% of these expenditures at $2.644 billion. R&D plant accounted for just $32 million. State governments served as the largest source of funds for agency R&D at $1.953 billion (73.9%), while federal funds accounted for $691 million (26.1%). In FY 2021, expenditures from state government funds accounted for 75.8% and federal funding accounted for 24.2% of all state R&D expenditures.
State government expenditures for R&D and R&D plant: FYs 2021–22
a Intramural performers include employees within the same state department or agency and services performed by others in support of internal R&D projects.
b Includes government functions for corrections, criminal justice, education, forensic sciences, labor, public safety, and social services.
Note(s):
Detail may not add to total because of rounding. R&D plant includes acquisition of land, facilities, major equipment, and major building renovations intended primarily for R&D use.
Source(s):
National Center for Science and Engineering Statistics, Survey of State Government Research and Development.
Of the six functional categories of state agency R&D expenditures, health-related R&D remained the largest with over $1.101 billion in expenditures, increasing 2.2% from FY 2021. Environment and natural resources–related R&D remained the second-largest functional category with $541 million, while energy-related R&D followed with $327 million. Transportation-related R&D totaled $291 million, while agricultural-related R&D totaled $127 million. Other R&D, a combination of activities including but not limited to corrections, criminal justice, education, forensics, labor, public safety, and social services, totaled $257 million in FY 2022.
State Government R&D Performance
Overview
Although state governments are both funders and performers of R&D, the majority (73.7%) of their expenditures support extramural R&D (i.e., performers other than state agencies). Higher education institutions were the primary recipients of these expenditures, receiving 53.0% of all extramural funding, followed by companies and individuals (23.4%). All other extramural performers, including nonprofit organizations or other governments, accounted for 23.6%. Intramural performers of R&D, the state agencies themselves, totaled $697 million in FY 2022, an increase of 3.2% from $675 million in FY 2021.
Intramural R&D Performance
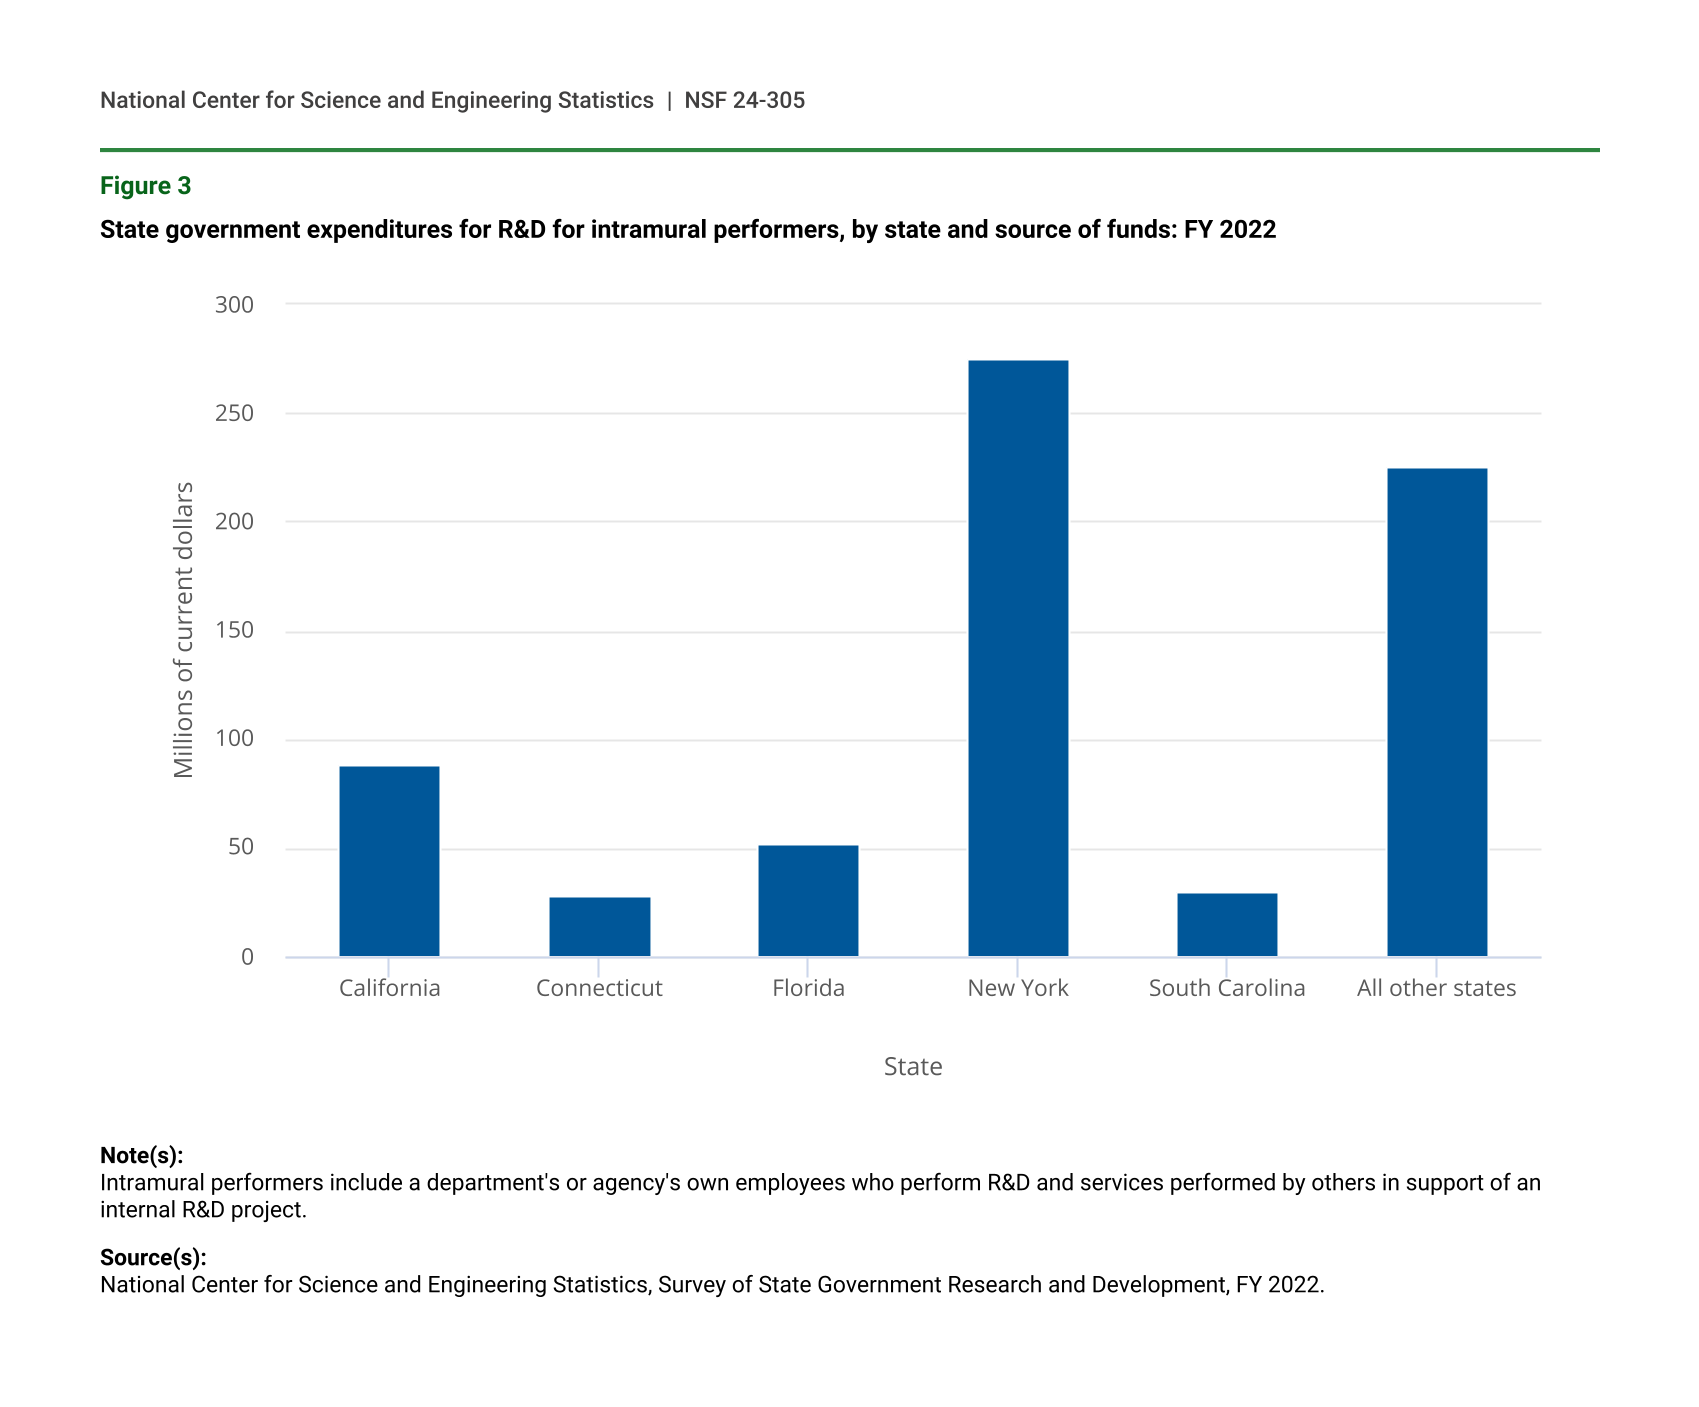
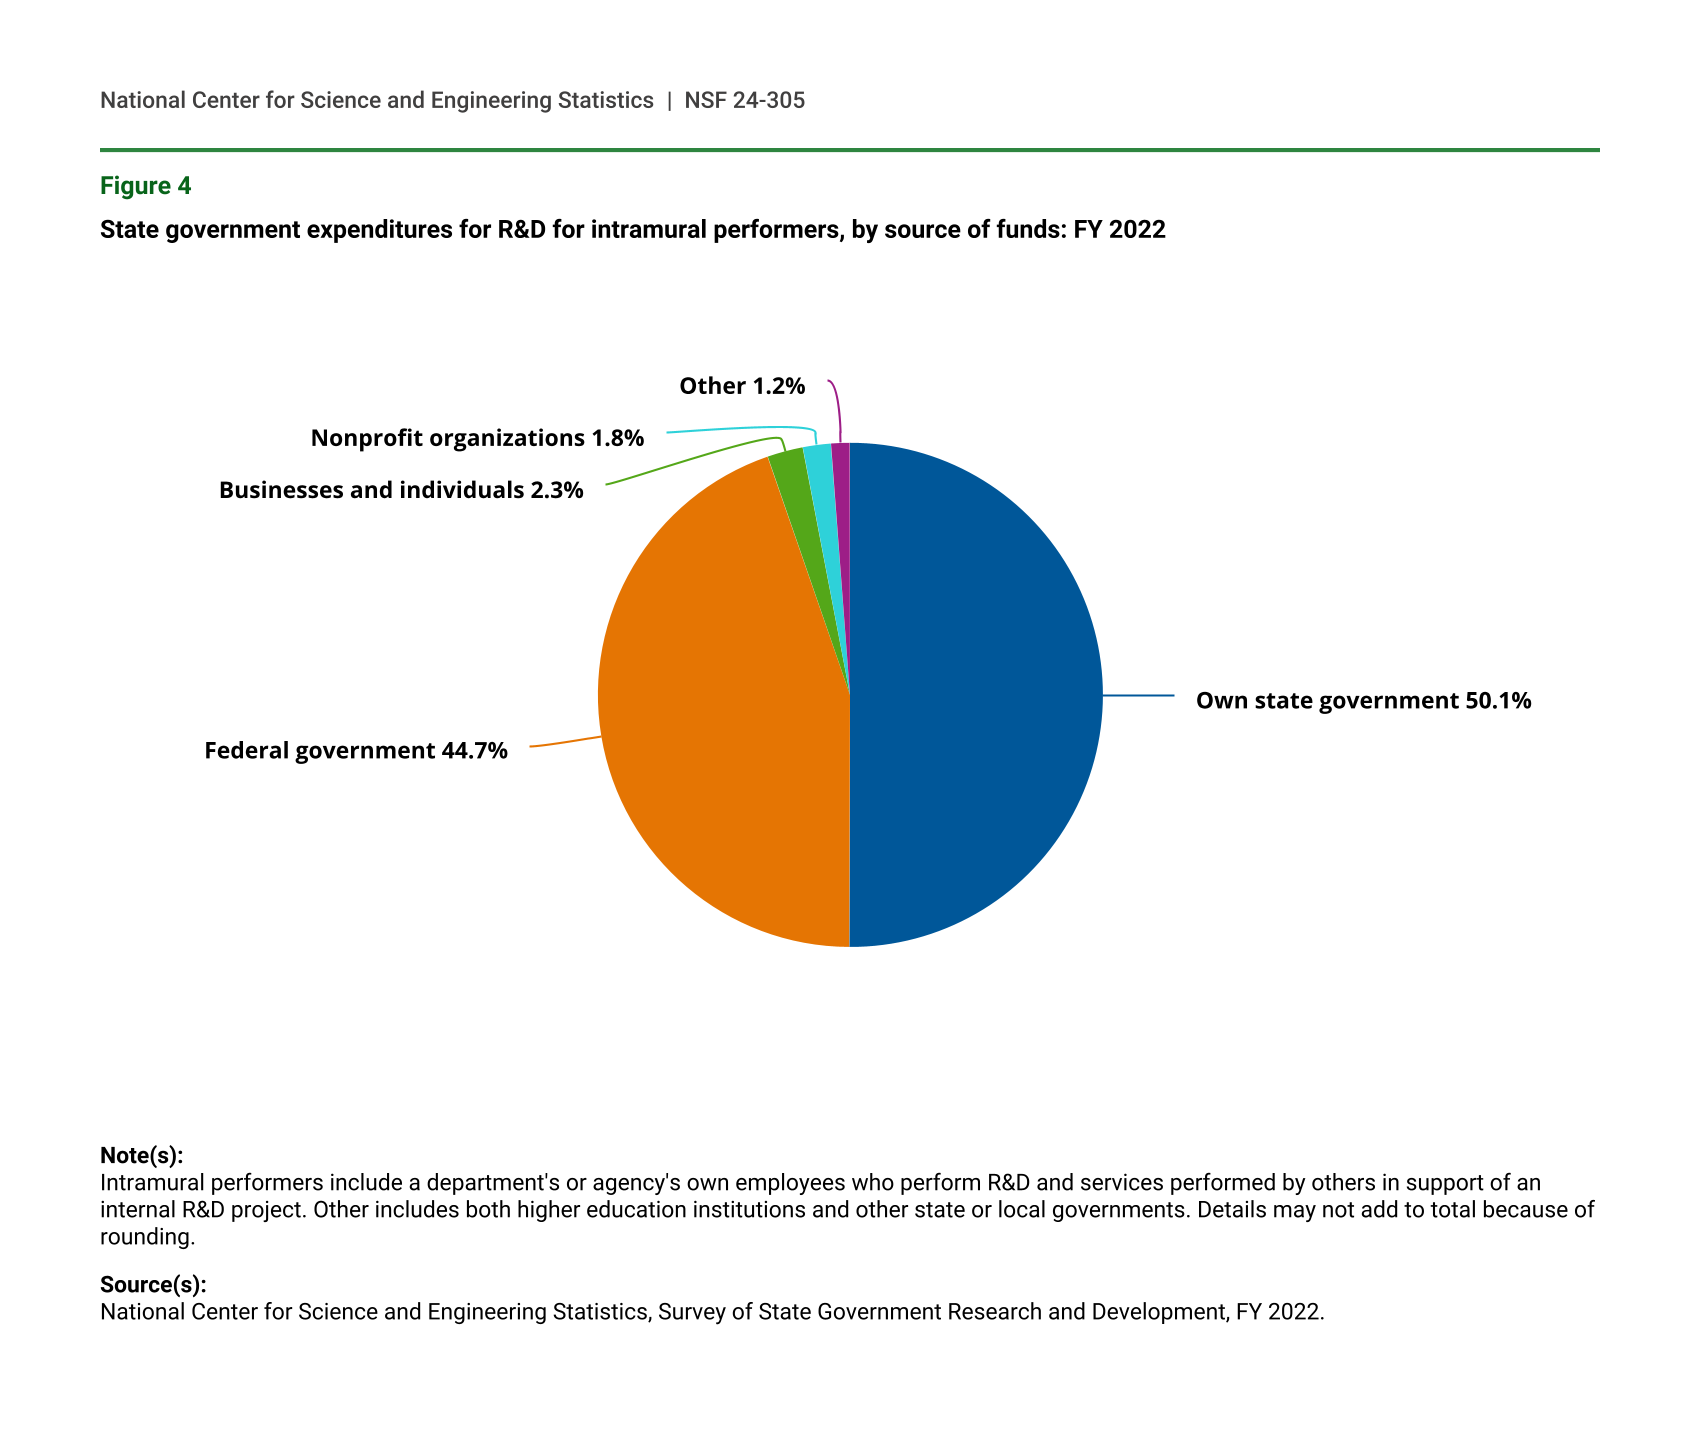
Five states accounted for 67.7% of the $697 million in total expenditures for intramural R&D performed by state agencies in FY 2022: New York ($275 million), California ($88 million), Florida ($51 million), South Carolina ($30 million), and Connecticut ($28 million) (figure 3). New York State’s own intramural R&D expenditures accounted for nearly 39.5% of all state governments’ intramural R&D and were larger than the sum of all other state governments minus California, Connecticut, Florida, and South Carolina. In FY 2022, 50.1% ($349 million) came from each state’s own funds, while 44.7% ($311 million) of all state agency intramural R&D performance was supported by federal funds (figure 4). New York State accounted for 48.8% ($152 million) of all intramural R&D expenditures sourced from federal funds across all states.
State government expenditures for R&D for intramural performers, by state and source of funds: FY 2022
| State | R&D expenditures for intramural performers |
|---|---|
| California | 87.7 |
| Connecticut | 28.2 |
| Florida | 51.4 |
| New York | 275.0 |
| South Carolina | 30.0 |
| All other states | 224.8 |
Note(s):
Intramural performers include a department's or agency's own employees who perform R&D and services performed by others in support of an internal R&D project.
Source(s):
National Center for Science and Engineering Statistics, Survey of State Government Research and Development, FY 2022.
State government expenditures for R&D for intramural performers, by source of funds: FY 2022
| Source of funds | Expenditures (%) |
|---|---|
| Own state government | 50.1 |
| Federal government | 44.7 |
| Businesses and individuals | 2.3 |
| Nonprofit organizations | 1.8 |
| Other | 1.2 |
Note(s):
Intramural performers include a department's or agency's own employees who perform R&D and services performed by others in support of an internal R&D project. Other includes both higher education institutions and other state or local governments. Details may not add to total because of rounding.
Source(s):
National Center for Science and Engineering Statistics, Survey of State Government Research and Development, FY 2022.
Extramural R&D Performance
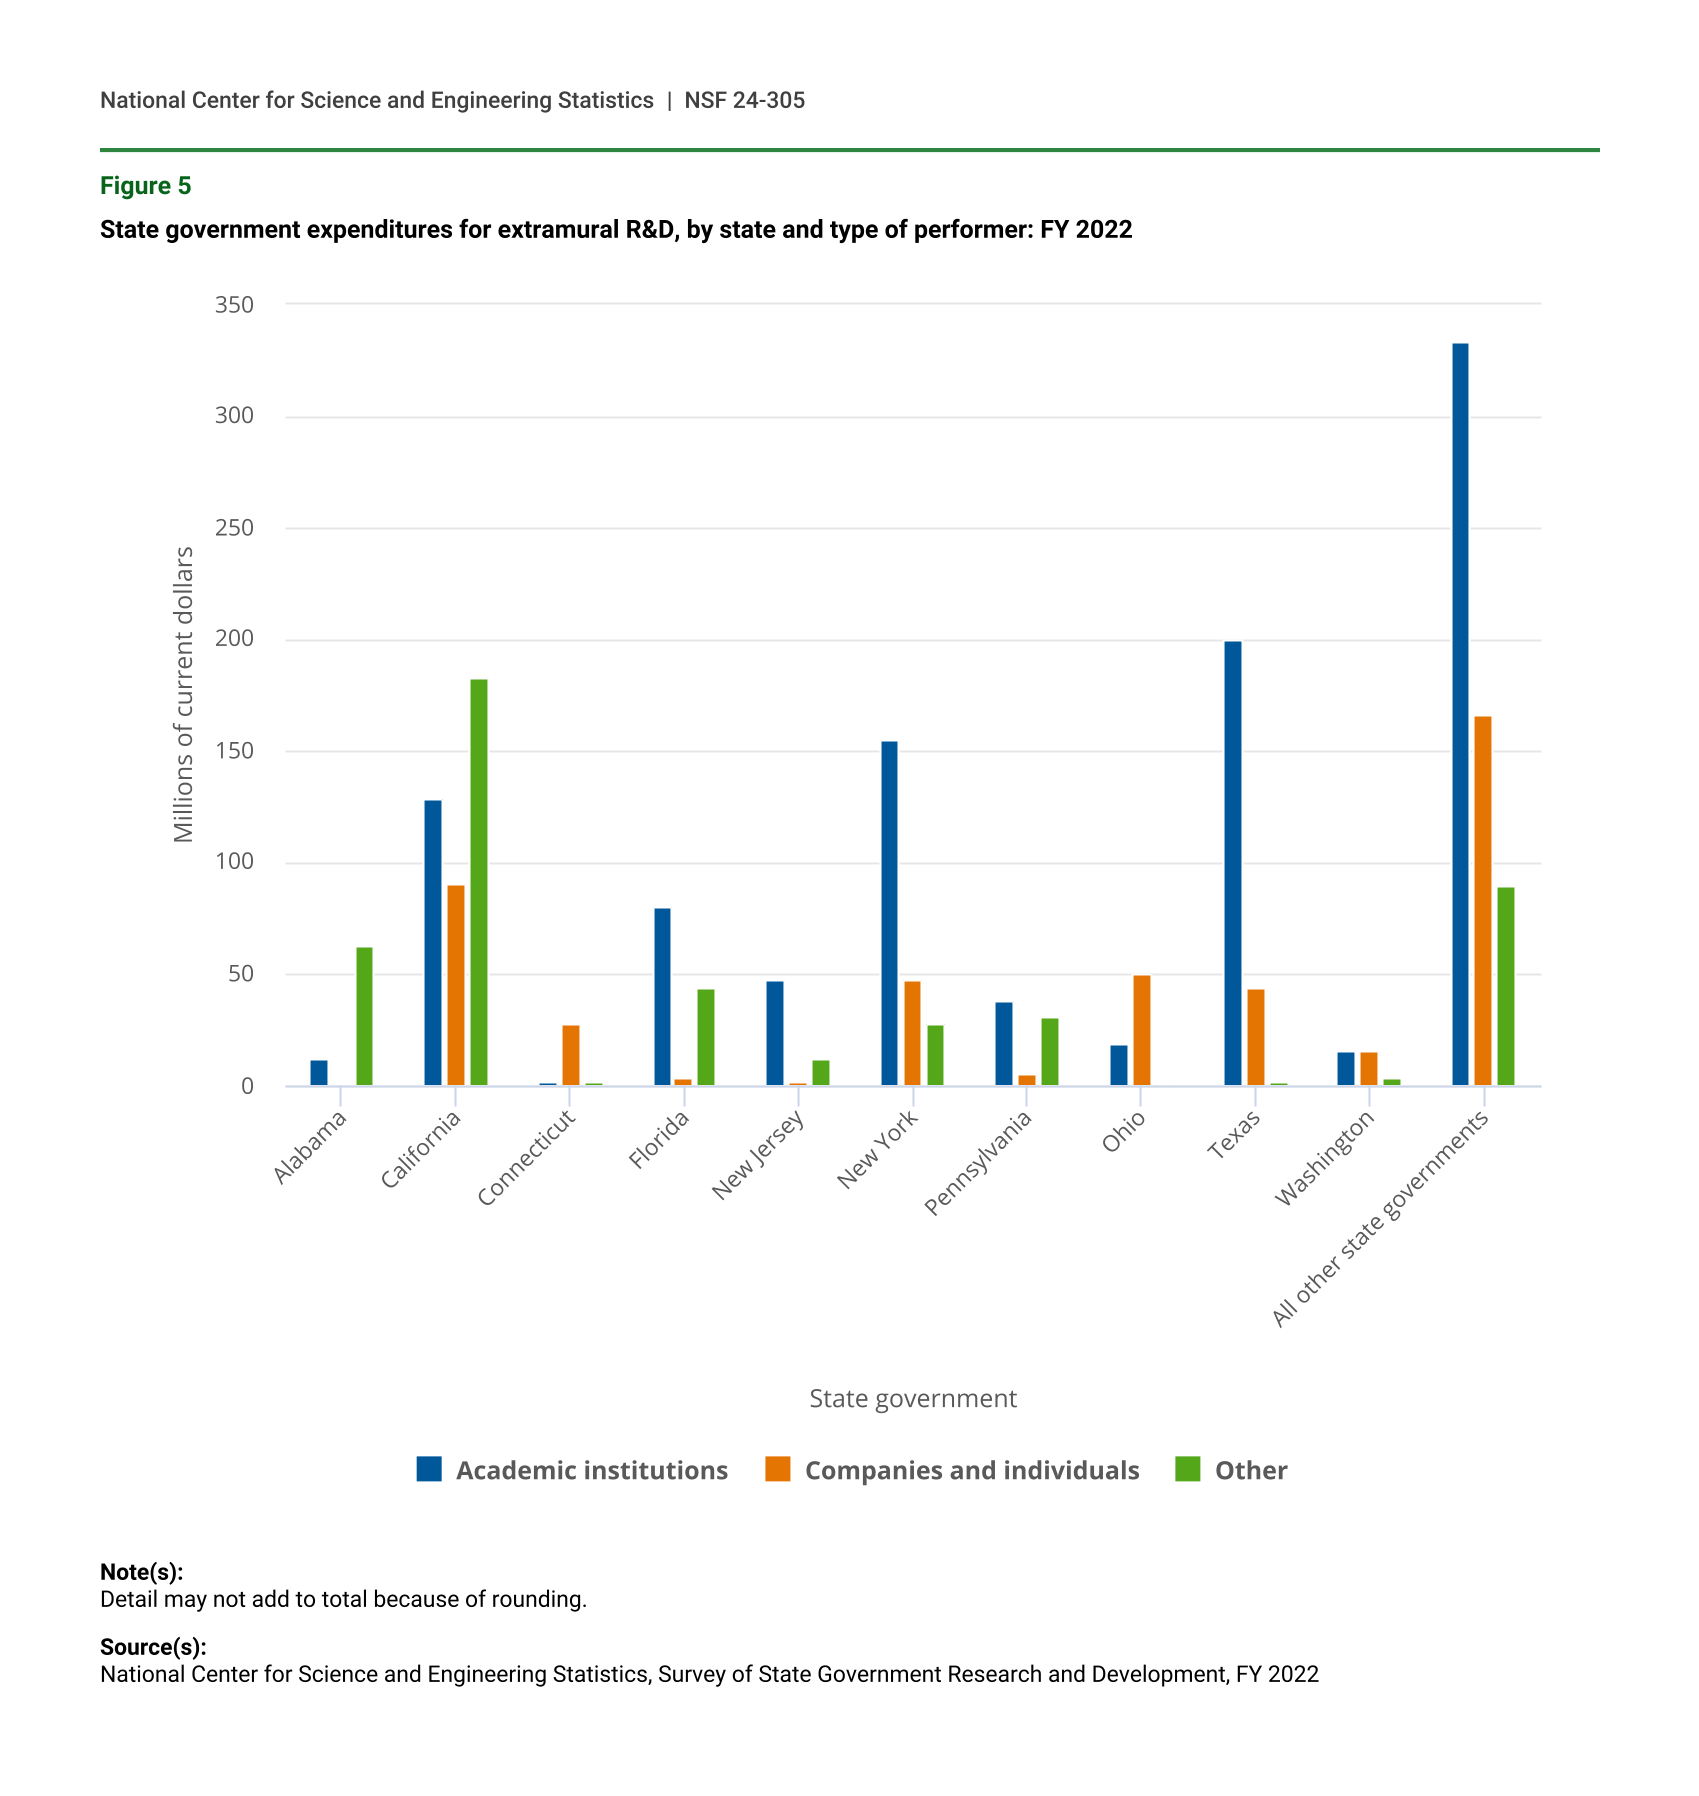
In FY 2022, all state government expenditures for extramural performance of R&D totaled $1.947 billion. The ten states with the largest amount of extramural R&D expenditures—California ($402 million), Texas ($245 million), New York ($231 million), Florida ($129 million), Alabama ($76 million), Pennsylvania ($76 million), Ohio ($69 million), New Jersey ($62 million), Washington ($36 million), and Connecticut ($32 million)—combined accounted for $1.359 billion or 69.8% of all extramural R&D (figure 5).
State government expenditures for extramural R&D, by state and type of performer: FY 2022
| State government | Academic institutions | Companies and individuals | Other |
|---|---|---|---|
| Alabama | 12 | 1 | 63 |
| California | 129 | 91 | 183 |
| Connecticut | 2 | 28 | 2 |
| Florida | 80 | 4 | 44 |
| New Jersey | 48 | 2 | 12 |
| New York | 155 | 48 | 28 |
| Pennsylvania | 38 | 6 | 31 |
| Ohio | 19 | 50 | 1 |
| Texas | 200 | 44 | 2 |
| Washington | 16 | 16 | 4 |
| All other state governments | 333 | 166 | 90 |
Note(s):
Detail may not add to total because of rounding.
Source(s):
National Center for Science and Engineering Statistics, Survey of State Government Research and Development, FY 2022
However, states varied in how they distributed extramural R&D. For example, Texas state agencies directed $200 million of the state’s total extramural R&D of $245 million toward academic institutions, compared with $44 million to companies and individuals. By comparison, California’s distribution of extramural R&D funding is more balanced across the three sectors, with $129 million directed toward academic institutions, $91 million toward companies and individuals, and $183 million toward other performers.
R&D by State Government Functions
Whether performed by state agencies themselves or by other performers outside the agency, most states reported a broad mix of R&D projects related to state government functions: agriculture, energy, environment and natural resources, health, and transportation (table 2). Health-related R&D expenditures accounted for the largest share (41.6%) of state agencies’ R&D. R&D expenditures related to environment and natural resources and to energy accounted for 20.5% and 12.4%, respectively, of total state government R&D expenditures in FY 2022. The shares of total R&D expenditures related to transportation, agriculture, and all other functions in FY 2022 were 11.0%, 4.8%, and 9.7%, respectively.
Individual state government agency expenditures for R&D, by total R&D and function, for the 20 largest agencies by expenditures: FY 2022
a U.S. total reflects all 50 states and the District of Columbia.
Note(s):
Includes state agency funding from all sources for both intramural and extramural performance. Detail may not add to total because of rounding.
Source(s):
National Center for Science and Engineering Statistics, Survey of State Government Research and Development, FY 2022.
Agency-Specific R&D Details
Of the 502 state agencies that responded to the survey in FY 2022, the largest 20 state agencies, by total expenditures, accounted for 56.3% of all agency R&D expenditures. To illustrate how concentrated expenditures are for health-related R&D, these 20 agencies accounted for $836 million of the $1.101 billion in state agency health R&D, or 75.9% of the funding for total health-related R&D. Although many states invested in health-related R&D, these expenditures are still highly concentrated in the top states. For example, the five largest health agencies reporting R&D expenditures in FY 2022 constitute 60.4% of all state government health-related R&D. State expenditures for energy-related R&D are even more highly concentrated; the California Energy Commission alone accounted for 39.9% of all state agencies’ energy-related R&D expenditures.
Data Sources, Limitations, and Availability
All 50 states, the District of Columbia, and Puerto Rico participated in the FY 2022 survey; 502 of the 505 selected agencies responded to the survey. Puerto Rico is not included in the U.S. total due to its classification as a U.S. territory. Data for the FY 2022 survey were collected for NCSES by the Census Bureau under an interagency agreement.
For most states, the fiscal year begins on 1 July and ends the following 30 June. For example, FY 2021 begins on 1 July 2020 and ends on 30 June 2021. There are, however, five exceptions to the 30 June fiscal year end: New York (ends 31 March); Texas (ends 31 August); and Alabama, Michigan, and the District of Columbia (all end 30 September). Data presented in this InfoBrief are for each of the respective fiscal year periods as defined by the states.
Terms such as state, state government, and state agencies have equivalent meaning and are used interchangeably throughout this InfoBrief. The amounts reported here are for R&D expenditures of state government departments, agencies, public authorities, commissions, and other dependent entities that operate separately or somewhat autonomously from the central state government. State government R&D totals can display considerable volatility between survey years due to several national and state-specific factors. Large changes are not unusual, especially for discretionary spending items such as R&D. R&D plant expenditures can be highly variable year to year and will increase or decrease as capital projects begin or end.
Amounts reported do not include direct appropriations from state legislatures to universities, colleges, and private organizations. As a result, the $1.0 billion in FY 2022 expenditures reported by state agencies to support R&D performance by academic institutions differs from the figure reported by universities and colleges in the NCSES Higher Education R&D Survey for expenditures on R&D activities funded from state and local government sources because the latter includes direct state appropriations.
Although this survey is a census of state government agencies that fund R&D and there is no sampling error, survey data are still subject to some degree of unmeasurable nonsampling error, which may include errors in classification or measurement of certain aspects of an agency’s R&D. For additional information see the Survey Quality Measures within the technical notes of the survey.
State- and agency-specific data not available in this InfoBrief are available in the full set of data tables from this survey in the report State Government Research and Development: FY 2022 at https://ncses.nsf.gov/surveys/state-government-research-development/2022#data. For more information, please contact the author.
Notes
1In this report, dollars adjusted for inflation (i.e., constant dollars) are based on the gross domestic product (GDP) implicit price deflator (currently in 2012 dollars) as published by the Bureau of Economic Analysis at https://www.bea.gov/iTable/index_nipa.cfm, accessed on 25 May 2023. Note that GDP deflators are calculated on an economy-wide scale and do not explicitly focus on R&D.
2Expenditures for R&D do not include expenditures for R&D plant because the two are separate funding activities.
3Detailed data on intramural R&D by state are available in data table 5, available at https://ncses.nsf.gov/surveys/state-government-research-development/2022#data.
4Data on intramural R&D by source of funds are available in data table 5, available at https://ncses.nsf.gov/surveys/state-government-research-development/2022#data.
5“Other” extramural performers includes nonprofit organizations, including foundations; federal government departments and agencies; other departments or agencies within the state; other state governments; county, city, special district, or regional local governments.
6Survey technical notes are available at https://ncses.nsf.gov/surveys/state-government-research-development/2022#technical-notes.
Suggested Citation
Pece CV; National Center for Science and Engineering Statistics (NCSES). 2023. State Government Agencies’ Expenditures for R&D Totaled $2.6 Billion in FY 2022, an Increase of 5% from FY 2021. NSF 24-305. Alexandria, VA: National Science Foundation. Available at https://ncses.nsf.gov/pubs/nsf24305.
Contact Us
NCSES
National Center for Science and Engineering Statistics
Directorate for Social, Behavioral and Economic Sciences
National Science Foundation
2415 Eisenhower Avenue, Suite W14200
Alexandria, VA 22314
Tel: (703) 292-8780
FIRS: (800) 877-8339
TDD: (800) 281-8749
E-mail ncsesweb@nsf.gov
NSF 24-305
|November 27, 2023