 An official website of the United States government

The Different Approaches to Design by U.S. Businesses
This InfoBrief presents data from the 2022 Annual Business Survey (ABS) (data year 2021) on the design approaches used by U.S. businesses. Design is regarded as an important nontechnological input to the innovation process, concerned with how consumers perceive and interact with technological inventions and improvements in products. According to the ABS, 16.1% of companies reported pursuing design as a structured, creative process in 2021, which is similar to the minority of companies that reported product innovation between 2019 and 2021 (9.4%).
The ABS is cosponsored by the National Center for Science and Engineering Statistics (NCSES) within the U.S. National Science Foundation and by the Census Bureau. It collects data related to innovation, intellectual property, technology, and business owner characteristics from both microbusinesses and companies with 10 or more employees. This InfoBrief reviews approaches to design by selected industry, company size, and how design work is constituted and organized.
The ABS combines efforts to collect data that historically came from multiple separate business surveys: the Survey of Business Owners, the Annual Survey of Entrepreneurs, the 2016 Business R&D and Innovation Survey–Microbusiness (BRDI–M), and an innovation survey modeled on Eurostat’s Community Innovation Survey. This InfoBrief and the related full set of data tables result from the fifth year of ABS data collection.
Approaches to Design
Design is ubiquitous—there is no such thing as an undesigned product. Every decision made regarding the fabrication of a good or delivery of a service is implicitly a design decision. The question in the 2022 ABS used to differentiate companies with no systematic approach to design from those with a structured, creative approach (referred to as design-active) reads as follows:
We are interested in collecting information on clear design activities defined as part of structured creative processes.
Does this business take a structured approach to conducting design activities?
___ Yes ___ No
Design of goods can include the following: the “look” of manufactured products; function; ease of manufacturing; environmental sustainability or resilience; quality; or architectural design.
Design of services can include the following: business processes (i.e., design thinking); customer experience; delivery of a service; or user experience (UX) that addresses interaction with goods, services, or digital content by users.
Table 1 provides responses by 2-digit NAICS industry code and company size. Across all industries, 16.1% of companies reported approaching design as a structured process. Industries that have a higher percentage of companies active in design include manufacturing (NAICS 31–33); information (NAICS 51); professional, scientific, and technical services (NAICS 54); and educational services (NAICS 61). Industries with a lower percentage of companies active in design include agriculture, forestry, fishing and hunting (NAICS 11); mining (NAICS 21); retail trade (NAICS 44–45); transportation and warehousing (NAICS 48–49); real estate rental and leasing (NAICS 53); health care and social assistance (NAICS 62); accommodation and food services (NAICS 72); and other services (NAICS 81). Design-active companies are least prevalent in the smallest microbusinesses (1–4 employees).
Design-active companies, by selected industry and company size: 2021
r = relative standard error > 50%.
NAICS = 2017 North American Industry Classification System.
Note(s):
Detail may not add to total because of rounding.
Source(s):
National Center for Science and Engineering Statistics and Census Bureau, 2022 Annual Business Survey: Data Year 2021.
Resources for Design
Design-active companies that take a structured approach to design may differ in their commitment to or coordination of design, manifest as the explicit provisioning of resources for design and a design budget. Among design-active companies, 40.3% reported allocating resources explicitly to design and 11.4% reported having a design budget (table 2). Both percentages increase nominally with company size, with the smallest microbusinesses (1–4 employees) being the least likely to report having a design budget. These findings reinforce the coordination interpretation of the indicators where larger companies may have a greater need to allocate resources explicitly and document expenditures.
Resources for design and design budget in design-active companies, by selected industry and company size: 2021
r = relative standard error > 50%.
NAICS = 2017 North American Industry Classification System.
Note(s):
Detail may not add to total because of rounding.
Source(s):
National Center for Science and Engineering Statistics and Census Bureau, 2022 Annual Business Survey: Data Year 2021.
Design Performers
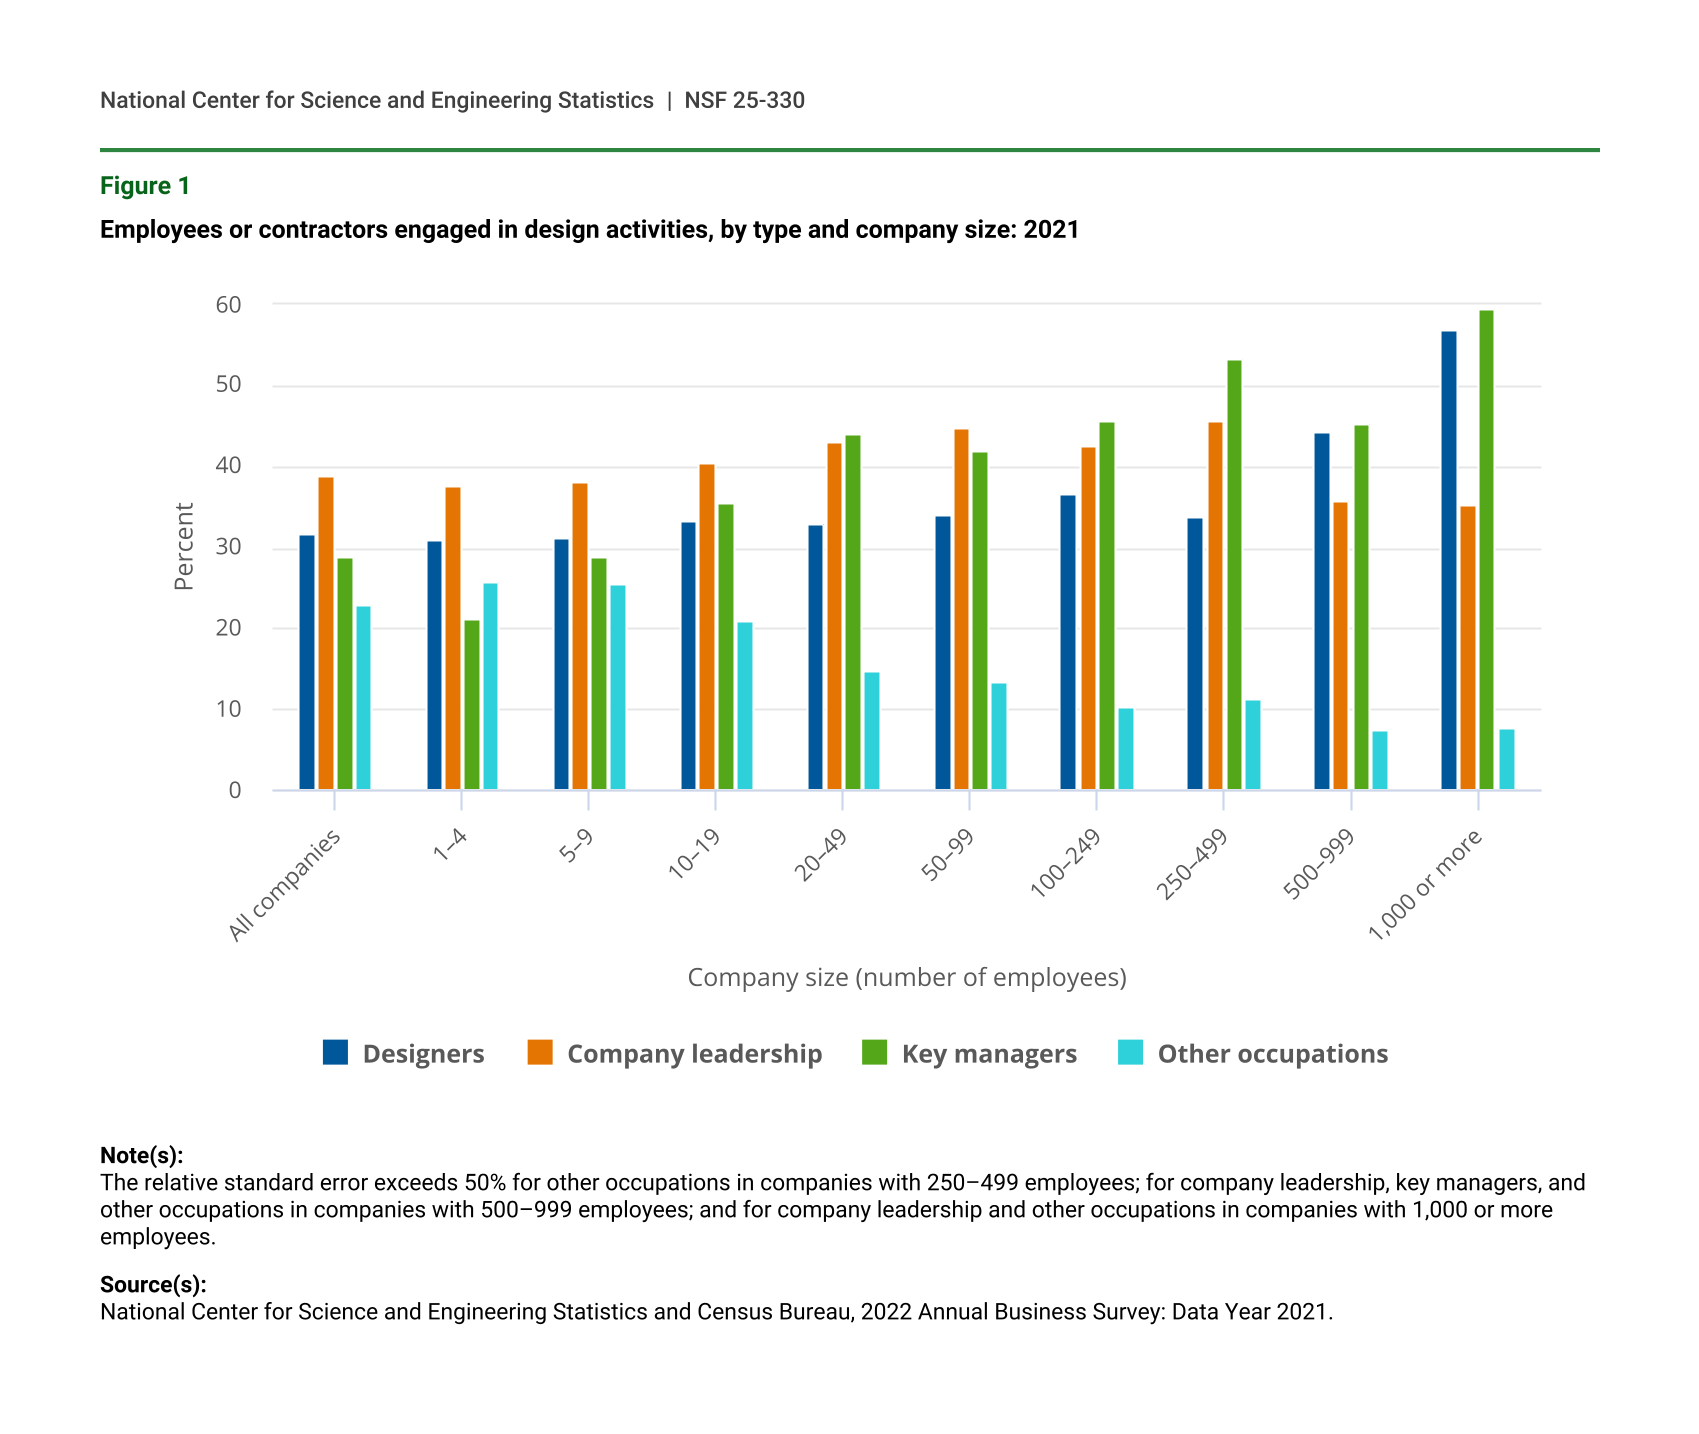
Who is engaged in design activities and how engagement differs by company size are empirical questions. The assumption that design activities are carried out exclusively by professional designers who are either employed or contracted is not supported by the data, which show that companies report design tasks performed by other occupations, such as engineers or craft workers. Company leadership or managers in key departments, such as marketing or web development, may also routinely perform design activities. In design-active companies, company leadership was engaged in design activities most often (38.9%) whereas occupations other than designers were engaged least often (21.3%) (figure 1). Other occupations routinely performing design activities was most often reported by companies with fewer than 5 employees.
Employees or contractors engaged in design activities, by type and company size: 2021
| Company size (number of employees) | Designers | Company leadership | Key managers | Other occupations |
|---|---|---|---|---|
| All companies | 31.8 | 38.9 | 28.8 | 22.9 |
| 1–4 | 30.9 | 37.5 | 21.0 | 25.7 |
| 5–9 | 31.2 | 38.0 | 28.9 | 25.4 |
| 10–19 | 33.2 | 40.5 | 35.5 | 20.9 |
| 20–49 | 32.9 | 42.9 | 44.0 | 14.7 |
| 50–99 | 33.9 | 44.7 | 41.9 | 13.3 |
| 100–249 | 36.6 | 42.4 | 45.6 | 10.3 |
| 250–499 | 33.8 | 45.6 | 53.2 | 11.4 |
| 500–999 | 44.2 | 35.8 | 45.4 | 7.5 |
| 1,000 or more | 56.9 | 35.4 | 59.4 | 7.7 |
Note(s):
The relative standard error exceeds 50% for other occupations in companies with 250–499 employees; for company leadership, key managers, and other occupations in companies with 500–999 employees; and for company leadership and other occupations in companies with 1,000 or more employees.
Source(s):
National Center for Science and Engineering Statistics and Census Bureau, 2022 Annual Business Survey: Data Year 2021.
Design Organization
Company size is likely to have a large impact on how design activities are organized. The smallest microbusinesses (1–4 employees) report design being performed by those working independently most often and report use of a small team or design department least often (table 3). Design organized around a single, small team demonstrated the least variation across company sizes. The type of organization selected was not exclusive, so larger companies with a central design department could also report some design activities being carried out independently.
Organization of design activities, by company size: 2021
r = relative standard error > 50%.
Note(s):
Detail may not add to total because of rounding. Multiple choices are allowed so percentages may not add to 100.
Source(s):
National Center for Science and Engineering Statistics and Census Bureau, 2022 Annual Business Survey: Data Year 2021.
Design as Styling, Functional, or Strategic
Different approaches to design in national innovation surveys were first investigated by Statistics Denmark in their 2010 and 2012 Community Innovation Survey. Their design ladder construct had four rungs:
- Design as strategic, a central directing element of the company’s business model as the top rung
- Design as functional, integrated throughout the product development process as the second highest rung
- Design as styling, applied as a last finish before product launch as the third highest rung
- No systematic approach to design as the bottom rung
Companies that self-identified as active in design in the 2022 ABS were asked to classify their design approach with respect to the top three rungs and could select more than one rung. Design as styling was the most common approach selected (64.7%), with design as strategy the least common approach selected (24.1%) (table 4). Design as functional was selected by 39.8% of the companies. This pattern is statistically consistent for companies with fewer than 100 employees. The majority of design-active companies in durable manufacturing (NAICS 33); information (NAICS 51); and professional, scientific, and technical services (NAICS 54) pursued a functional approach to design.
Design approach for design-active companies, by selected industry and company size: 2021
r = relative standard error > 50%.
NAICS = 2017 North American Industry Classification System.
Note(s):
Detail may not sum to total due to rounding. Multiple choices allowed so percentages may not sum to 100. "Styling" tabulates positive responses to "Design is used to enhance the appearance and attractiveness of the final good or service." "Functional" tabulates positive responses to "Design is integrated into the development of new goods or services." "Strategic" tabulates positive responses to "Design is a central directing element of the business model."
Source(s):
National Center for Science and Engineering Statistics and Census Bureau, 2022 Annual Business Survey: Data Year 2021.
By State
Design-active companies in all states nominally followed a very similar pattern: a majority of companies pursued a styling approach, a smaller percentage of companies pursued a functional approach, and the smallest percentage of companies pursued a strategic approach (table 5). However, because of the relatively small cell sizes for some states, the only statistically verified conclusion is that a styling approach to design was more prevalent than a strategic approach to design in all states. With the strategic approach as the highest rung on the design ladder, it is notable that a significant number of companies in each state regarded design as a central directing element of their business.
Design approach of design-active companies, by state: 2021
Note(s):
Statistics are representative of companies located in the United States. Undistributed are data not allocated to a specific state. Detail may not sum to total due to rounding. Multiple responses allowed so percentages may not sum to 100. "Styling" tabulates positive responses to "Design is used to enhance the appearance and attractiveness of the final good or service." "Functional" tabulates positive responses to "Design is integrated into the development of new goods or services." "Strategic" tabulates positive responses to "Design is a central directing element of the business model."
Source(s):
National Center for Science and Engineering Statistics and Census Bureau, 2022 Annual Business Survey: Data Year 2021.
Design Employment and Expected Trends
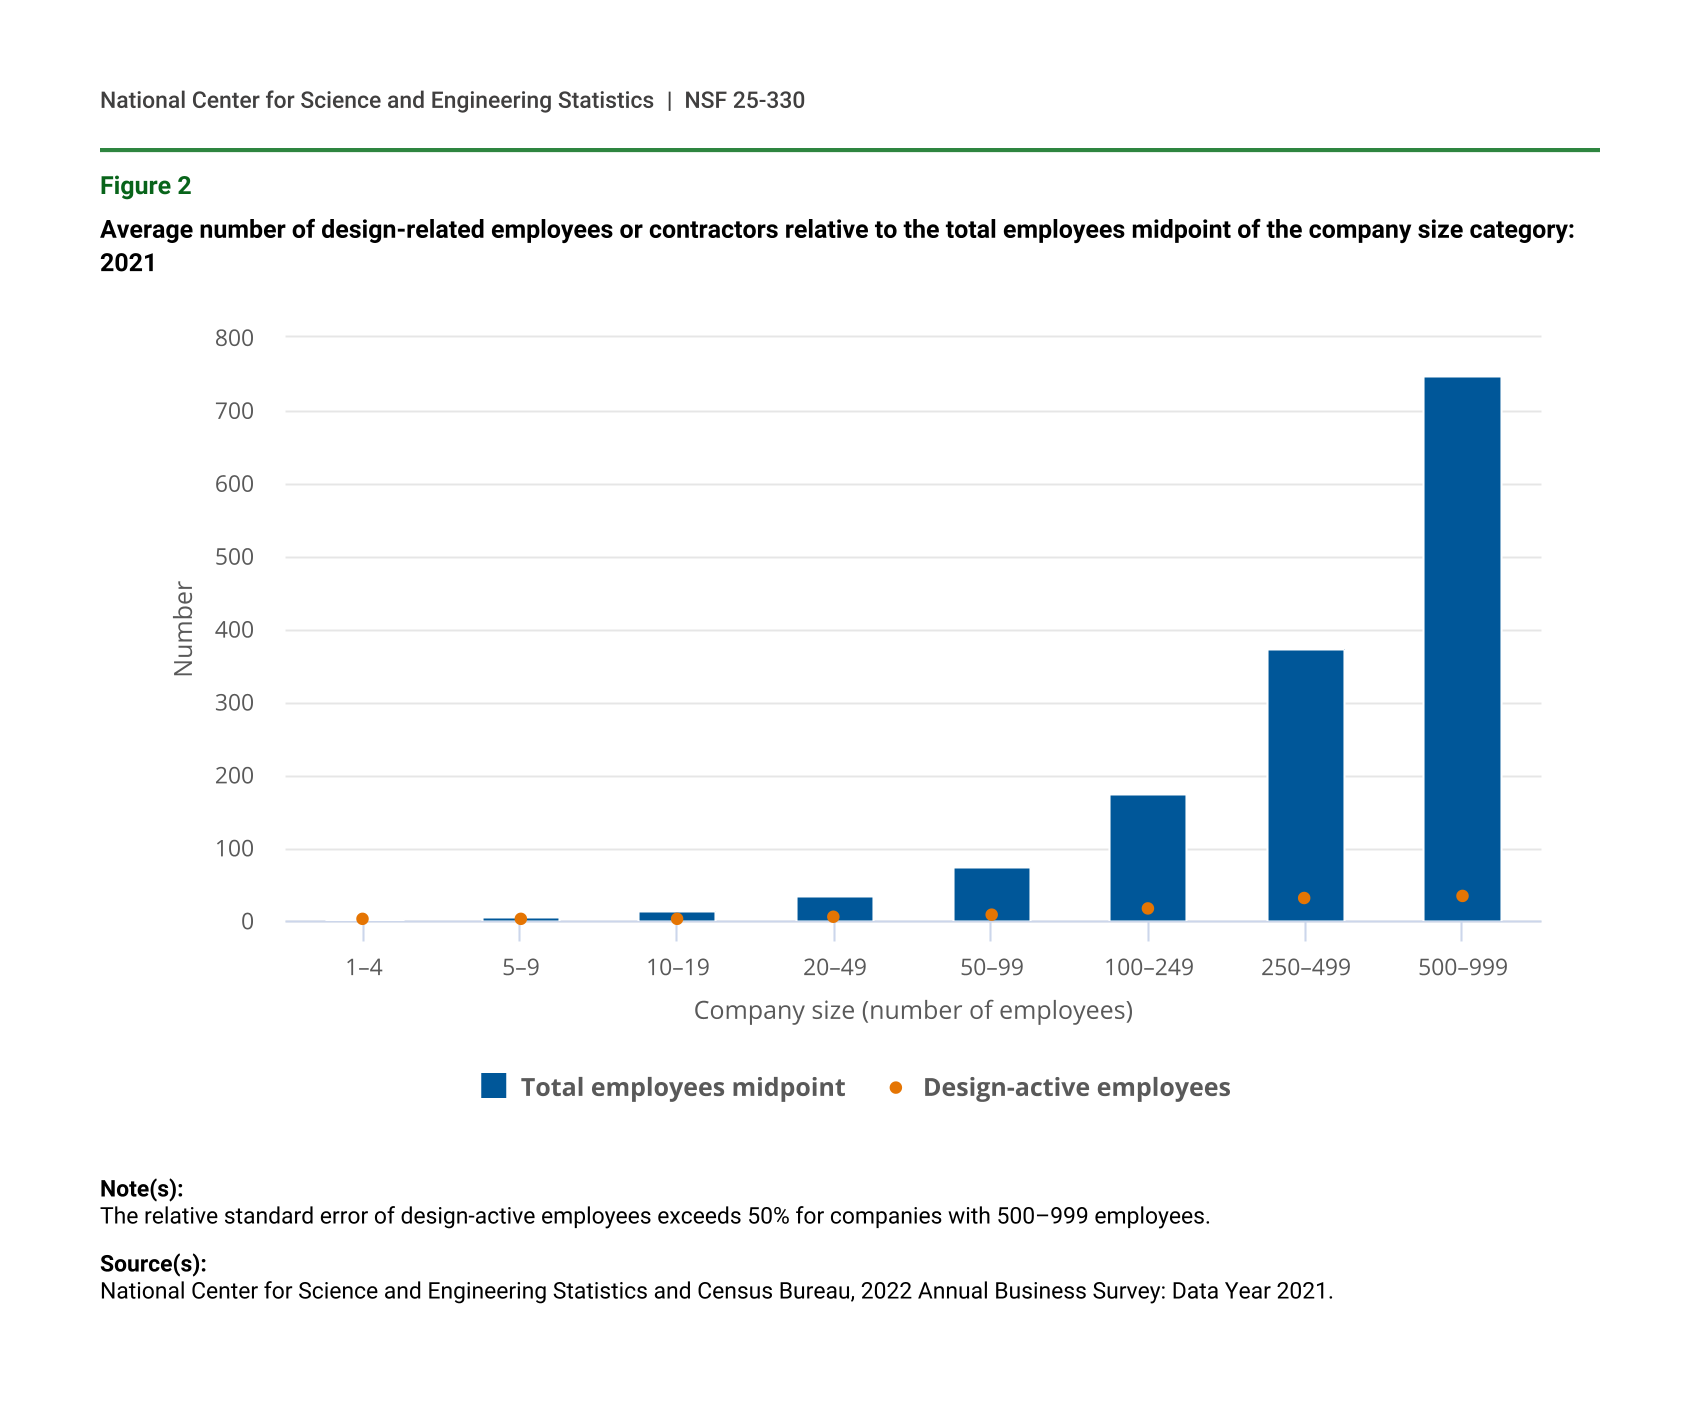
The number of employees or contractors performing design activities nominally increased between 2019 and 2021 across all company sizes; however, these differences are not statistically significant (table 6). Most striking when looking at the data is that the number of employees across the company size categories increases much more than the number of employees or contractors performing design activities in either 2019 or 2021. For example, companies in 2021 with 10–19 employees had on average 3.4 design-related employees or contractors; for a company at the midpoint of this size category, the ratio of those working in design to total employment was about 1 to 5. At the midpoint of the 500–999 employee category, this ratio jumped to greater than 1 to 20. This finding from table 6 and figure 2 reinforces findings drawn from the data in table 3 regarding the organization of design in larger companies: a small team or employees or contractors working independently may provide adequate design capabilities in the larger size companies.
Design-related employees or contractors, by company size: 2019 and 2021
r = relative standard error > 50%.
Source(s):
National Center for Science and Engineering Statistics and Census Bureau, 2022 Annual Business Survey: Data Year 2021.
Average number of design-related employees or contractors relative to the total employees midpoint of the company size category: 2021
| Company size (number of employees) | Design-active employees | Total employees midpoint |
|---|---|---|
| 1–4 | 1.6 | 2.5 |
| 5–9 | 2.5 | 7.0 |
| 10–19 | 3.4 | 14.5 |
| 20–49 | 4.9 | 34.5 |
| 50–99 | 9.3 | 74.5 |
| 100–249 | 15.8 | 174.5 |
| 250–499 | 31.3 | 374.5 |
| 500–999 | 35.6 | 749.5 |
Note(s):
The relative standard error of design-active employees exceeds 50% for companies with 500–999 employees.
Source(s):
National Center for Science and Engineering Statistics and Census Bureau, 2022 Annual Business Survey: Data Year 2021.
The suggestive evidence from table 6 that the number of employees or contractors in design may be increasing is reinforced by expected changes in design activity over the next 3 years. Among design-active companies, 36.1% believe that design resources will increase slightly and 8.9% believe design resources will increase substantially (table 7). Among companies that are not currently active in design, 8.7% believe that design resources will increase slightly. While about half of design-active companies expect no change in design resources over the next 3 years, fewer than 5% of design-active companies expect to see design resources decrease. Among companies that are currently not active in design, more than 10% of companies in manufacturing (NAICS 31–33) expect an increase in design resources.
Expected future design activity resources for the next three years, by selected industry and company size: 2021
r = relative standard error > 50%.
NAICS = 2017 North American Industry Classification System.
Note(s):
Detail may not sum to total due to rounding.
Source(s):
National Center for Science and Engineering Statistics and Census Bureau, 2022 Annual Business Survey: Data Year 2021.
Data Sources, Limitations, and Availability
The statistics from the survey are based on a sample; as such, they are subject to both sampling and nonsampling errors (see the survey “Technical Notes”). The estimates in this InfoBrief are based on responses from a sample of the population and may differ from actual values because of sampling variability or other factors. As a result, apparent differences between the estimates for two or more groups may not be statistically significant. All comparative statements in this InfoBrief have undergone statistical testing and are significant at the 90% confidence level unless otherwise noted. Variance estimation in this report was calculated using replicate weights that incorporate full information about the complex sample design of the ABS.
This InfoBrief is designated as an experimental statistical product, the data tables are not official statistics and should not be used to make official statements or inferences about characteristics of the population or economy. NCSES releases experimental statistical products to benefit users in the absence of other relevant information and to improve future iterations of data collection. Experimental statistical products may not meet some of NCSES’s quality standards and, as a result, users should assess the utility limitations of these experimental statistics relative to the intended use. Official statistics on design activities are available in Tables 62–65.
For the full ABS 2022 (data year 2021), 300,000 employer companies were sampled to represent the population of 4.9 million employer companies, and the unit response rate was 67.0%. ABS 2022 uses the 2017 North American Industry Classification System (NAICS).
The full set of data tables on R&D, company demographics, innovation, technology, and patent and intellectual property protection from this survey is available at https://ncses.nsf.gov/surveys/annual-business-survey/2022. Individual data tables and tables with relative standard errors and imputation rates from the ABS 2022 are available from NCSES upon request.
NCSES has reviewed this product for unauthorized disclosure of confidential information and approved its release (NCSES-DRN24-068).
Notes
1Galindo-Rueda F, Millot V. 2015. Measuring design and its role in innovation. OECD Science, Technology and Industry Working Paper 2015/01. Paris: OECD Publications.
Suggested Citation
National Center for Science and Engineering Statistics (NCSES). 2025. The Different Approaches to Design by U.S. Businesses. NSF 25-330. Alexandria, VA: U.S. National Science Foundation. Available at https://ncses.nsf.gov/pubs/nsf25330.
Contact Us
National Center for Science and Engineering Statistics
Directorate for Social, Behavioral and Economic Sciences
U.S. National Science Foundation
2415 Eisenhower Avenue, Suite W14200
Alexandria, VA 22314
Tel: (703) 292-8780
FIRS: (800) 877-8339
TDD: (800) 281-8749
E-mail: ncsesweb@nsf.gov
NSF 25-330
|March 24, 2025