 An official website of the United States government

Long-Term Trends Show Decline in Federally Funded R&D as a Share of GDP while Business-Funded R&D Share Increases
NSF 25-334
|April 24, 2025
- For grouped bar charts, Tab to the first data element (bar/line data point) which will bring up a pop-up with the data details
- To read the data in all groups Arrow-Down will go back and forth
- For bar/line chart data points are linear and not grouped, Arrow-Down will read each bar/line data points in order
- For line charts, Arrow-Left and Arrow-Right will move to the next set of data points after Tabbing to the first data point
- For stacked bars use the Arrow-Down key again after Tabbing to the first data bar
- Then use Arrow-Right and Arrow-Left to navigate the stacked bars within that stack
- Arrow-Down to advance to the next stack. Arrow-Up reverses
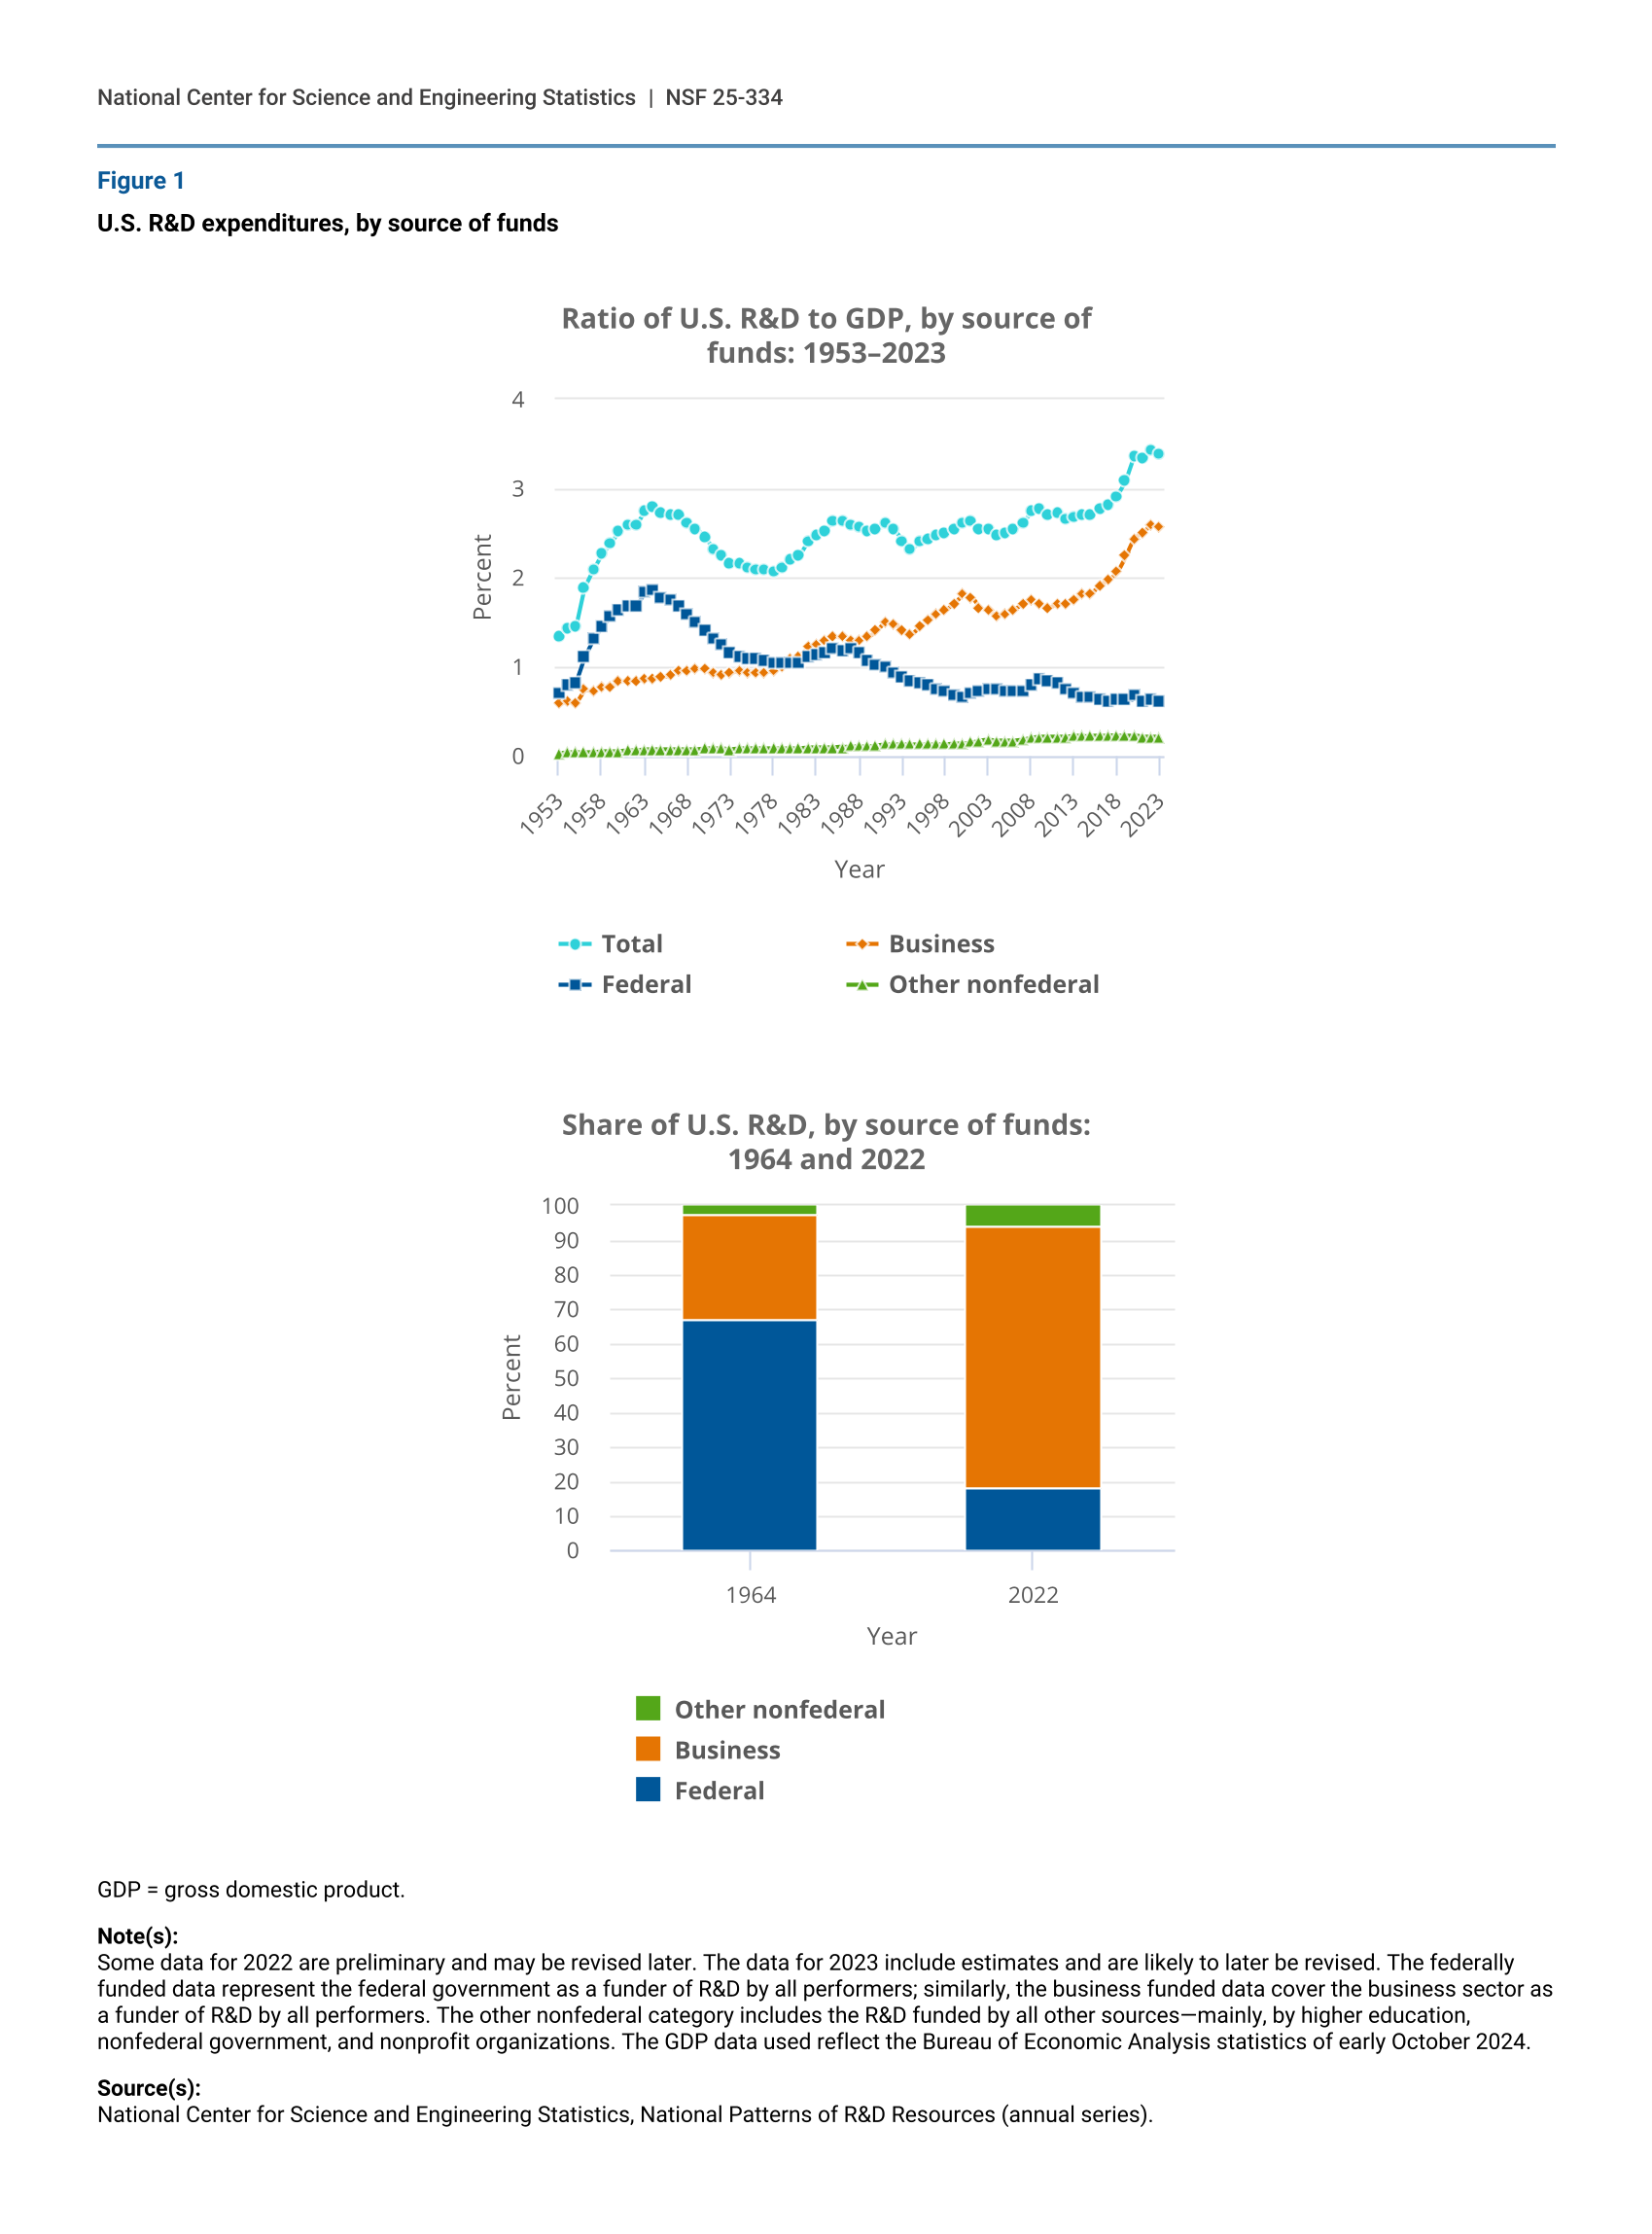
U.S. R&D expenditures, by source of funds
| Year | Total | Business | Federal | Other nonfederal |
|---|---|---|---|---|
| 1953 | 1.33 | 0.58 | 0.71 | 0.03 |
| 1954 | 1.44 | 0.61 | 0.79 | 0.04 |
| 1955 | 1.45 | 0.59 | 0.82 | 0.04 |
| 1956 | 1.89 | 0.74 | 1.11 | 0.04 |
| 1957 | 2.09 | 0.73 | 1.31 | 0.04 |
| 1958 | 2.27 | 0.77 | 1.45 | 0.05 |
| 1959 | 2.39 | 0.78 | 1.57 | 0.05 |
| 1960 | 2.53 | 0.83 | 1.64 | 0.05 |
| 1961 | 2.59 | 0.85 | 1.69 | 0.06 |
| 1962 | 2.59 | 0.85 | 1.68 | 0.06 |
| 1963 | 2.75 | 0.86 | 1.83 | 0.07 |
| 1964 | 2.79 | 0.86 | 1.86 | 0.07 |
| 1965 | 2.73 | 0.88 | 1.78 | 0.07 |
| 1966 | 2.71 | 0.90 | 1.74 | 0.07 |
| 1967 | 2.71 | 0.95 | 1.69 | 0.07 |
| 1968 | 2.62 | 0.96 | 1.59 | 0.07 |
| 1969 | 2.55 | 0.98 | 1.50 | 0.07 |
| 1970 | 2.45 | 0.97 | 1.40 | 0.08 |
| 1971 | 2.31 | 0.93 | 1.31 | 0.08 |
| 1972 | 2.25 | 0.92 | 1.25 | 0.08 |
| 1973 | 2.17 | 0.93 | 1.16 | 0.07 |
| 1974 | 2.16 | 0.96 | 1.12 | 0.08 |
| 1975 | 2.12 | 0.94 | 1.10 | 0.08 |
| 1976 | 2.10 | 0.94 | 1.08 | 0.08 |
| 1977 | 2.08 | 0.94 | 1.06 | 0.08 |
| 1978 | 2.07 | 0.95 | 1.04 | 0.08 |
| 1979 | 2.11 | 0.99 | 1.04 | 0.08 |
| 1980 | 2.21 | 1.08 | 1.05 | 0.08 |
| 1981 | 2.25 | 1.12 | 1.05 | 0.08 |
| 1982 | 2.41 | 1.22 | 1.11 | 0.09 |
| 1983 | 2.48 | 1.25 | 1.14 | 0.09 |
| 1984 | 2.53 | 1.29 | 1.15 | 0.09 |
| 1985 | 2.64 | 1.34 | 1.21 | 0.09 |
| 1986 | 2.63 | 1.33 | 1.19 | 0.10 |
| 1987 | 2.60 | 1.29 | 1.21 | 0.11 |
| 1988 | 2.56 | 1.30 | 1.15 | 0.11 |
| 1989 | 2.52 | 1.33 | 1.07 | 0.11 |
| 1990 | 2.55 | 1.40 | 1.03 | 0.12 |
| 1991 | 2.61 | 1.50 | 0.99 | 0.13 |
| 1992 | 2.54 | 1.48 | 0.93 | 0.13 |
| 1993 | 2.42 | 1.41 | 0.88 | 0.13 |
| 1994 | 2.32 | 1.36 | 0.83 | 0.13 |
| 1995 | 2.40 | 1.45 | 0.82 | 0.13 |
| 1996 | 2.44 | 1.53 | 0.79 | 0.13 |
| 1997 | 2.47 | 1.59 | 0.75 | 0.13 |
| 1998 | 2.49 | 1.63 | 0.73 | 0.13 |
| 1999 | 2.54 | 1.71 | 0.69 | 0.14 |
| 2000 | 2.61 | 1.81 | 0.66 | 0.14 |
| 2001 | 2.63 | 1.78 | 0.70 | 0.15 |
| 2002 | 2.54 | 1.65 | 0.72 | 0.17 |
| 2003 | 2.54 | 1.63 | 0.74 | 0.18 |
| 2004 | 2.48 | 1.57 | 0.74 | 0.17 |
| 2005 | 2.49 | 1.59 | 0.73 | 0.17 |
| 2006 | 2.54 | 1.64 | 0.72 | 0.17 |
| 2007 | 2.61 | 1.71 | 0.73 | 0.18 |
| 2008 | 2.74 | 1.75 | 0.80 | 0.20 |
| 2009 | 2.78 | 1.70 | 0.87 | 0.21 |
| 2010 | 2.70 | 1.65 | 0.84 | 0.21 |
| 2011 | 2.73 | 1.71 | 0.81 | 0.21 |
| 2012 | 2.67 | 1.70 | 0.76 | 0.21 |
| 2013 | 2.69 | 1.76 | 0.71 | 0.22 |
| 2014 | 2.70 | 1.81 | 0.67 | 0.22 |
| 2015 | 2.70 | 1.82 | 0.65 | 0.23 |
| 2016 | 2.77 | 1.92 | 0.63 | 0.23 |
| 2017 | 2.82 | 1.97 | 0.62 | 0.23 |
| 2018 | 2.92 | 2.06 | 0.63 | 0.22 |
| 2019 | 3.09 | 2.24 | 0.63 | 0.22 |
| 2020 | 3.36 | 2.44 | 0.69 | 0.23 |
| 2021 | 3.33 | 2.50 | 0.62 | 0.21 |
| 2022 | 3.43 | 2.59 | 0.63 | 0.21 |
| 2023 | 3.39 | 2.56 | 0.62 | 0.21 |
| Year | Federal | Business | Other nonfederal |
|---|---|---|---|
| 1964 | 66.82 | 30.82 | 2.36 |
| 2022 | 18.44 | 75.48 | 6.08 |
GDP = gross domestic product.
Note(s):
Some data for 2022 are preliminary and may be revised later. The data for 2023 include estimates and are likely to later be revised. The federally funded data represent the federal government as a funder of R&D by all performers; similarly, the business funded data cover the business sector as a funder of R&D by all performers. The other nonfederal category includes the R&D funded by all other sources—mainly, by higher education, nonfederal government, and nonprofit organizations. The GDP data used reflect the Bureau of Economic Analysis statistics of early October 2024.
Source(s):
National Center for Science and Engineering Statistics, National Patterns of R&D Resources (annual series).
The ratio of U.S. research and development (R&D) to gross domestic product (GDP) reached 3.43% in 2022. This trend (up from 2.67% in 2012) reflects the increasing role of the business sector in funding U.S. R&D performance. The ratio of business-funded R&D to GDP was 1.70% in 2012 and 2.59% in 2022. While the U.S. business-funded R&D-to-GDP ratio has been climbing in recent decades, federally funded R&D as a percentage of GDP has trended downward. As a percentage of GDP, federally funded R&D peaked in 1964. At that time, federal R&D funding accounted for 1.86% of GDP and 67% of all domestic R&D. By 2022, federally funded R&D was 0.63% of GDP and 18% of domestic R&D. Business funded 31% of domestic R&D in 1964 and 75% of domestic R&D in 2022.
The National Center for Science and Engineering Statistics (NCSES) has reviewed this product for unauthorized disclosure of confidential information and approved its release (NCSES-DRN25-009).
Suggested citation: National Center for Science and Engineering Statistics (NCSES). 2025. Long-Term Trends Show Decline in Federally Funded R&D as a Share of GDP while Business-Funded R&D Increases as a Share of GDP. NSF 25-334. Alexandria, VA: U.S. National Science Foundation. Available at https://ncses.nsf.gov/pubs/nsf25334.
NSF 25-334
|April 24, 2025