 An official website of the United States government
Federal Funding for Research Increased from 2010 to 2022, yet the Federal Government’s Share of Total Research Funding Declined
| Year | Total R&D | Research | Experimental development |
|---|---|---|---|
| 1953 | 20.7 | 7.6 | 13.1 |
| 1954 | 22.9 | 7.9 | 14.9 |
| 1955 | 25.4 | 8.4 | 17.0 |
| 1956 | 34.9 | 9.9 | 24.9 |
| 1957 | 42.3 | 11.9 | 30.4 |
| 1958 | 46.2 | 13.5 | 32.8 |
| 1959 | 53.4 | 15.0 | 38.4 |
| 1960 | 57.5 | 16.3 | 41.2 |
| 1961 | 60.6 | 17.8 | 42.8 |
| 1962 | 64.0 | 20.9 | 43.0 |
| 1963 | 72.6 | 23.0 | 49.6 |
| 1964 | 78.4 | 25.5 | 52.9 |
| 1965 | 79.6 | 26.9 | 52.7 |
| 1966 | 83.1 | 27.6 | 55.6 |
| 1967 | 83.1 | 28.8 | 54.3 |
| 1968 | 81.9 | 28.5 | 53.4 |
| 1969 | 79.4 | 28.1 | 51.4 |
| 1970 | 74.2 | 27.7 | 46.5 |
| 1971 | 71.7 | 26.6 | 45.1 |
| 1972 | 72.5 | 26.7 | 45.8 |
| 1973 | 71.1 | 26.9 | 44.2 |
| 1974 | 67.9 | 26.7 | 41.3 |
| 1975 | 66.7 | 27.1 | 39.5 |
| 1976 | 69.2 | 28.2 | 41.0 |
| 1977 | 70.9 | 28.6 | 42.2 |
| 1978 | 73.2 | 30.1 | 43.1 |
| 1979 | 75.4 | 30.9 | 44.5 |
| 1980 | 76.2 | 31.5 | 44.7 |
| 1981 | 78.3 | 31.3 | 47.0 |
| 1982 | 81.1 | 32.4 | 48.8 |
| 1983 | 87.2 | 34.9 | 52.3 |
| 1984 | 94.3 | 36.8 | 57.5 |
| 1985 | 103.6 | 40.0 | 63.6 |
| 1986 | 105.3 | 39.8 | 65.6 |
| 1987 | 110.3 | 41.3 | 69.1 |
| 1988 | 109.3 | 41.5 | 67.8 |
| 1989 | 105.8 | 44.0 | 61.8 |
| 1990 | 103.9 | 46.8 | 57.1 |
| 1991 | 99.1 | 48.2 | 50.9 |
| 1992 | 97.1 | 46.9 | 50.3 |
| 1993 | 94.3 | 47.5 | 46.8 |
| 1994 | 92.7 | 46.6 | 46.1 |
| 1995 | 94.1 | 45.6 | 48.5 |
| 1996 | 93.0 | 47.0 | 46.0 |
| 1997 | 92.8 | 46.3 | 46.5 |
| 1998 | 94.0 | 47.4 | 46.6 |
| 1999 | 94.0 | 51.0 | 43.0 |
| 2000 | 92.5 | 54.7 | 37.8 |
| 2001 | 99.2 | 60.7 | 38.6 |
| 2002 | 104.4 | 64.5 | 40.0 |
| 2003 | 110.6 | 71.3 | 39.2 |
| 2004 | 114.8 | 71.7 | 43.2 |
| 2005 | 117.0 | 72.3 | 44.7 |
| 2006 | 118.9 | 72.6 | 46.3 |
| 2007 | 121.7 | 76.1 | 45.6 |
| 2008 | 133.6 | 71.7 | 62.0 |
| 2009 | 142.0 | 78.9 | 63.2 |
| 2010 | 141.3 | 77.7 | 63.5 |
| 2011 | 138.8 | 75.1 | 63.7 |
| 2012 | 132.9 | 73.3 | 59.6 |
| 2013 | 126.8 | 72.4 | 54.4 |
| 2014 | 122.8 | 72.9 | 49.9 |
| 2015 | 122.8 | 73.7 | 49.2 |
| 2016 | 120.3 | 76.3 | 44.0 |
| 2017 | 122.4 | 77.5 | 44.9 |
| 2018 | 128.1 | 80.7 | 47.4 |
| 2019 | 130.5 | 83.3 | 47.2 |
| 2020 | 140.5 | 84.8 | 55.7 |
| 2021 | 133.7 | 81.1 | 52.5 |
| 2022 | 139.4 | 84.9 | 54.5 |
| 2023 | 141.0 | 86.4 | 54.5 |
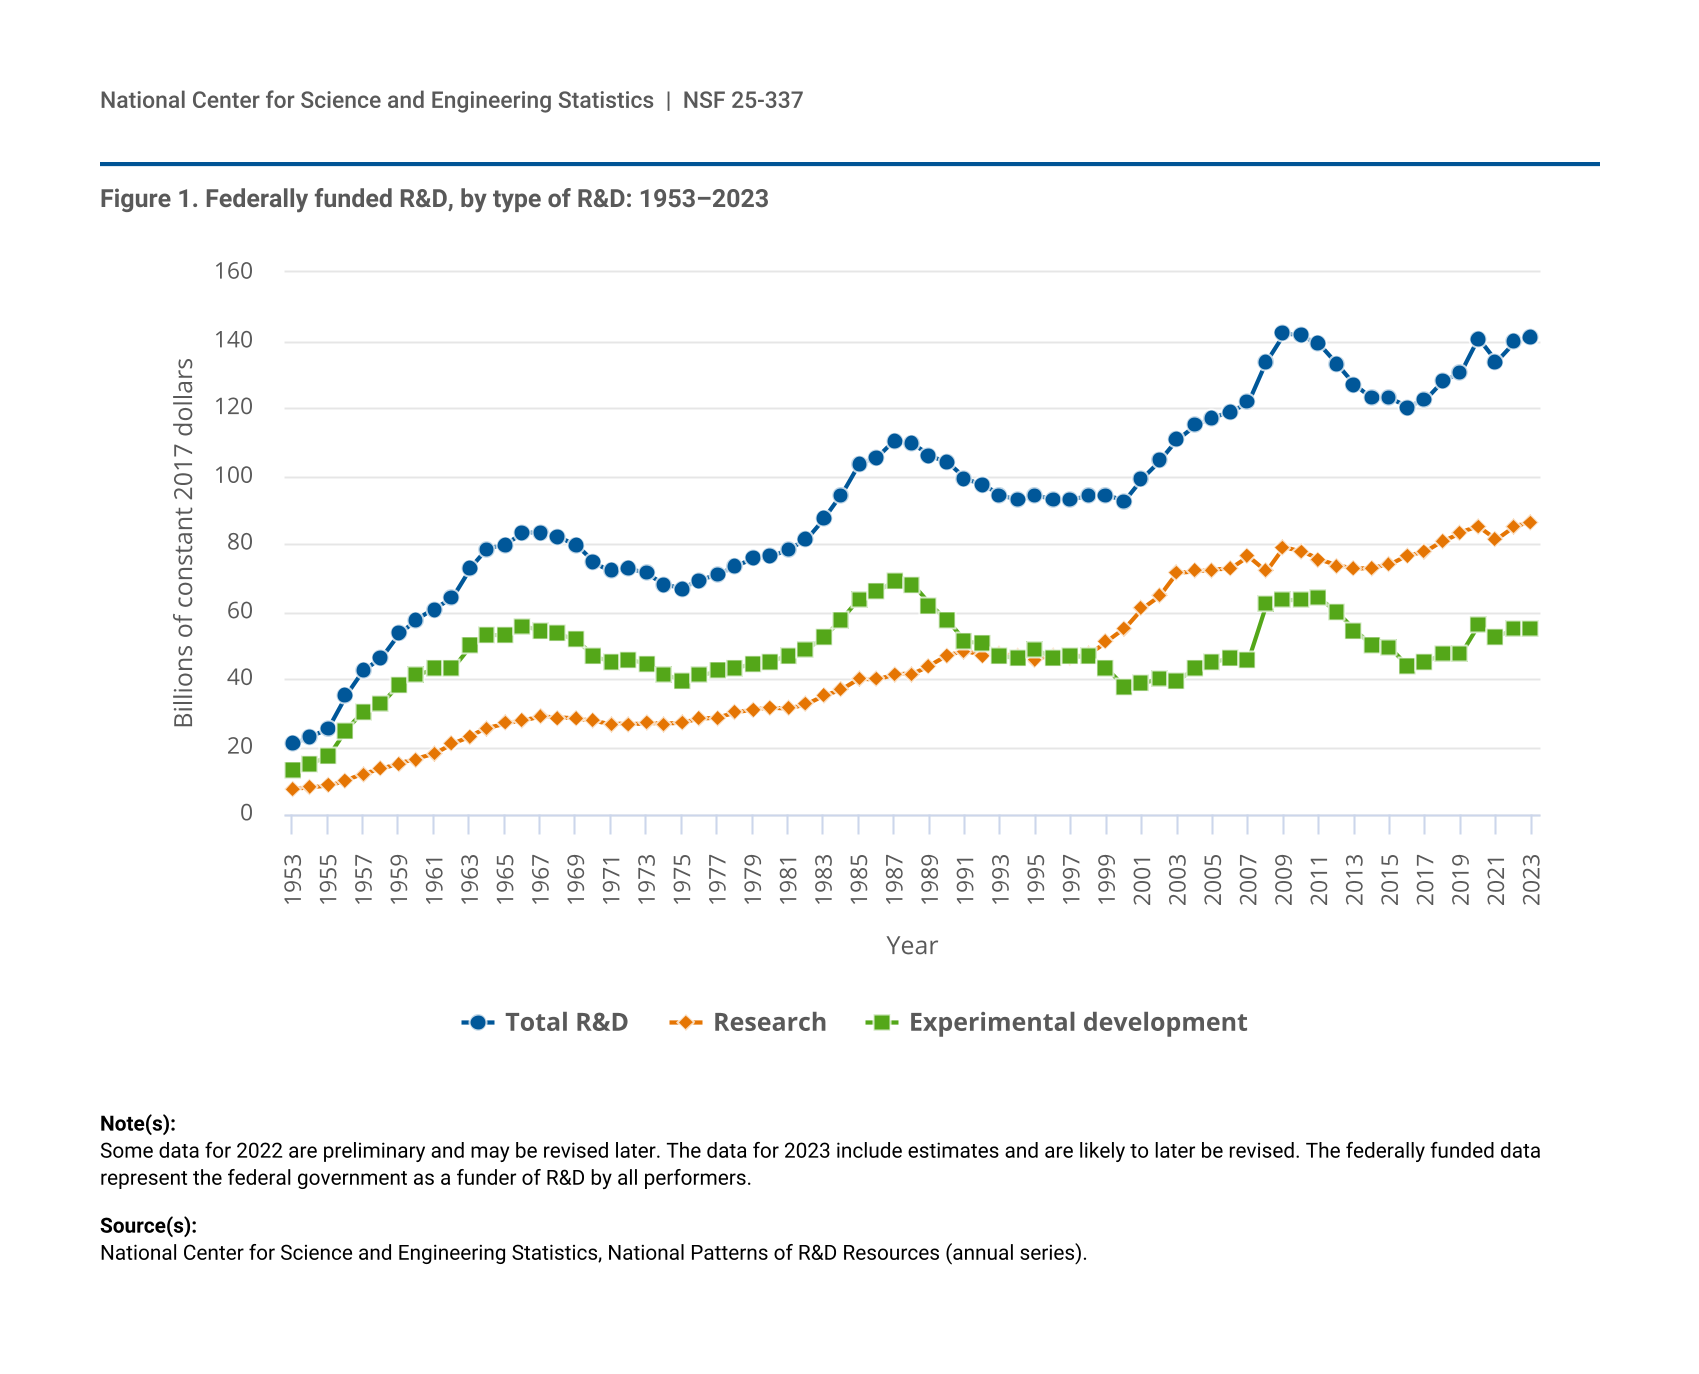
Some data for 2022 are preliminary and may be revised later. The data for 2023 include estimates and are likely to later be revised. The federally funded data represent the federal government as a funder of R&D by all performers.
National Center for Science and Engineering Statistics, National Patterns of R&D Resources (annual series).
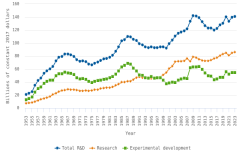
National Patterns of R&D Resources data indicate that federally funded research and experimental development (R&D) totaled $139 billion in 2022 and is estimated to reach $141 billion in 2023. (Data in this InfoBytes are presented in constant, inflation-adjusted, 2017 dollars.) Of the $139 billion total R&D in 2022, $85 billion (61%) went to research (basic and applied). The federal government’s share of research funding peaked in the mid-1960s at 63% and has steadily declined in the decades since. Between 1960 and 1969, federal funding for research averaged $24 billion per year and averaged 33% of total federal funding for R&D. Relative to the 1960s, federal funding for research has increased in value and as a share of total federal funding for R&D.
| Year | Federal | Business | Other nonfederal |
|---|---|---|---|
| 2010 | 44.9 | 37.7 | 17.4 |
| 2022 | 34.3 | 49.8 | 15.9 |
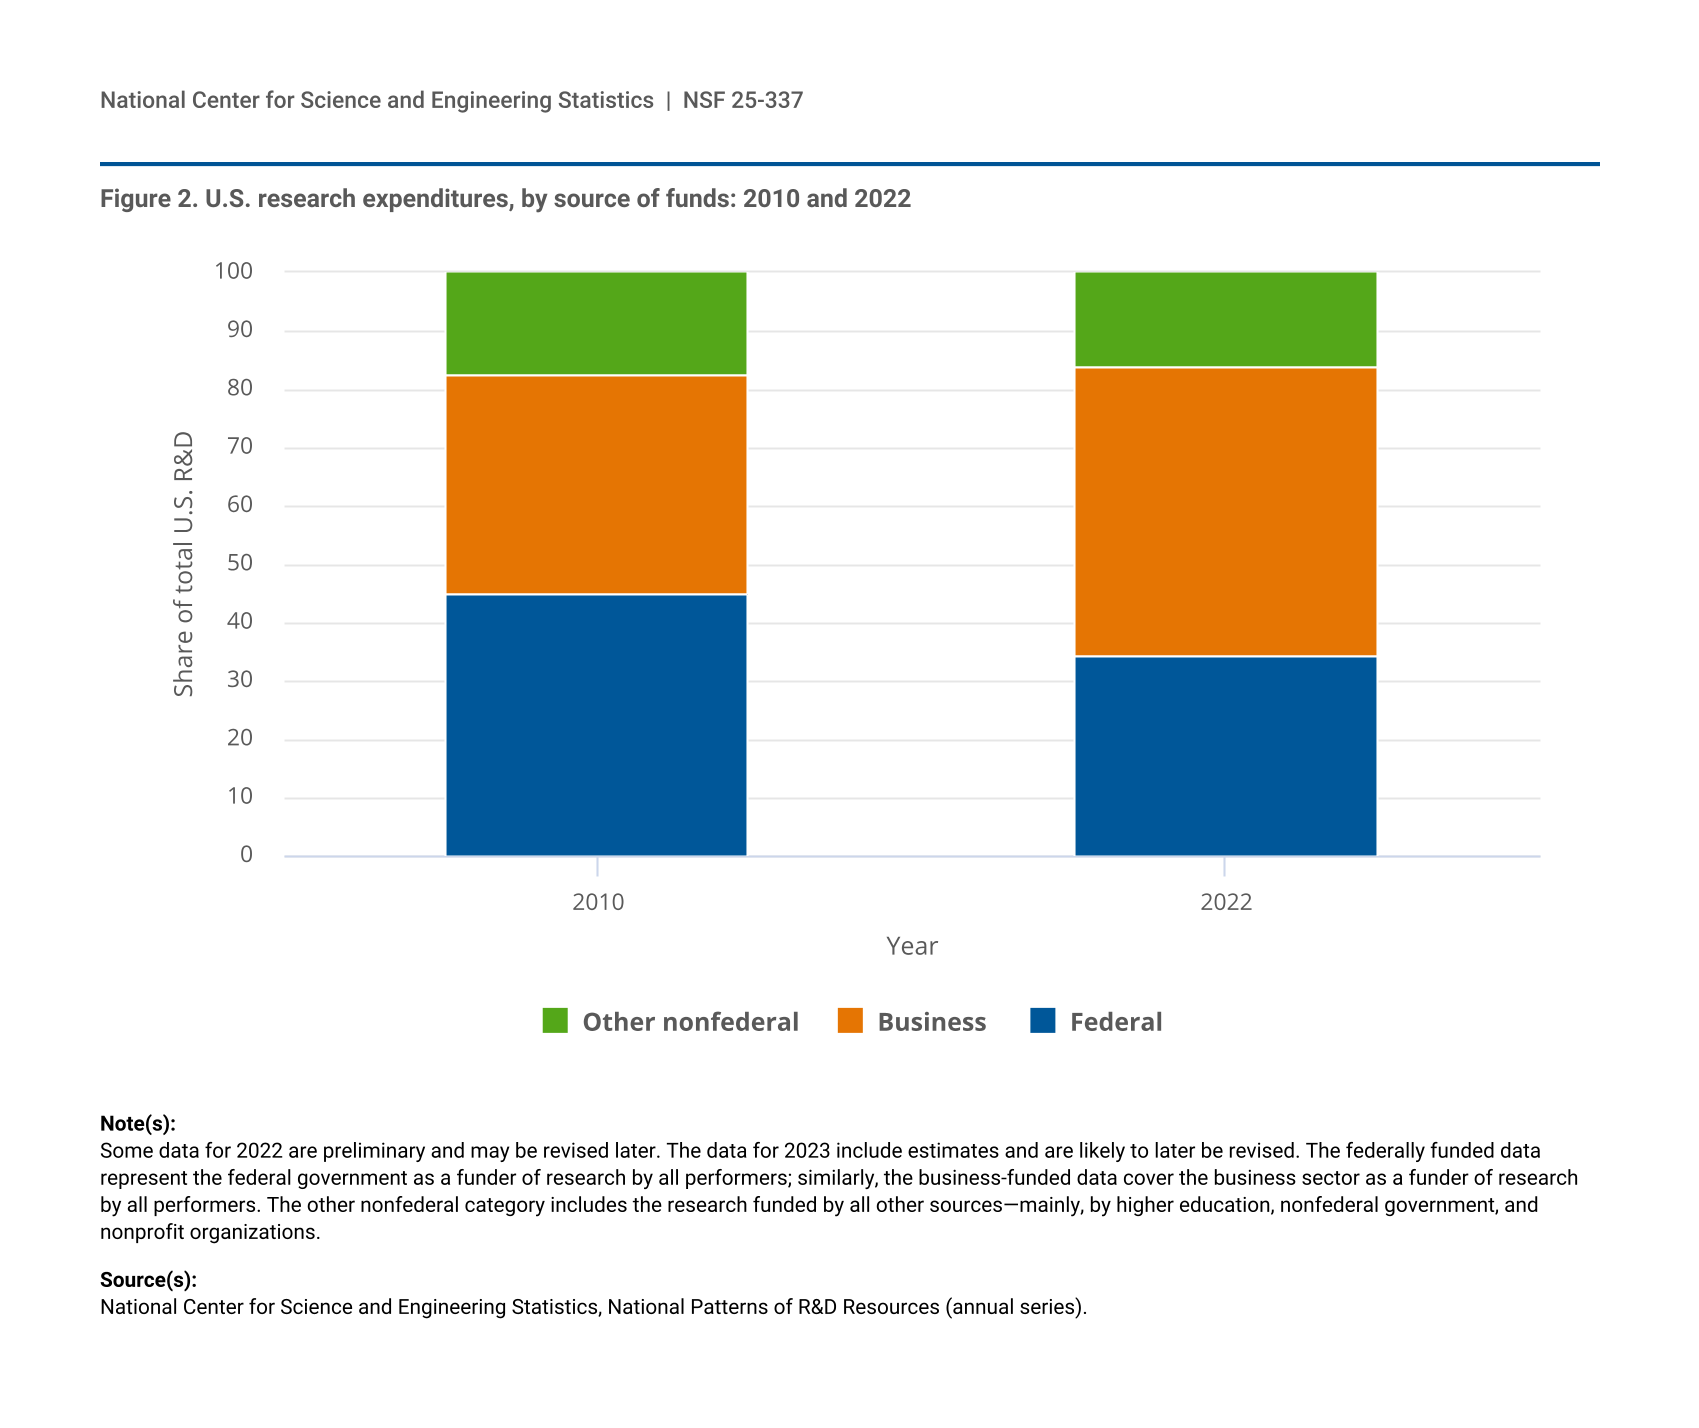
Some data for 2022 are preliminary and may be revised later. The data for 2023 include estimates and are likely to later be revised. The federally funded data represent the federal government as a funder of research by all performers; similarly, the business-funded data cover the business sector as a funder of research by all performers. The other nonfederal category includes the research funded by all other sources—mainly, by higher education, nonfederal government, and nonprofit organizations.
National Center for Science and Engineering Statistics, National Patterns of R&D Resources (annual series).
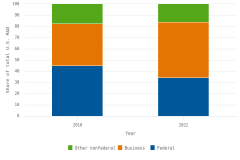
Despite increased federally funded research between 2010 ($78 billion) and 2022 ($85 billion), the overall share of U.S. domestic research funded by the federal government declined from 45% to 34%. This drop in the federal share is due to a comparatively larger increase in research funding from the business sector. Businesses funded 38% of research in 2010 and 50% of research in 2022. The share of research funded by other nonfederal sectors was 17% in 2010 and 16% in 2022.
The National Center for Science and Engineering Statistics (NCSES) has reviewed this product for unauthorized disclosure of confidential information and approved its release (NCSES-DRN25-009).
Suggested citation: National Center for Science and Engineering Statistics (NCSES). 2025. Federal Funding for Research Increased from 2010 to 2022, yet the Federal Government’s Share of Total Research Funding Declined. NSF 25-337. Alexandria, VA: U.S. National Science Foundation. Available at https://ncses.nsf.gov/pubs/nsf25337.