 An official website of the United States government
Open-Access Publishing in a Global Context
Open-access (OA) publications are peer-reviewed research articles that are accessible online to any reader without requiring a journal subscription or payment. These publications allow global researchers and other readers access to scientific research and have reshaped the structure of scientific publishing. Government and private funders, institutions, and scientists themselves are increasingly concerned with the availability of S&E publications through OA sources, with some funders requiring grantees to publish their results in OA journals. This InfoBrief explores global patterns of OA publication output and scientific impact from 2003 through 2022 using Scopus, a bibliometric database of publication metadata, which includes the OA status of research publications.
OA publications can be classified based on the level of access and temporality of access. Gold OA refers to journals that are entirely open access as a matter of policy. Other Journal-Based OA types include Hybrid OA, journals that publish a mix of Closed-access and OA articles, and Bronze OA, journals that make articles conditionally available (e.g., after an embargo period). Green OA denotes articles that are published in Closed-access journals but self-archived by authors in independently open repositories. Some journals may require authors to pay article processing charges for Gold OA, Hybrid OA, or Bronze OA—but not universally. Although an article may be available through multiple OA avenues, such as a Gold OA article that is also available as Green OA through a preprint archive for the purpose of analysis, articles are designated into mutually exclusive OA categories in order from Gold OA, Other Journal-Based OA (including Hybrid and Bronze), and Green OA. Closed-access articles are defined as those that are not available as any OA type. OA publication patterns vary among countries and economies and can reflect the prominence of OA as a mode of publication by authors at institutions within those countries and the international impact of OA publications.
Production of Open-Access Articles Over Time
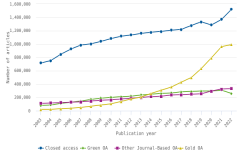
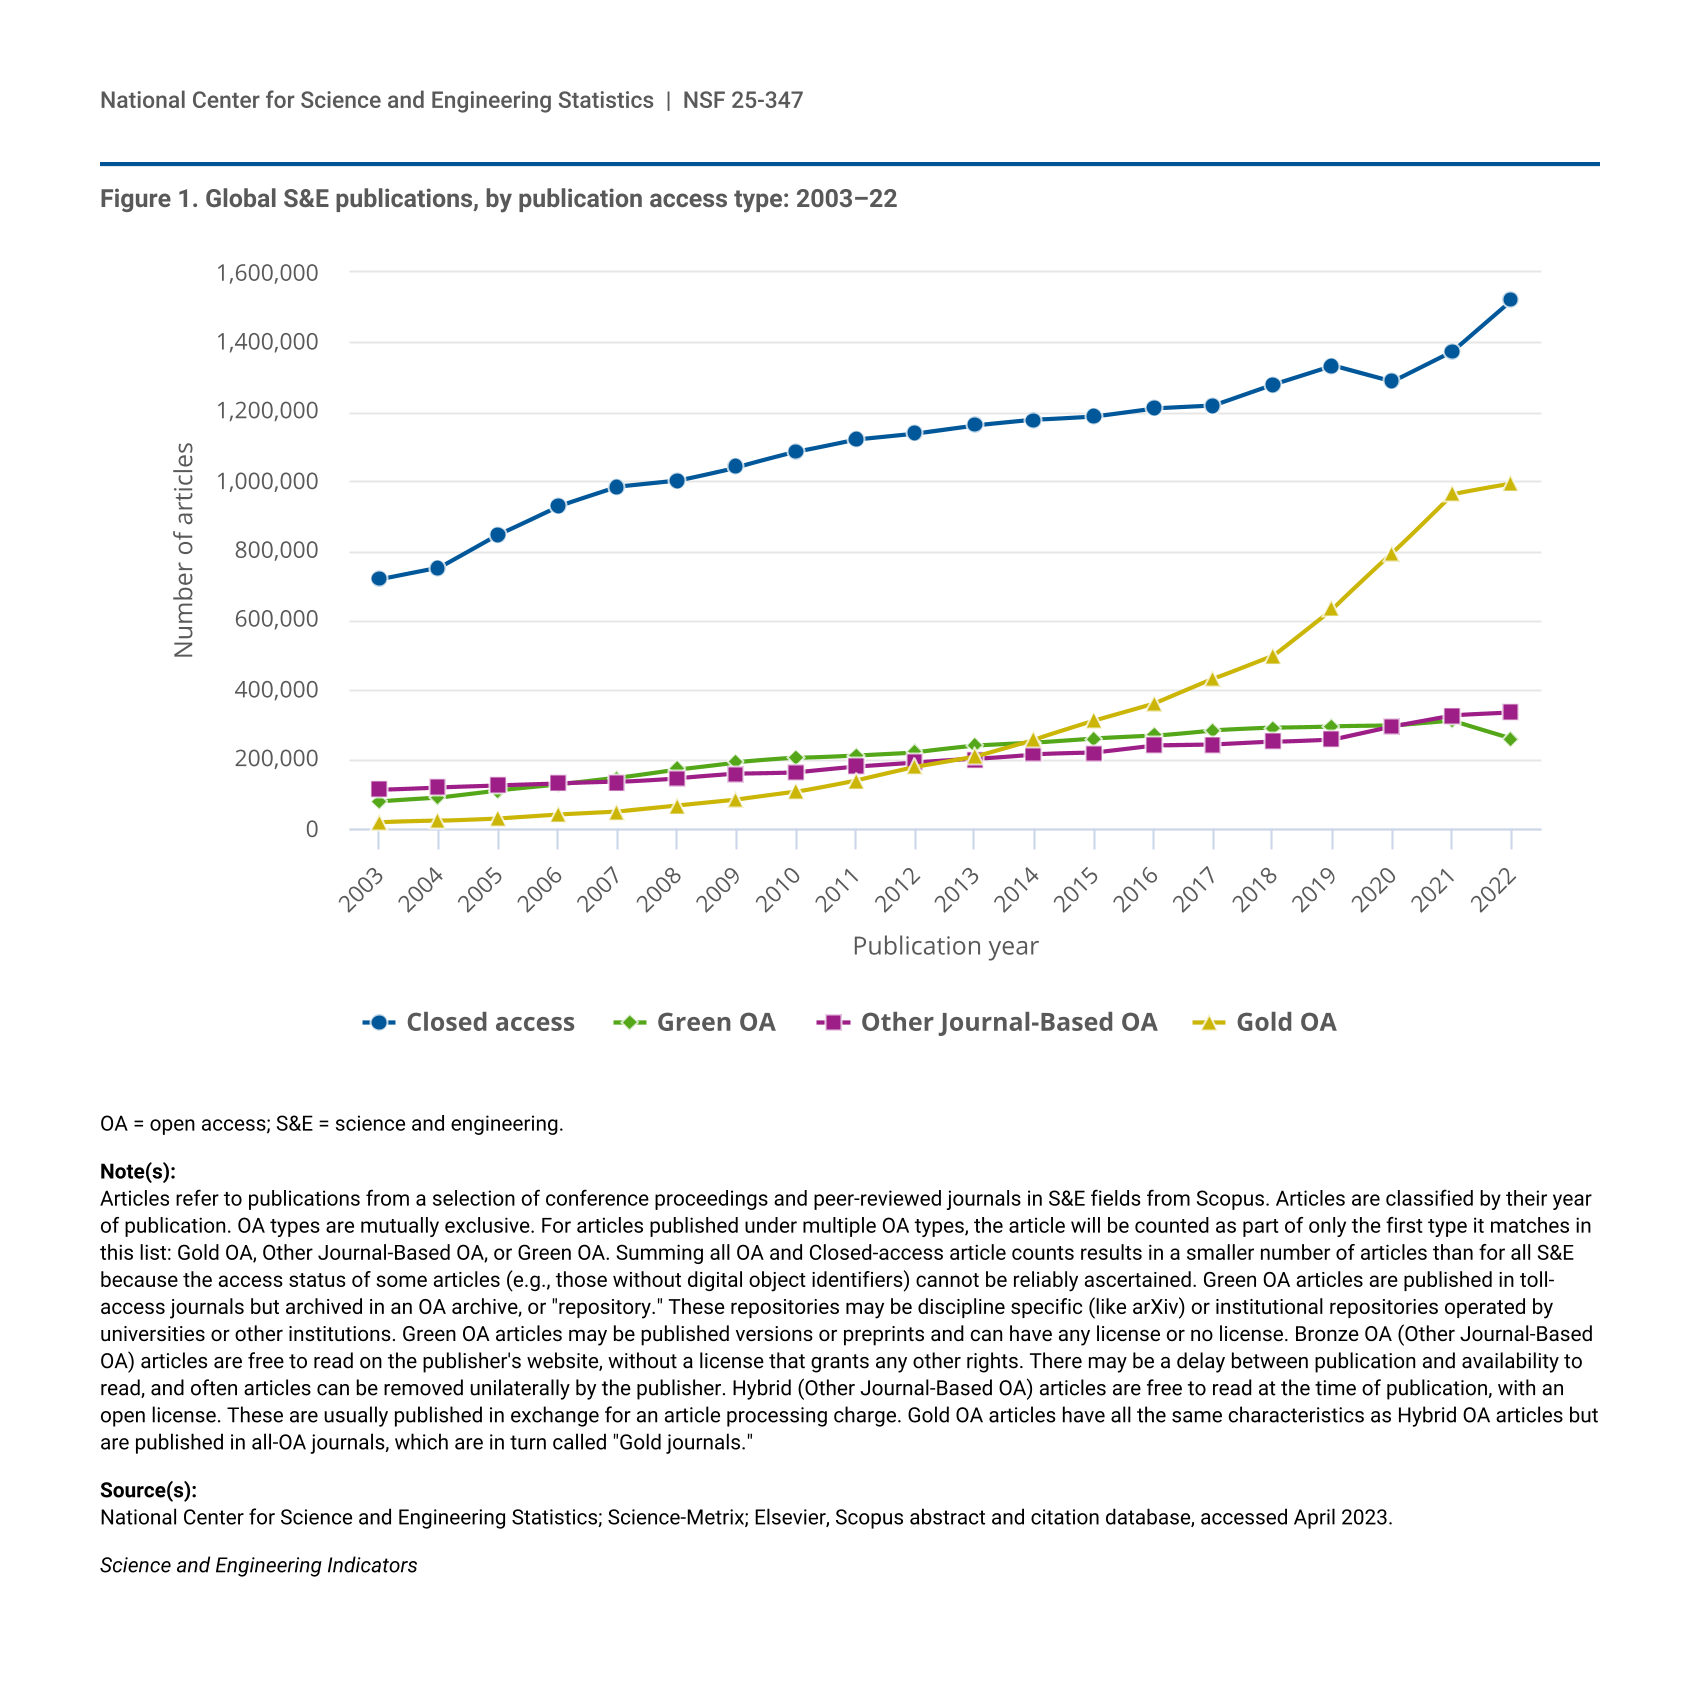
Since 2003, the number and share of OA articles has grown from an infrequent type of peer-reviewed publication to almost half of global publications in 2022. The total number of articles published as Gold OA has increased from 19,089, or 2% of global publications, in 2003 to 991,805, or 30% of all publications, in 2022 (figure 1). The share of Closed-access articles decreased from 58% of global publications in 2003 to 45% in 2022. However, during the same period, the number of Closed-access articles increased in absolute terms with a growth rate of 112%, compared to a growth rate of 5,096% in the number of Gold OA articles. The number of articles published annually as Green OA and Other Journal-Based OA grew by 228% and 198%, respectively. However, both Green OA (from 6% to 8%) and Other Journal-Based OA (from 9% to 10%) showed modest increases of their shares of articles published globally over the same period.
| Publication year | Closed access | Green OA | Other Journal-Based OA | Gold OA |
|---|---|---|---|---|
| 2003 | 716,290 | 79,136 | 111,900 | 19,089 |
| 2004 | 749,747 | 89,408 | 119,386 | 22,584 |
| 2005 | 846,261 | 110,069 | 124,548 | 30,095 |
| 2006 | 927,801 | 126,067 | 129,641 | 41,497 |
| 2007 | 983,096 | 145,872 | 134,450 | 49,937 |
| 2008 | 1,001,082 | 170,936 | 145,627 | 67,063 |
| 2009 | 1,040,201 | 191,714 | 158,239 | 83,949 |
| 2010 | 1,083,721 | 203,325 | 162,058 | 106,460 |
| 2011 | 1,119,780 | 211,503 | 178,121 | 139,931 |
| 2012 | 1,137,037 | 220,373 | 189,811 | 178,889 |
| 2013 | 1,160,217 | 238,154 | 200,600 | 208,857 |
| 2014 | 1,176,541 | 246,834 | 214,518 | 257,864 |
| 2015 | 1,186,666 | 259,016 | 218,231 | 310,487 |
| 2016 | 1,209,852 | 266,903 | 238,672 | 359,083 |
| 2017 | 1,217,879 | 283,349 | 241,314 | 430,867 |
| 2018 | 1,277,758 | 290,252 | 249,655 | 498,502 |
| 2019 | 1,332,273 | 294,347 | 257,418 | 634,366 |
| 2020 | 1,286,235 | 295,769 | 294,709 | 793,327 |
| 2021 | 1,372,042 | 310,619 | 325,757 | 962,403 |
| 2022 | 1,520,454 | 259,813 | 332,915 | 991,805 |
OA = open access; S&E = science and engineering.
Articles refer to publications from a selection of conference proceedings and peer-reviewed journals in S&E fields from Scopus. Articles are classified by their year of publication. OA types are mutually exclusive. For articles published under multiple OA types, the article will be counted as part of only the first type it matches in this list: Gold OA, Other Journal-Based OA, or Green OA. Summing all OA and Closed-access article counts results in a smaller number of articles than for all S&E because the access status of some articles (e.g., those without digital object identifiers) cannot be reliably ascertained. Green OA articles are published in toll-access journals but archived in an OA archive, or "repository." These repositories may be discipline specific (like arXiv) or institutional repositories operated by universities or other institutions. Green OA articles may be published versions or preprints and can have any license or no license. Bronze OA (Other Journal-Based OA) articles are free to read on the publisher's website, without a license that grants any other rights. There may be a delay between publication and availability to read, and often articles can be removed unilaterally by the publisher. Hybrid (Other Journal-Based OA) articles are free to read at the time of publication, with an open license. These are usually published in exchange for an article processing charge. Gold OA articles have all the same characteristics as Hybrid OA articles but are published in all-OA journals, which are in turn called "Gold journals."
National Center for Science and Engineering Statistics; Science-Metrix; Elsevier, Scopus abstract and citation database, accessed April 2023.
Science and Engineering Indicators
Country-Level Ratios of Gold Open-Access to Closed-Access Publications
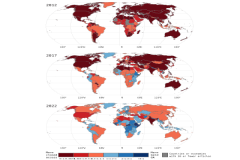
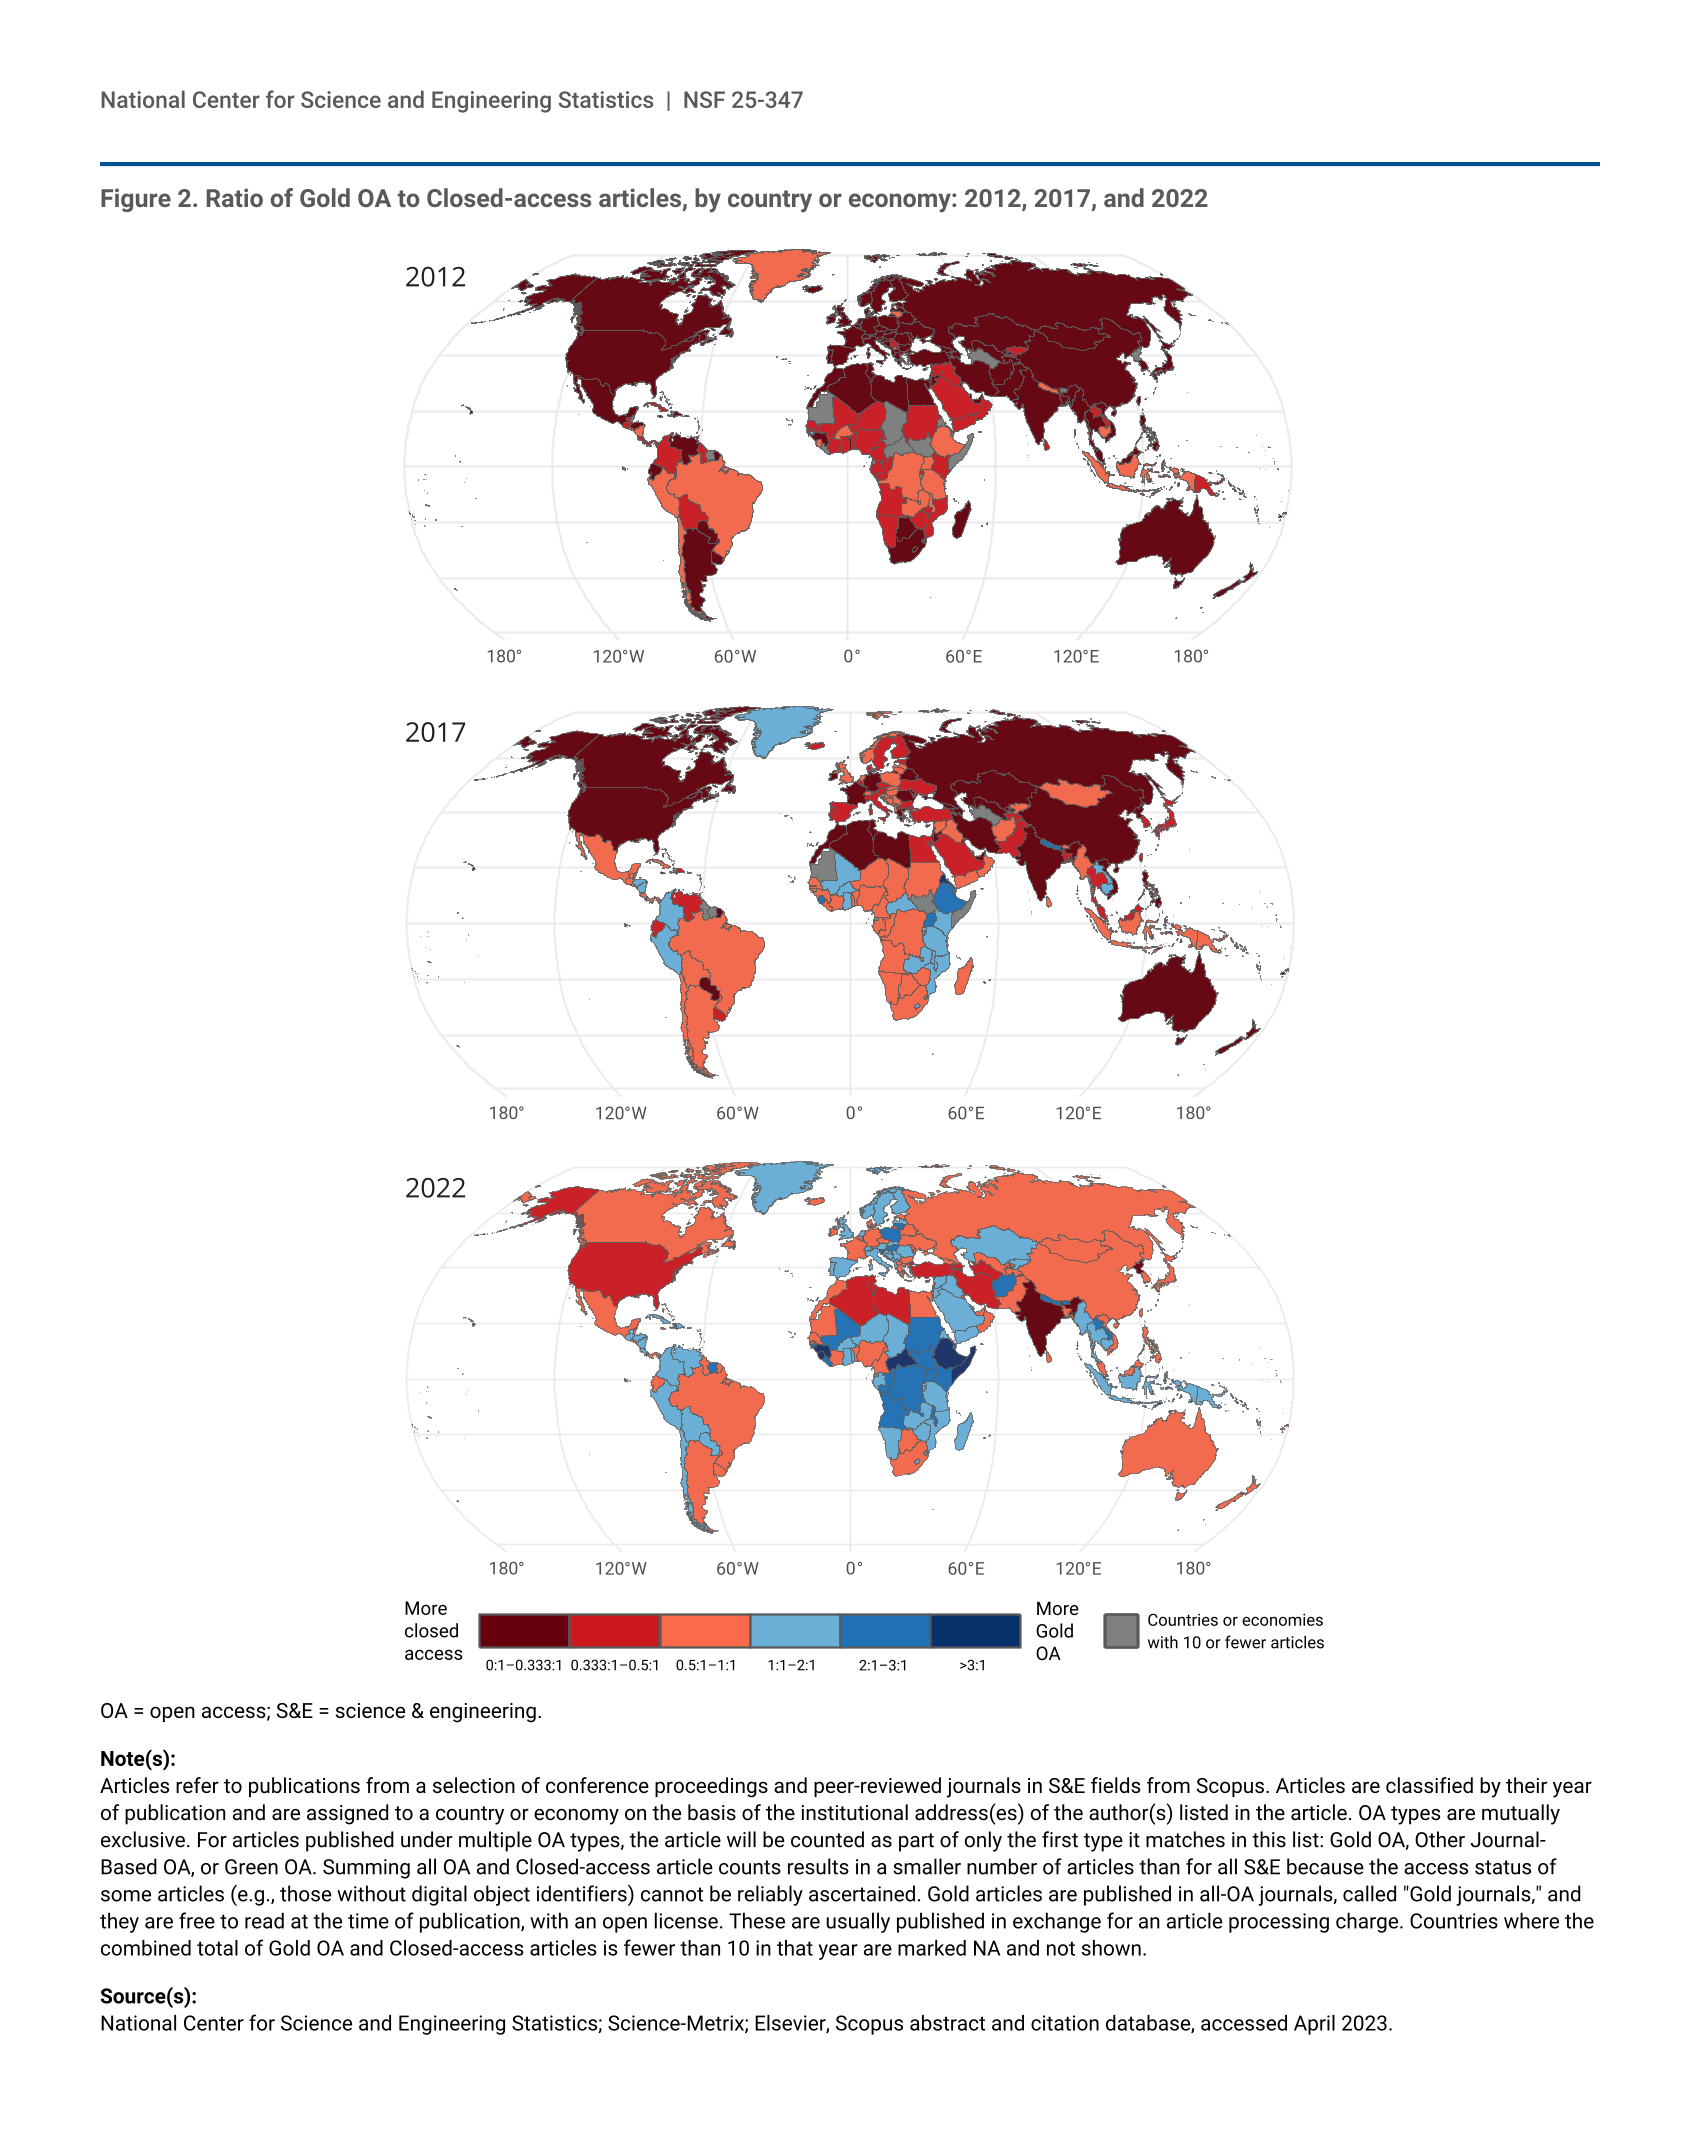
Global variation in the shares of Gold OA and Closed-access publications within countries and economies helps highlight geographical patterns in the tendency to publish Gold OA. The maps in figure 2 highlight this variation by showing country- or economy-level ratios between Gold OA publications and Closed-access publications. To calculate the ratio for each, the country- or economy-level number of Gold OA publications was divided by the number of Closed-access publications each year as a fractional count. The scale is centered around a 1:1 ratio. Ratios between 0:1 and 1:1 indicate authors publish Closed-access articles more frequently than Gold OA, while ratios over 1:1 indicate authors publish Gold OA articles more frequently than Closed access. Countries or economies with fewer than 10 fractionally counted publications (Gold OA and Closed-access articles combined) are excluded. This resulted in an analytic population of 159 countries or economies in 2012, 167 in 2017, and 182 in 2022.
OA = open access; S&E = science & engineering.
Articles refer to publications from a selection of conference proceedings and peer-reviewed journals in S&E fields from Scopus. Articles are classified by their year of publication and are assigned to a country or economy on the basis of the institutional address(es) of the author(s) listed in the article. OA types are mutually exclusive. For articles published under multiple OA types, the article will be counted as part of only the first type it matches in this list: Gold OA, Other Journal-Based OA, or Green OA. Summing all OA and Closed-access article counts results in a smaller number of articles than for all S&E because the access status of some articles (e.g., those without digital object identifiers) cannot be reliably ascertained. Gold articles are published in all-OA journals, called "Gold journals," and they are free to read at the time of publication, with an open license. These are usually published in exchange for an article processing charge. Countries where the combined total of Gold OA and Closed-access articles is fewer than 10 in that year are marked NA and not shown.
National Center for Science and Engineering Statistics; Science-Metrix; Elsevier, Scopus abstract and citation database, accessed April 2023.
Green OA and Other Journal-Based OA were excluded from the ratio because their modes of access and payment make them less directly comparable to Closed-access publications. For example, a Green OA publication may appear in a journal that is otherwise Closed access. However, Gold OA and Closed-access publications are more directly comparable because they both have internally consistent and opposite modes of access and payment: a journal can be either entirely open (Gold OA) or entirely closed (Closed access) to readers.
Across the three select years (2012, 2017, and 2022), many countries or economies shifted from publishing more Closed-access articles to more Gold OA articles, underscoring the overall global growth in the share of Gold OA. In 2012, 99% (n = 157) of countries with more than 10 fractionally counted publications had a ratio favoring Closed-access journals (i.e., published more Closed-access articles relative to Gold OA articles) (figure 2).
In 2017, this percentage decreased to 85% (n = 142), then decreased more sharply again to 46% (n = 83) in 2022 (figure 2). At the same time, there was an increase in the number of countries or economies favoring Gold OA publications. In 2012, only 2 countries (The Gambia and Guinea-Bissau) had a Gold OA ratio greater than 1:1, and in 2017, 25 countries (15%) had a ratio greater than 1:1. Accordingly, by 2022, the balance tilted such that more than half of countries (54%, n = 99) had ratios favoring Gold OA publications.
Even though 46% of countries or economies continued to have a ratio favoring Closed-access journals through 2022, including the three largest producers (China, the United States, and India), the proportion of countries with a ratio of 0:1 to 0.333:1 fractionally counted Gold OA publications has decreased. In 2012, 65% of countries or economies (n = 103) were in this category, a proportion that fell to 26% (n = 43) in 2017, and then decreased again to only 2% of countries (n = 3) in 2022 (India, North Korea, and Mauritius). There was also an increase in the proportion of countries or economies moving into higher ratios of Gold OA (i.e., ratios of 2:1 to greater than 3:1 fractionally counted Gold OA publications). In 2012, there was only one country (The Gambia) with a 2:1 Gold OA ratio. However, in 2017, there were six countries with a 2:1 or greater ratio, and in 2022 there were 30 countries with a 2:1 or greater ratio.
Open-Access Articles by Income Group
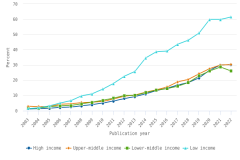
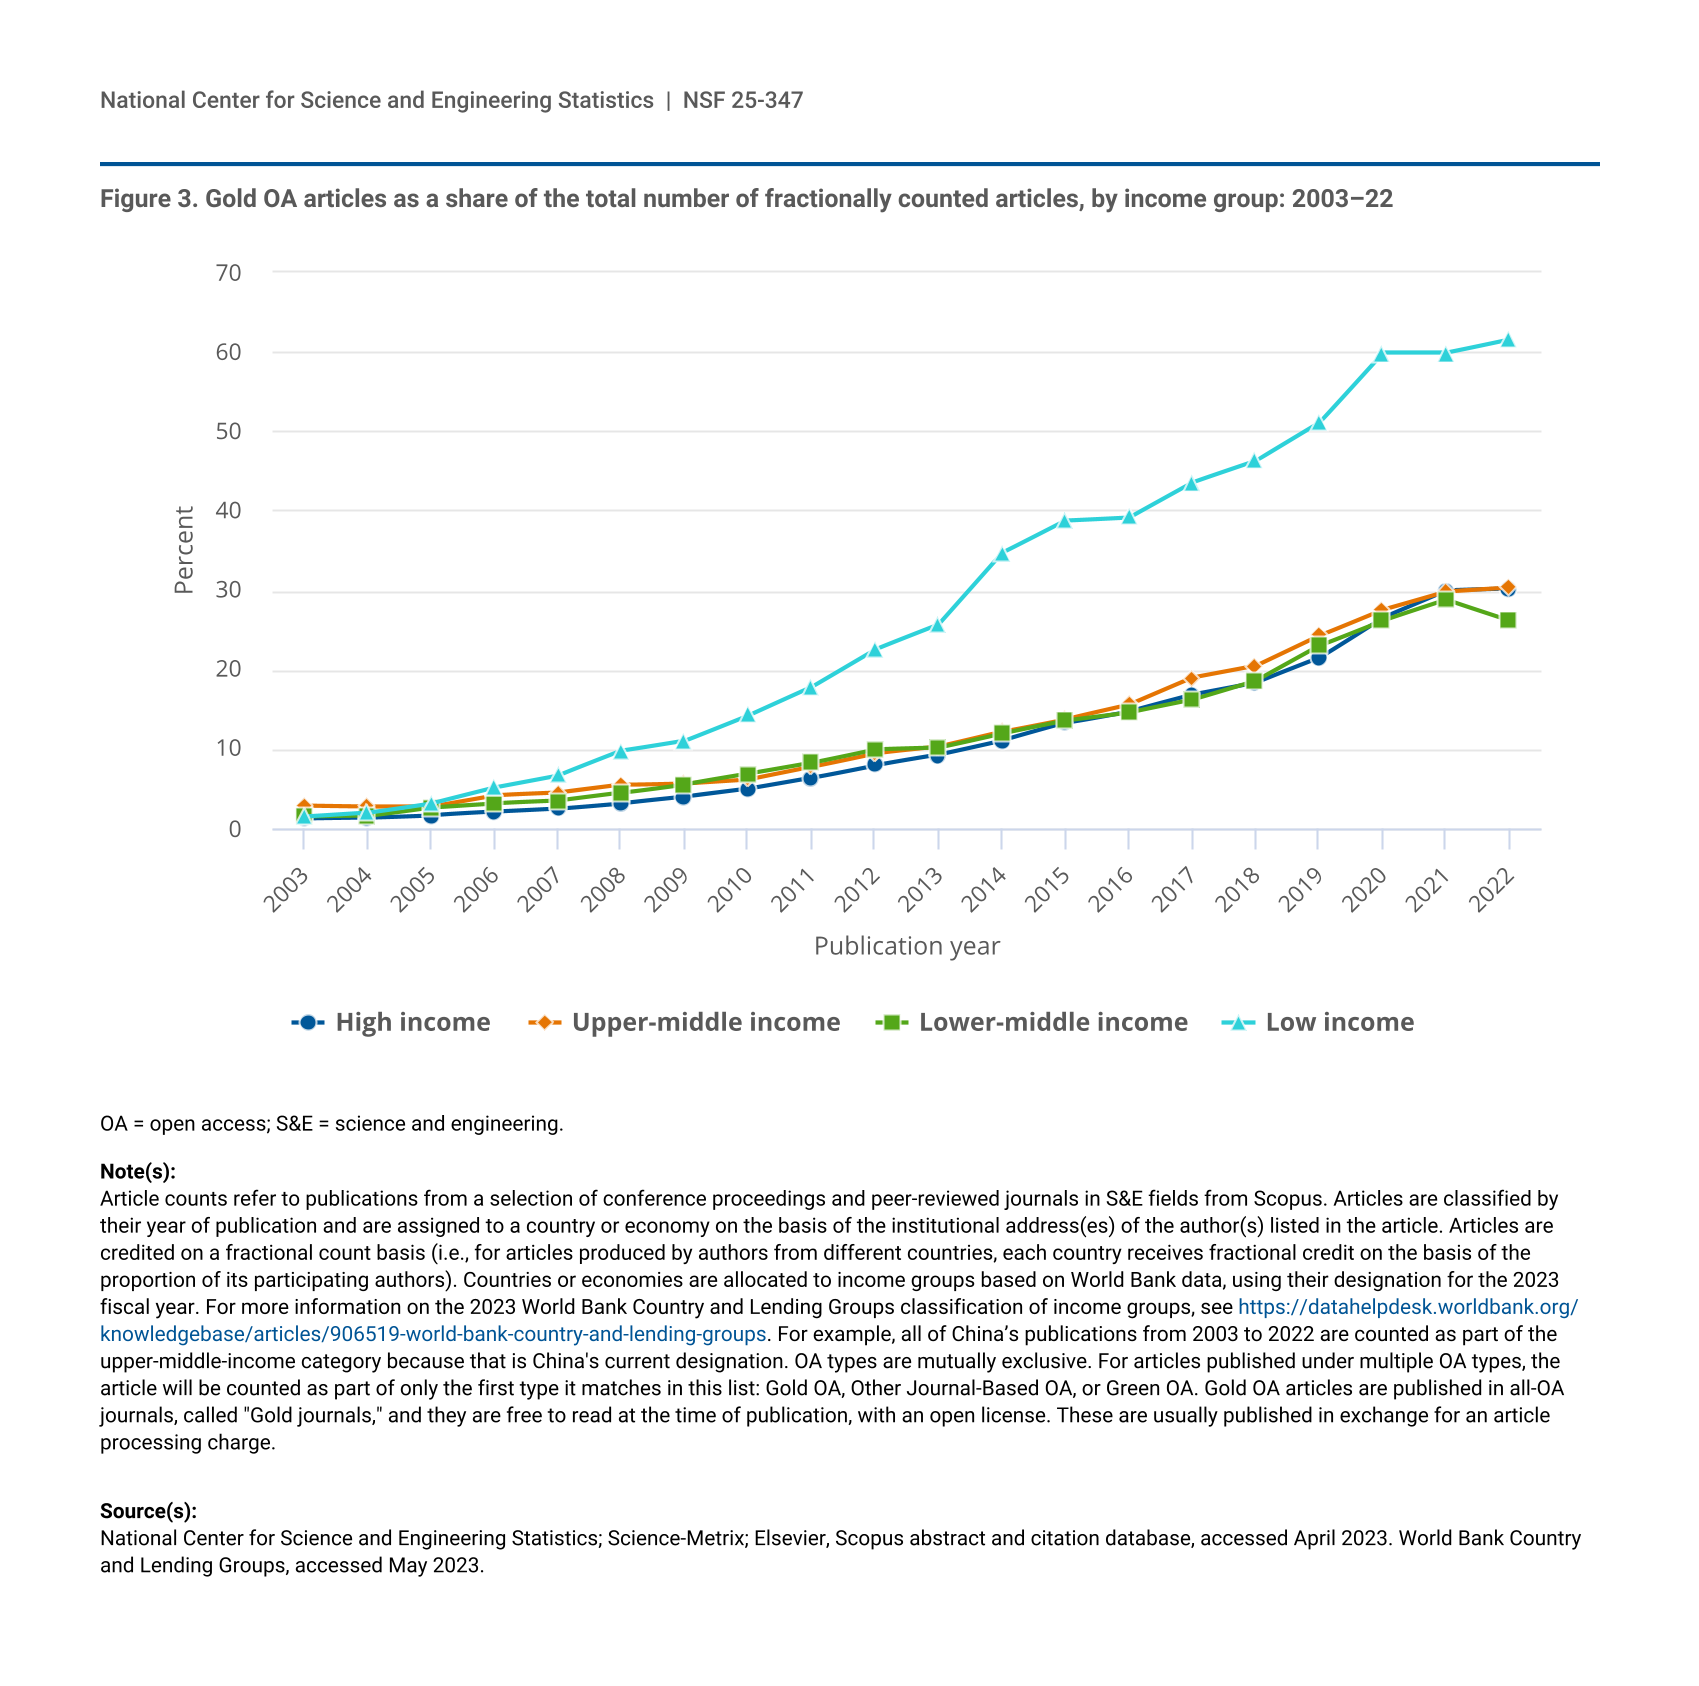
In 2022, the share of articles published Gold OA by authors from high-income (30%) and upper middle-income countries or economies (30%) were similar; those from lower middle-income countries (26%) published a smaller share. These percentages are the culmination of a gradual increase in the proportion of Gold OA articles for countries or economies in the high-, upper middle-, and lower middle-income groups over time, increasing from the 1% to 3% of articles published as Gold OA in 2003 by these income groups (figure 3). The percentage of Gold OA articles published by authors in low-income countries grew from 2% of articles published as Gold OA in 2003 to 62% in 2022, more rapidly than their high-, upper middle-, and lower middle-income counterparts.
| Publication year | High income | Upper-middle income | Lower-middle income | Low income |
|---|---|---|---|---|
| 2003 | 1.3 | 2.9 | 1.5 | 1.5 |
| 2004 | 1.4 | 2.8 | 1.6 | 2.0 |
| 2005 | 1.7 | 2.8 | 2.7 | 3.2 |
| 2006 | 2.1 | 4.2 | 3.2 | 5.2 |
| 2007 | 2.5 | 4.5 | 3.5 | 6.7 |
| 2008 | 3.2 | 5.5 | 4.5 | 9.8 |
| 2009 | 4.0 | 5.7 | 5.6 | 11.1 |
| 2010 | 5.0 | 6.2 | 6.9 | 14.3 |
| 2011 | 6.4 | 7.8 | 8.3 | 17.9 |
| 2012 | 8.0 | 9.5 | 10.0 | 22.6 |
| 2013 | 9.3 | 10.3 | 10.2 | 25.7 |
| 2014 | 11.1 | 12.2 | 12.0 | 34.7 |
| 2015 | 13.3 | 13.8 | 13.6 | 38.8 |
| 2016 | 14.8 | 15.6 | 14.6 | 39.2 |
| 2017 | 16.9 | 19.0 | 16.2 | 43.6 |
| 2018 | 18.4 | 20.5 | 18.6 | 46.3 |
| 2019 | 21.5 | 24.3 | 23.0 | 51.1 |
| 2020 | 26.6 | 27.6 | 26.2 | 59.9 |
| 2021 | 30.0 | 29.9 | 28.8 | 59.9 |
| 2022 | 30.2 | 30.4 | 26.2 | 61.6 |
OA = open access; S&E = science and engineering.
Article counts refer to publications from a selection of conference proceedings and peer-reviewed journals in S&E fields from Scopus. Articles are classified by their year of publication and are assigned to a country or economy on the basis of the institutional address(es) of the author(s) listed in the article. Articles are credited on a fractional count basis (i.e., for articles produced by authors from different countries, each country receives fractional credit on the basis of the proportion of its participating authors). Countries or economies are allocated to income groups based on World Bank data, using their designation for the 2023 fiscal year. For more information on the 2023 World Bank Country and Lending Groups classification of income groups, see https://datahelpdesk.worldbank.org/knowledgebase/articles/906519-world-bank-country-and-lending-groups. For example, all of China’s publications from 2003 to 2022 are counted as part of the upper-middle-income category because that is China's current designation. OA types are mutually exclusive. For articles published under multiple OA types, the article will be counted as part of only the first type it matches in this list: Gold OA, Other Journal-Based OA, or Green OA. Gold OA articles are published in all-OA journals, called "Gold journals," and they are free to read at the time of publication, with an open license. These are usually published in exchange for an article processing charge.
National Center for Science and Engineering Statistics; Science-Metrix; Elsevier, Scopus abstract and citation database, accessed April 2023. World Bank Country and Lending Groups, accessed May 2023.
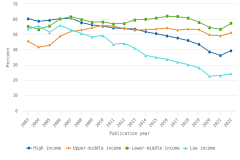
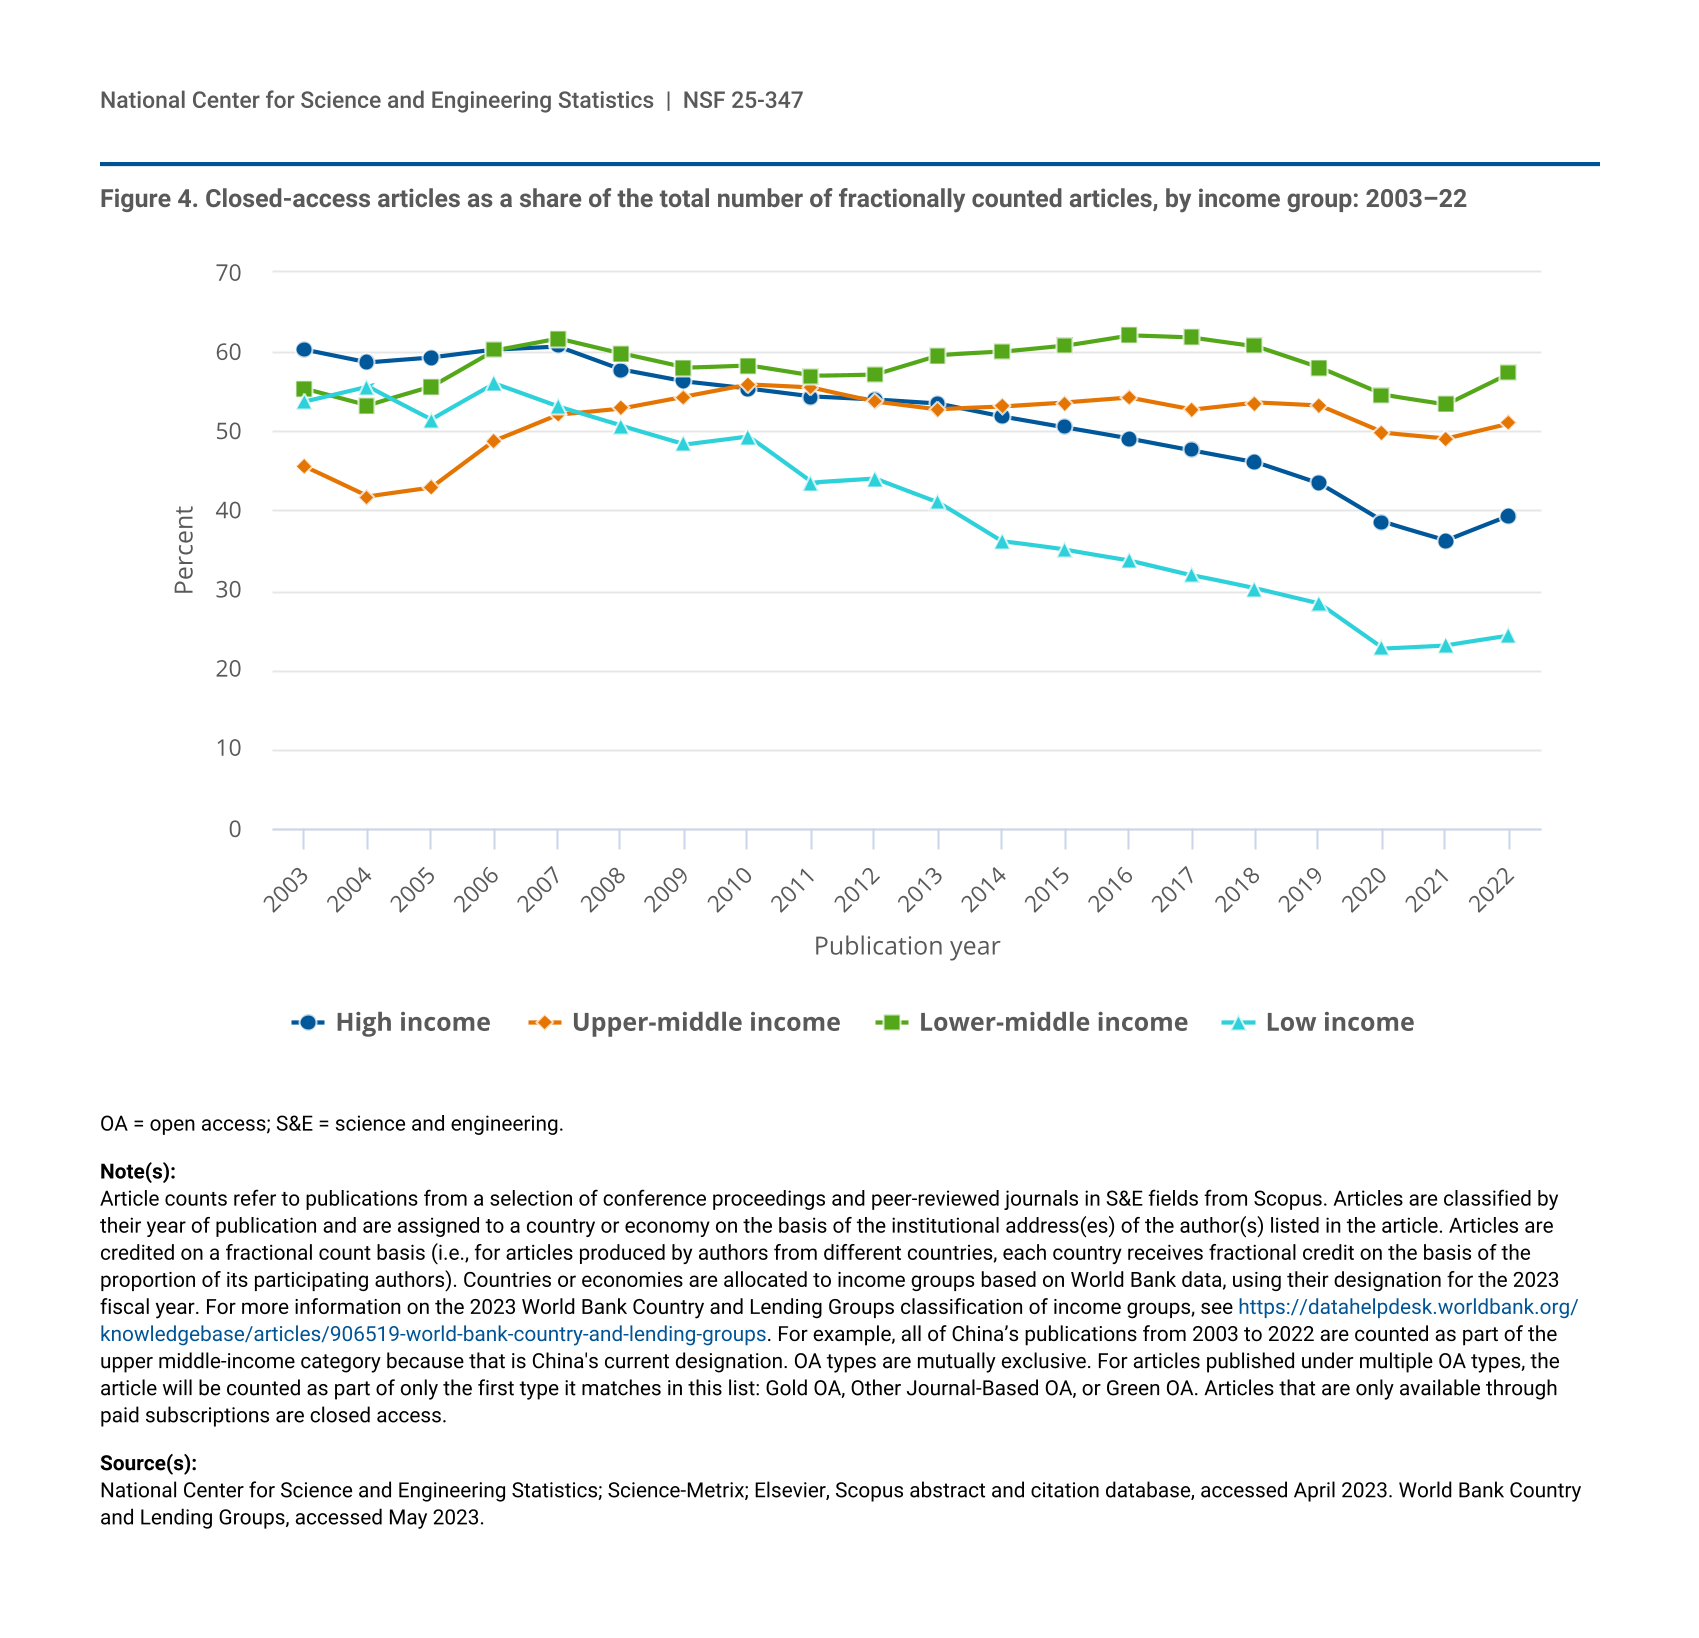
In 2022, Closed-access articles constituted a smaller share of the publications by authors from low-income countries (24%) than from high- (39%), upper middle- (51%), or lower middle-income countries or economies (57%) (figure 4). From 2003 to 2022, the share of Closed-access articles decreased in both low-income and high-income countries from over half of their publications in 2003. The share of Closed-access articles published by authors from lower middle-income countries was also over half in 2003, but it fluctuated with a low of 53% in 2004 and a high of 62% in 2016. On the other hand, the share of Closed-access publications for upper middle-income countries increased (though inconsistently) from 46% in 2003 to 51% in 2022.
| Publication year | High income | Upper-middle income | Lower-middle income | Low income |
|---|---|---|---|---|
| 2003 | 60.3 | 45.6 | 55.4 | 53.7 |
| 2004 | 58.7 | 41.8 | 53.3 | 55.6 |
| 2005 | 59.3 | 42.9 | 55.6 | 51.5 |
| 2006 | 60.3 | 48.8 | 60.2 | 56.0 |
| 2007 | 60.7 | 52.1 | 61.7 | 53.1 |
| 2008 | 57.8 | 52.9 | 59.8 | 50.7 |
| 2009 | 56.3 | 54.4 | 58.0 | 48.4 |
| 2010 | 55.4 | 55.9 | 58.3 | 49.4 |
| 2011 | 54.4 | 55.5 | 57.0 | 43.6 |
| 2012 | 54.0 | 53.8 | 57.2 | 44.1 |
| 2013 | 53.5 | 52.8 | 59.6 | 41.1 |
| 2014 | 51.9 | 53.1 | 60.0 | 36.2 |
| 2015 | 50.5 | 53.6 | 60.8 | 35.1 |
| 2016 | 49.1 | 54.2 | 62.1 | 33.8 |
| 2017 | 47.6 | 52.7 | 61.8 | 31.9 |
| 2018 | 46.1 | 53.6 | 60.7 | 30.2 |
| 2019 | 43.4 | 53.2 | 58.0 | 28.3 |
| 2020 | 38.6 | 49.8 | 54.6 | 22.7 |
| 2021 | 36.3 | 49.1 | 53.4 | 23.1 |
| 2022 | 39.4 | 51.0 | 57.3 | 24.3 |
OA = open access; S&E = science and engineering.
Article counts refer to publications from a selection of conference proceedings and peer-reviewed journals in S&E fields from Scopus. Articles are classified by their year of publication and are assigned to a country or economy on the basis of the institutional address(es) of the author(s) listed in the article. Articles are credited on a fractional count basis (i.e., for articles produced by authors from different countries, each country receives fractional credit on the basis of the proportion of its participating authors). Countries or economies are allocated to income groups based on World Bank data, using their designation for the 2023 fiscal year. For more information on the 2023 World Bank Country and Lending Groups classification of income groups, see https://datahelpdesk.worldbank.org/knowledgebase/articles/906519-world-bank-country-and-lending-groups. For example, all of China’s publications from 2003 to 2022 are counted as part of the upper middle-income category because that is China's current designation. OA types are mutually exclusive. For articles published under multiple OA types, the article will be counted as part of only the first type it matches in this list: Gold OA, Other Journal-Based OA, or Green OA. Articles that are only available through paid subscriptions are closed access.
National Center for Science and Engineering Statistics; Science-Metrix; Elsevier, Scopus abstract and citation database, accessed April 2023. World Bank Country and Lending Groups, accessed May 2023.
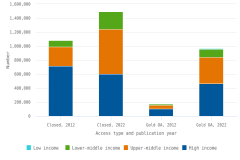
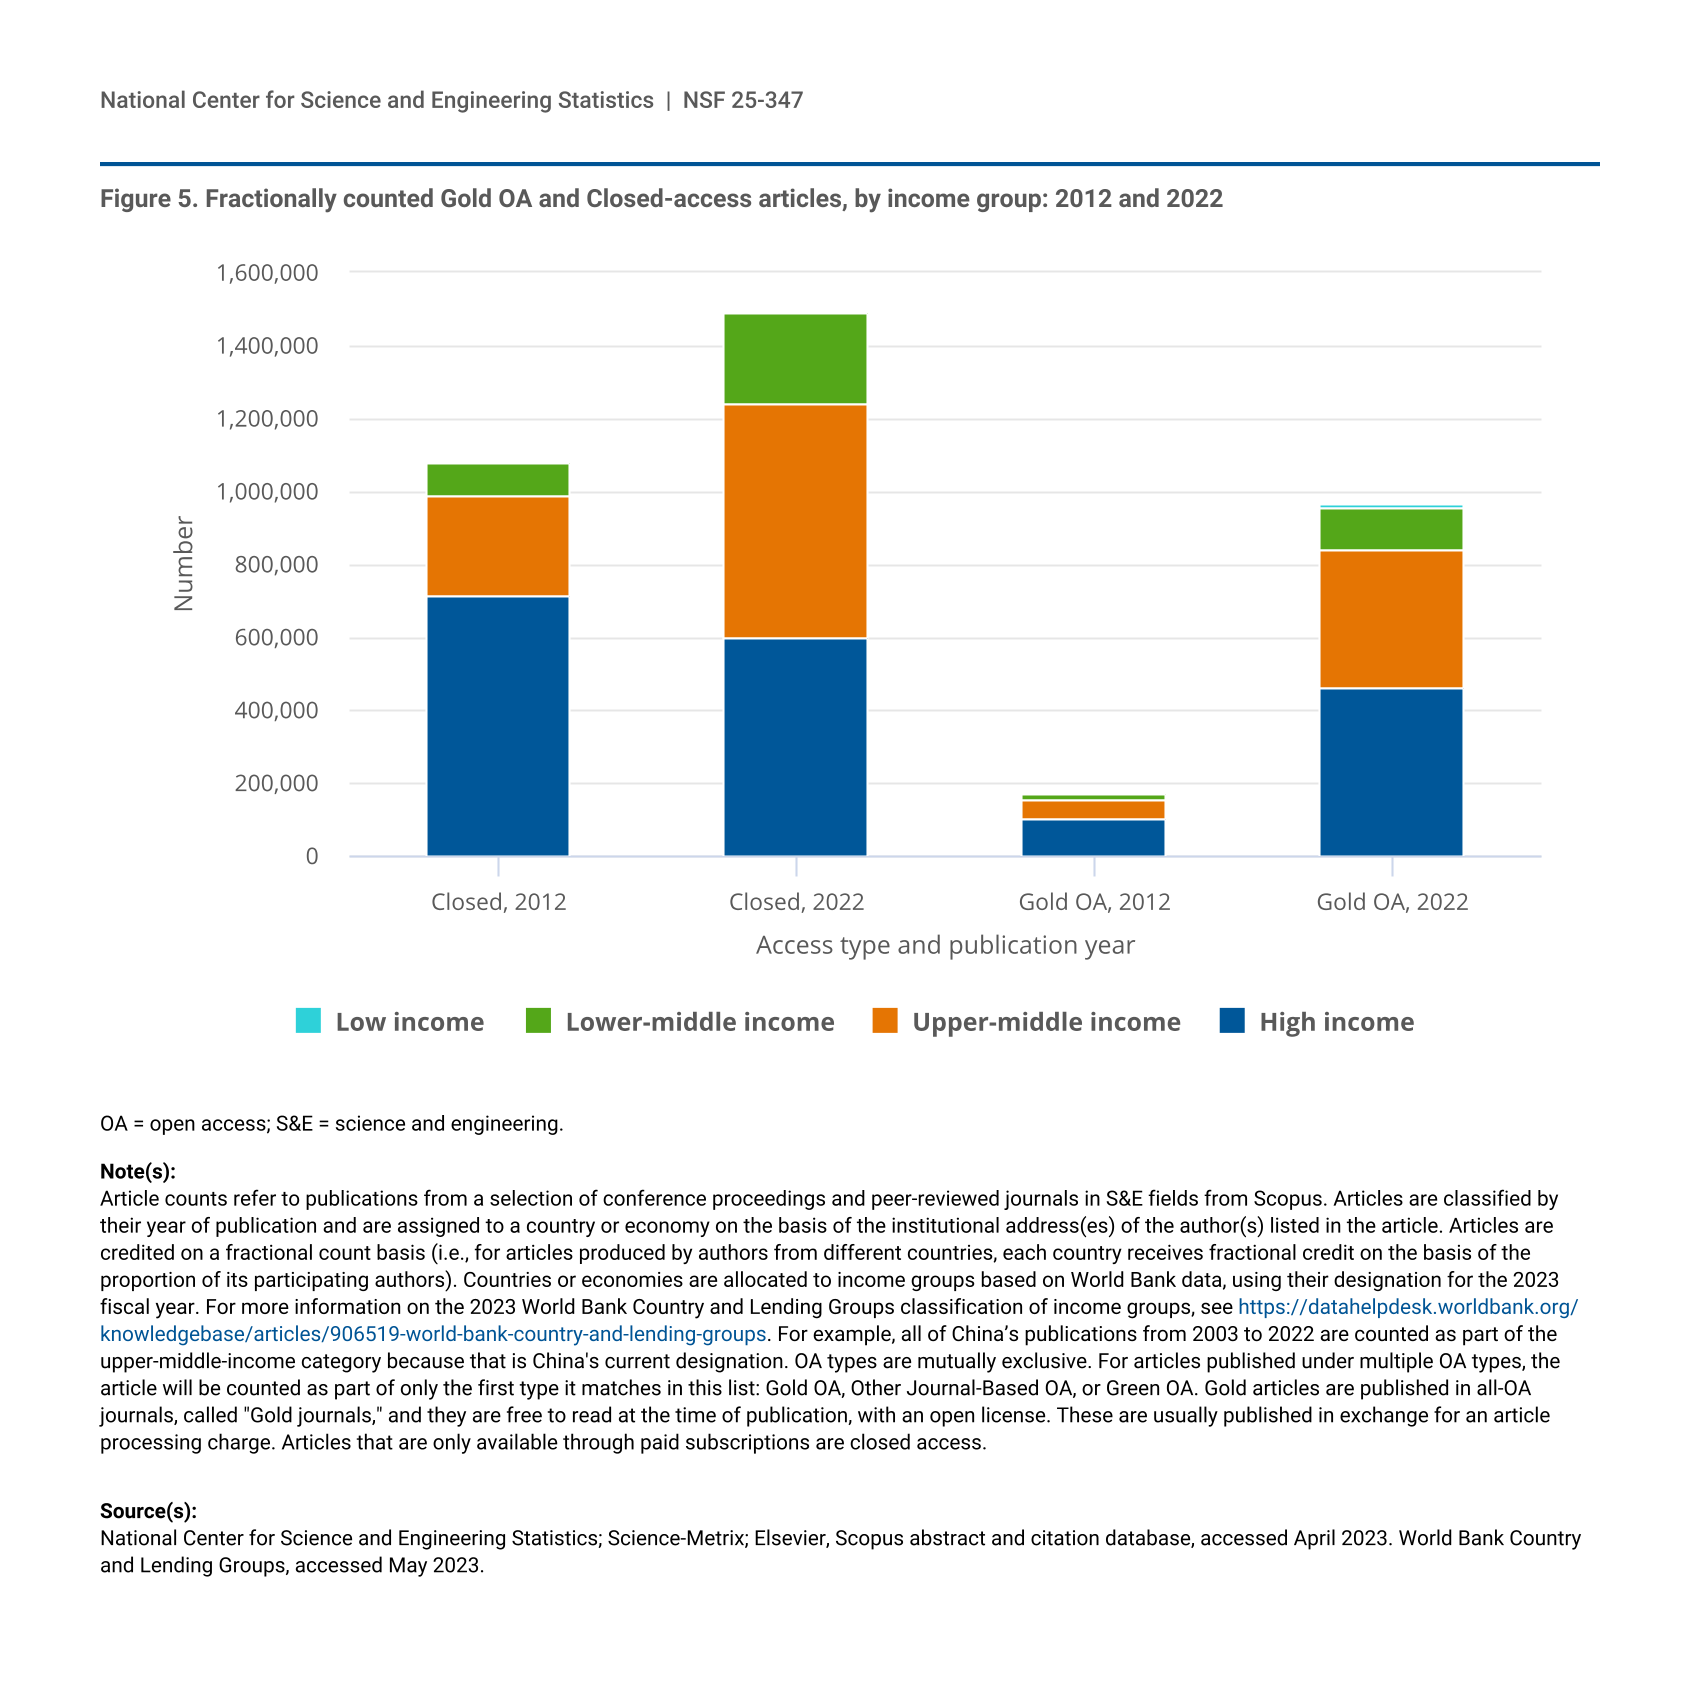
By 2022, 62% of articles from low-income countries were published Gold OA. But even though Gold OA publications are a large share of publications among low-income countries, authors in these nations do not produce a large share of global Gold OA publications. High-income countries or economies produced 460,979 (48%) fractionally counted Gold OA publications in 2022, and upper middle-income countries produced 381,556 (40%) Gold OA articles, collectively representing 87% of worldwide Gold OA articles (figure 5). Low-income countries produced 8,132 fractionally counted Gold OA articles, less than 1% of the Gold OA articles published worldwide. Between 2012 and 2022, the fractional counts of both Closed-access articles and Gold OA articles increased due to the general increase in publication output. However, the growth in the number of Gold OA articles outpaced the growth in the number of Closed-access articles in low-, lower middle-, and upper middle-income countries, while in high-income countries or economies, the number of Closed-access articles decreased by 16% between 2012 and 2022.
| Access type and publication year | High income | Upper-middle income | Lower-middle income | Low income |
|---|---|---|---|---|
| Closed, 2012 | 713,380 | 277,645 | 89,153 | 1,240 |
| Closed, 2022 | 600,091 | 640,190 | 248,561 | 3,210 |
| Gold OA, 2012 | 105,552 | 49,185 | 15,562 | 636 |
| Gold OA, 2022 | 460,979 | 381,556 | 113,715 | 8,132 |
OA = open access; S&E = science and engineering.
Article counts refer to publications from a selection of conference proceedings and peer-reviewed journals in S&E fields from Scopus. Articles are classified by their year of publication and are assigned to a country or economy on the basis of the institutional address(es) of the author(s) listed in the article. Articles are credited on a fractional count basis (i.e., for articles produced by authors from different countries, each country receives fractional credit on the basis of the proportion of its participating authors). Countries or economies are allocated to income groups based on World Bank data, using their designation for the 2023 fiscal year. For more information on the 2023 World Bank Country and Lending Groups classification of income groups, see https://datahelpdesk.worldbank.org/knowledgebase/articles/906519-world-bank-country-and-lending-groups. For example, all of China’s publications from 2003 to 2022 are counted as part of the upper-middle-income category because that is China's current designation. OA types are mutually exclusive. For articles published under multiple OA types, the article will be counted as part of only the first type it matches in this list: Gold OA, Other Journal-Based OA, or Green OA. Gold articles are published in all-OA journals, called "Gold journals," and they are free to read at the time of publication, with an open license. These are usually published in exchange for an article processing charge. Articles that are only available through paid subscriptions are closed access.
National Center for Science and Engineering Statistics; Science-Metrix; Elsevier, Scopus abstract and citation database, accessed April 2023. World Bank Country and Lending Groups, accessed May 2023.
Open-Access Articles by Selected Country or Economy
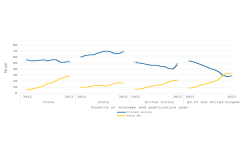
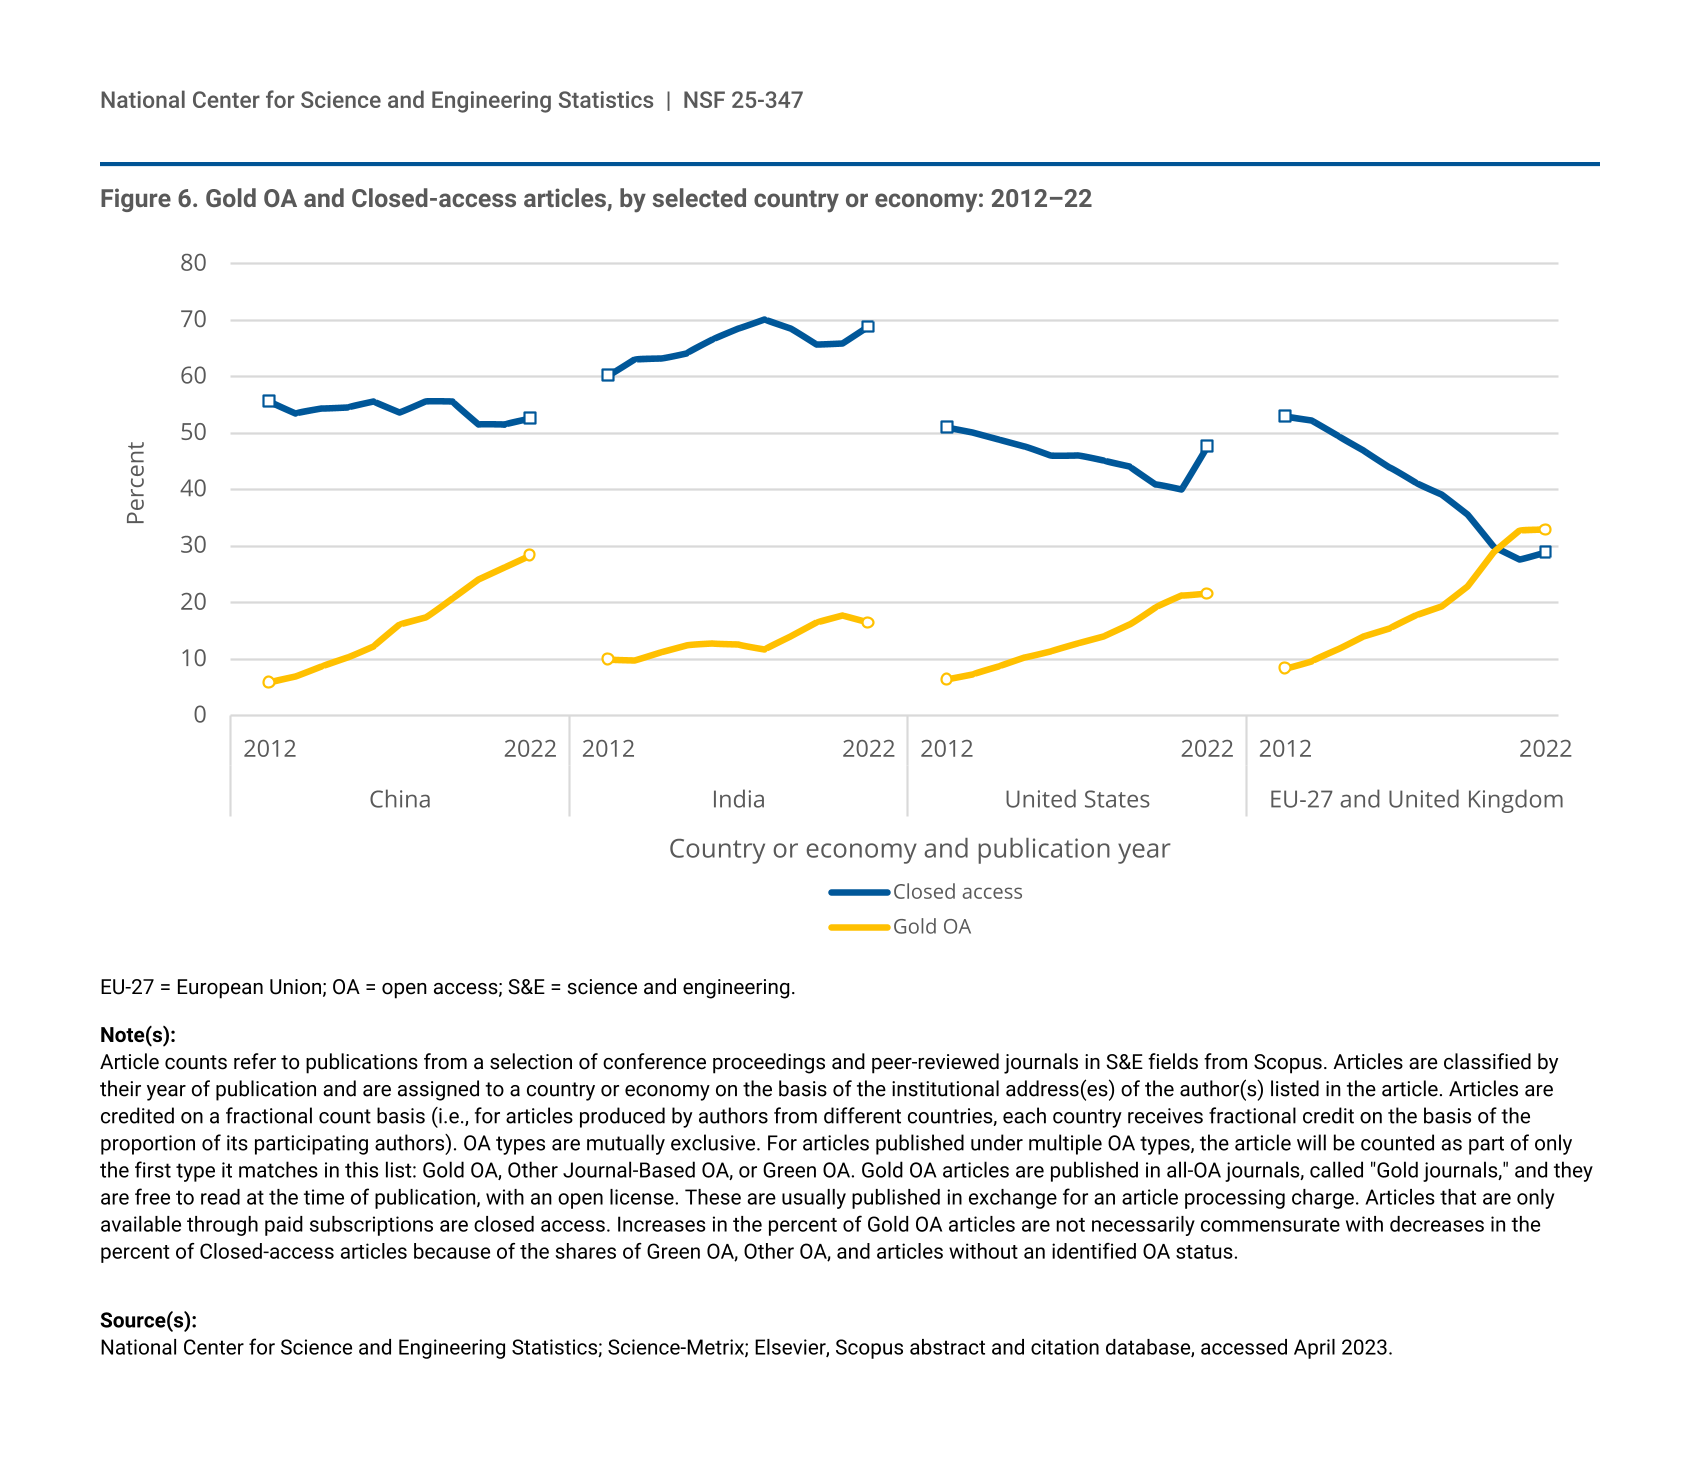
Authors within different countries or economies produced different shares of OA and Closed-access publications. In four of the top countries or economies in terms of publication output, the share of Gold OA articles tends to increase over time, but these increases do not universally coincide with reductions in the share of Closed-access articles. Publications in Green OA, Other Journal-Based OA, and OA status unknown also comprise shares of a country’s or economy’s publication output, such that increases in Gold OA articles do not necessarily lead to decreases in Closed-access articles. Authors in China have increased their Gold OA article publication rate from 6% in 2012 to 28% in 2022, while authors in India exhibit a more modest increase from 10% to 17% in the same period (figure 6). However, for authors in China, the share of their Closed-access publications showed only small variations between 51% and 56%, and for authors in India, this percentage increased from 60% in 2012 to 69% in 2022, with some variability in that trend after 2018. U.S. authors show a consistent increase in the percentage of published Gold OA articles, from 6% in 2012 to 22% in 2022, with a decrease in Closed-access articles from 51% to 48% over the same period. Publications written by authors in the European Union (EU-27) and the United Kingdom (UK) showed an especially dramatic change in percentage between Gold OA articles, which increased from 8% to 33%, and Closed-access articles, which decreased from 53% to 29%, with the percentage of Gold OA articles surpassing Closed-access articles in 2021.
EU-27 = European Union; OA = open access; S&E = science and engineering.
Article counts refer to publications from a selection of conference proceedings and peer-reviewed journals in S&E fields from Scopus. Articles are classified by their year of publication and are assigned to a country or economy on the basis of the institutional address(es) of the author(s) listed in the article. Articles are credited on a fractional count basis (i.e., for articles produced by authors from different countries, each country receives fractional credit on the basis of the proportion of its participating authors). OA types are mutually exclusive. For articles published under multiple OA types, the article will be counted as part of only the first type it matches in this list: Gold OA, Other Journal-Based OA, or Green OA. Gold OA articles are published in all-OA journals, called "Gold journals," and they are free to read at the time of publication, with an open license. These are usually published in exchange for an article processing charge. Articles that are only available through paid subscriptions are closed access. Increases in the percent of Gold OA articles are not necessarily commensurate with decreases in the percent of Closed-access articles because of the shares of Green OA, Other OA, and articles without an identified OA status.
National Center for Science and Engineering Statistics; Science-Metrix; Elsevier, Scopus abstract and citation database, accessed April 2023.
HCA Index of OA and Closed-Access Articles by Country or Economy
As publication rates of the different OA types have changed over time, the scientific impact of articles in each of these venues has also varied. A common impact measure of scientific publications is how many other scientific publications cite that paper as a source. Because knowledge diffuses and citations accrue over time, the measures used here are at least 2 years from the date of publication. Therefore, data are only available for articles published before 2020. One measure of a country's or economy’s scientific impact is the number of highly cited articles (HCA), or articles in the global top 1% by citations, a country’s or economy’s researchers produce. The increased access to OA articles also can affect their citations and impact this measure. This section helps illustrate how different OA classifications differ in terms of HCAs.
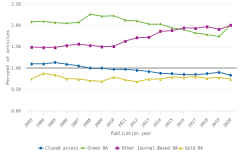
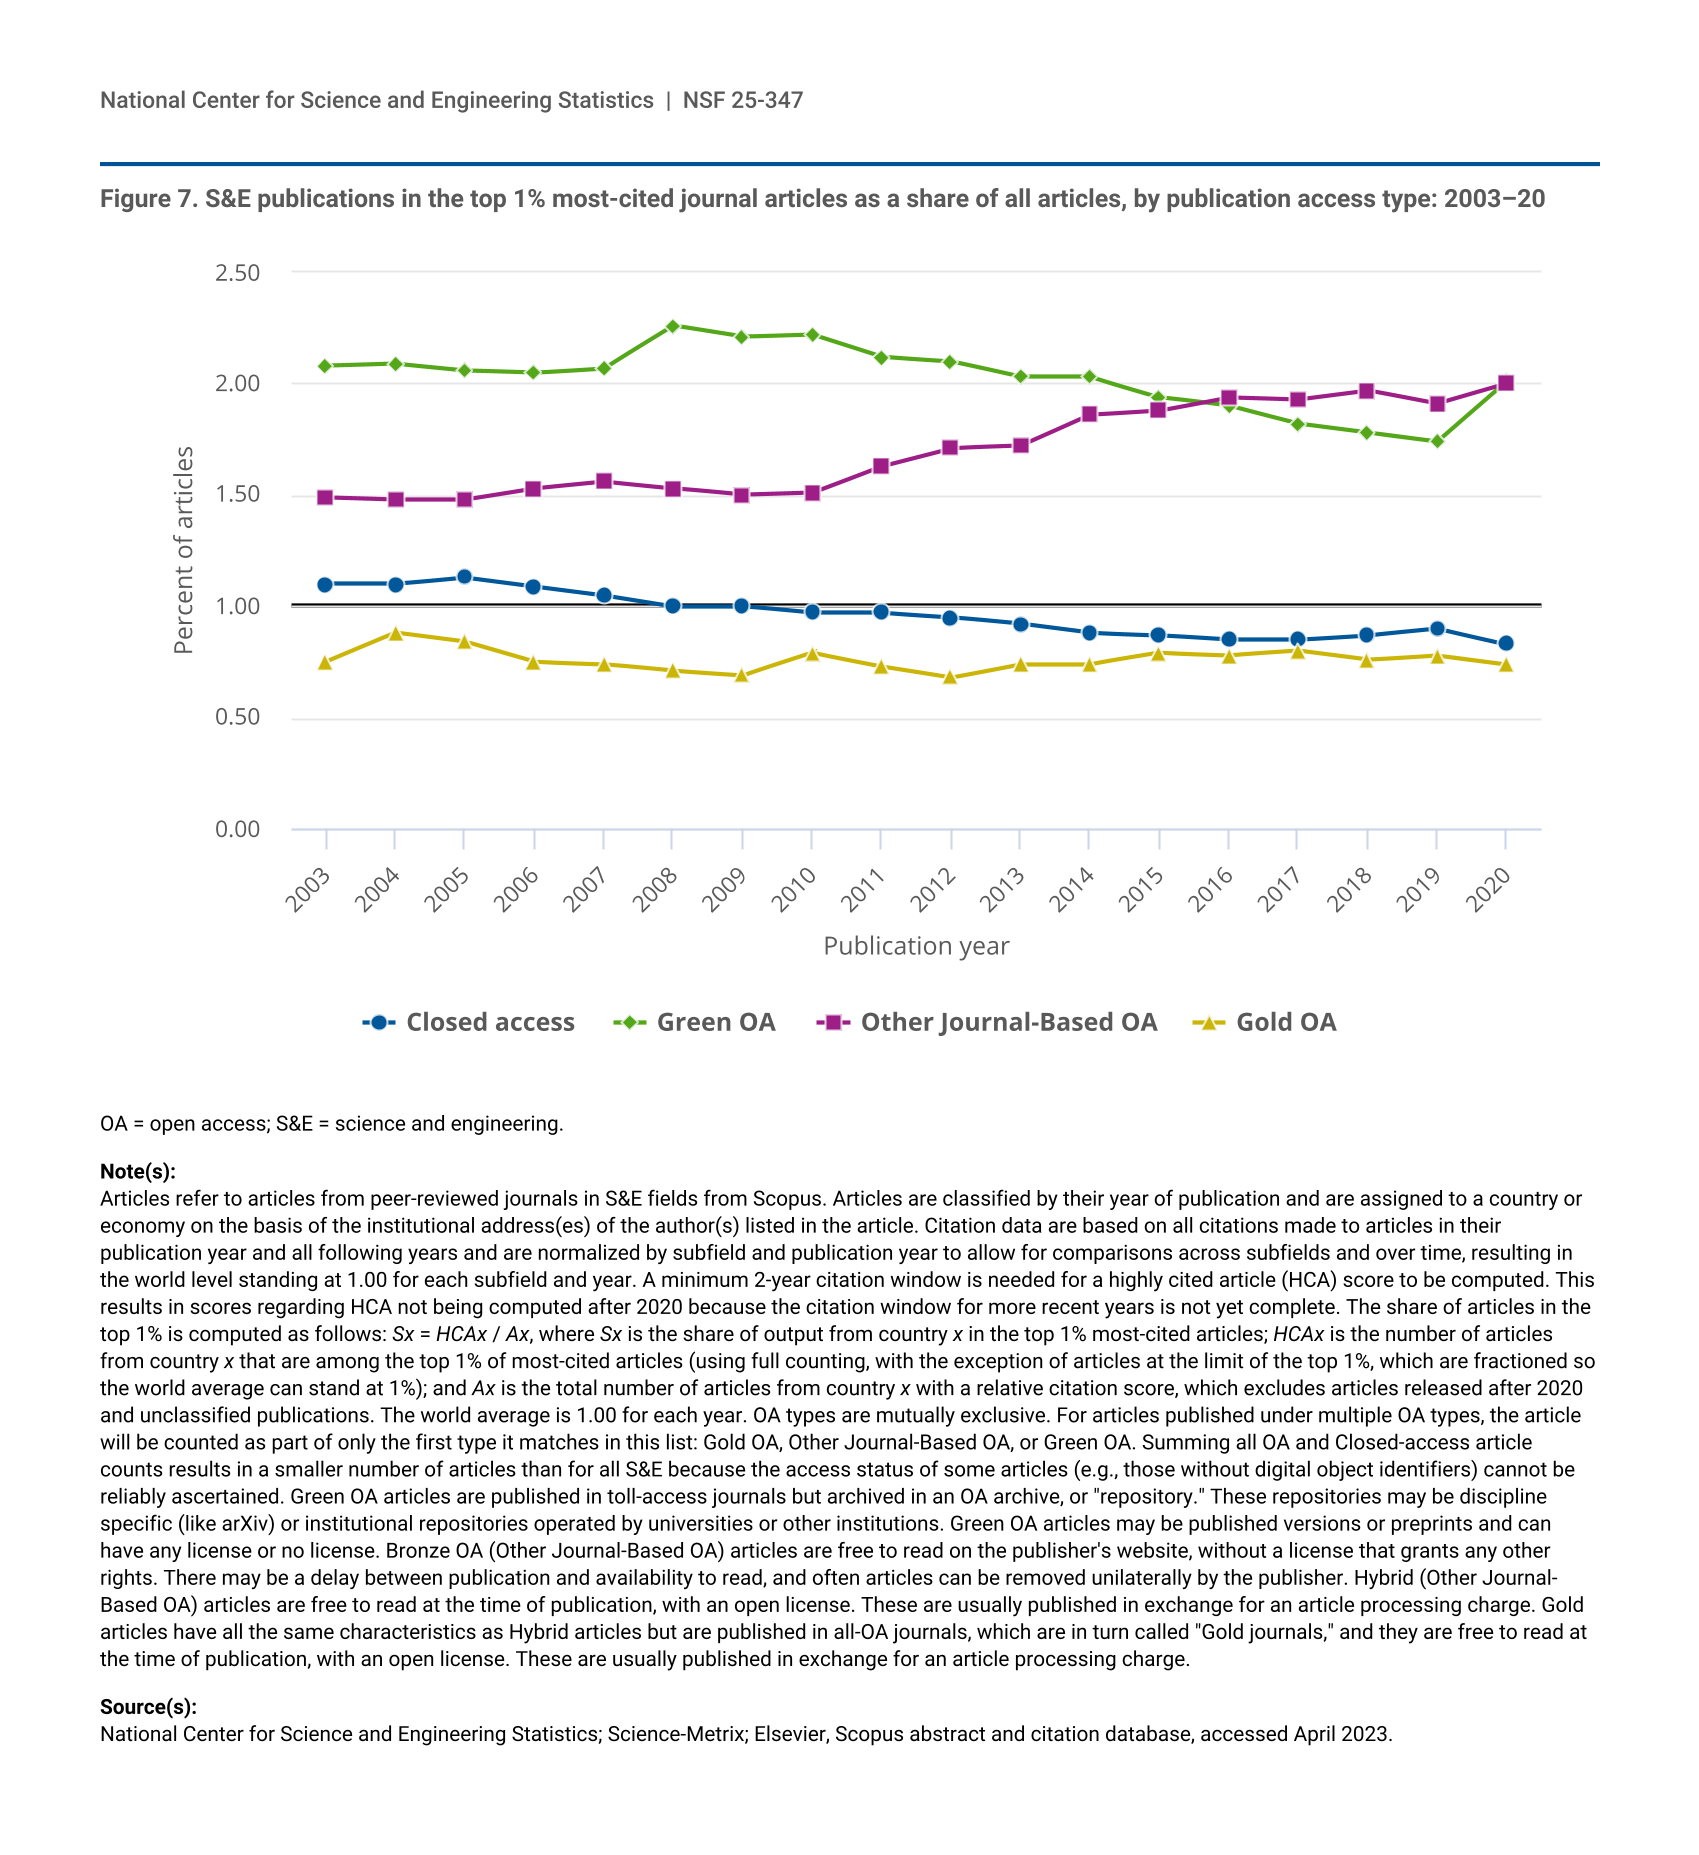
To account for countries or economies where authors may produce more HCAs in absolute terms because of the higher total national output volume, such as the United States and China, the HCA ratio is used. The HCA ratio is the percentage of articles of a given classification (e.g., Gold OA) that are among the top 1% of HCAs globally. In any given classification group, if 1% of that group is in the top 1% of all cited publications, the HCA ratio is 1.00. At this value, a group produces as many HCAs as they would if all groups produced them at the same frequency, so this is referred to as the “baseline.” For example, the HCA ratio for Gold OA articles in 2020, was 0.74, indicating that 0.74% of all Gold OA articles were in the global top 1% (figure 7). In this case, those Gold OA articles had less scientific impact than the baseline of 1.00. In 2020, Green OA had an HCA ratio of 2.01, or 2.01% of all Green OA articles in the global top 1%. Therefore, Green OA articles had a higher impact than Gold OA articles in 2020.
| Publication year | Closed access | Green OA | Other Journal-Based OA | Gold OA |
|---|---|---|---|---|
| 2003 | 1.10 | 2.08 | 1.49 | 0.75 |
| 2004 | 1.10 | 2.09 | 1.48 | 0.88 |
| 2005 | 1.13 | 2.06 | 1.48 | 0.84 |
| 2006 | 1.09 | 2.05 | 1.53 | 0.75 |
| 2007 | 1.05 | 2.07 | 1.56 | 0.74 |
| 2008 | 1.00 | 2.26 | 1.53 | 0.71 |
| 2009 | 1.00 | 2.21 | 1.50 | 0.69 |
| 2010 | 0.97 | 2.22 | 1.51 | 0.79 |
| 2011 | 0.97 | 2.12 | 1.63 | 0.73 |
| 2012 | 0.95 | 2.10 | 1.71 | 0.68 |
| 2013 | 0.92 | 2.03 | 1.72 | 0.74 |
| 2014 | 0.88 | 2.03 | 1.86 | 0.74 |
| 2015 | 0.87 | 1.94 | 1.88 | 0.79 |
| 2016 | 0.85 | 1.90 | 1.94 | 0.78 |
| 2017 | 0.85 | 1.82 | 1.93 | 0.80 |
| 2018 | 0.87 | 1.78 | 1.97 | 0.76 |
| 2019 | 0.90 | 1.74 | 1.91 | 0.78 |
| 2020 | 0.83 | 2.01 | 2.00 | 0.74 |
OA = open access; S&E = science and engineering.
Articles refer to articles from peer-reviewed journals in S&E fields from Scopus. Articles are classified by their year of publication and are assigned to a country or economy on the basis of the institutional address(es) of the author(s) listed in the article. Citation data are based on all citations made to articles in their publication year and all following years and are normalized by subfield and publication year to allow for comparisons across subfields and over time, resulting in the world level standing at 1.00 for each subfield and year. A minimum 2-year citation window is needed for a highly cited article (HCA) score to be computed. This results in scores regarding HCA not being computed after 2020 because the citation window for more recent years is not yet complete. The share of articles in the top 1% is computed as follows: Sx = HCAx / Ax, where Sx is the share of output from country x in the top 1% most-cited articles; HCAx is the number of articles from country x that are among the top 1% of most-cited articles (using full counting, with the exception of articles at the limit of the top 1%, which are fractioned so the world average can stand at 1%); and Ax is the total number of articles from country x with a relative citation score, which excludes articles released after 2020 and unclassified publications. The world average is 1.00 for each year. OA types are mutually exclusive. For articles published under multiple OA types, the article will be counted as part of only the first type it matches in this list: Gold OA, Other Journal-Based OA, or Green OA. Summing all OA and Closed-access article counts results in a smaller number of articles than for all S&E because the access status of some articles (e.g., those without digital object identifiers) cannot be reliably ascertained. Green OA articles are published in toll-access journals but archived in an OA archive, or "repository." These repositories may be discipline specific (like arXiv) or institutional repositories operated by universities or other institutions. Green OA articles may be published versions or preprints and can have any license or no license. Bronze OA (Other Journal-Based OA) articles are free to read on the publisher's website, without a license that grants any other rights. There may be a delay between publication and availability to read, and often articles can be removed unilaterally by the publisher. Hybrid (Other Journal-Based OA) articles are free to read at the time of publication, with an open license. These are usually published in exchange for an article processing charge. Gold articles have all the same characteristics as Hybrid articles but are published in all-OA journals, which are in turn called "Gold journals," and they are free to read at the time of publication, with an open license. These are usually published in exchange for an article processing charge.
National Center for Science and Engineering Statistics; Science-Metrix; Elsevier, Scopus abstract and citation database, accessed April 2023.
From 2003 to 2020, the HCA ratio for Closed-access articles gradually fell from 1.10 to 0.83 (figure 7), while the HCA for Other Journal-Based OA articles steadily rose from 1.49 to 2.00. For Gold and Green OA, the trends over the same period are mixed, with periods of rising and falling HCA ratios. Specifically, from 2008 to 2019, Green OA’s HCA ratio steadily declined before rebounding in 2020.
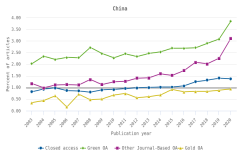
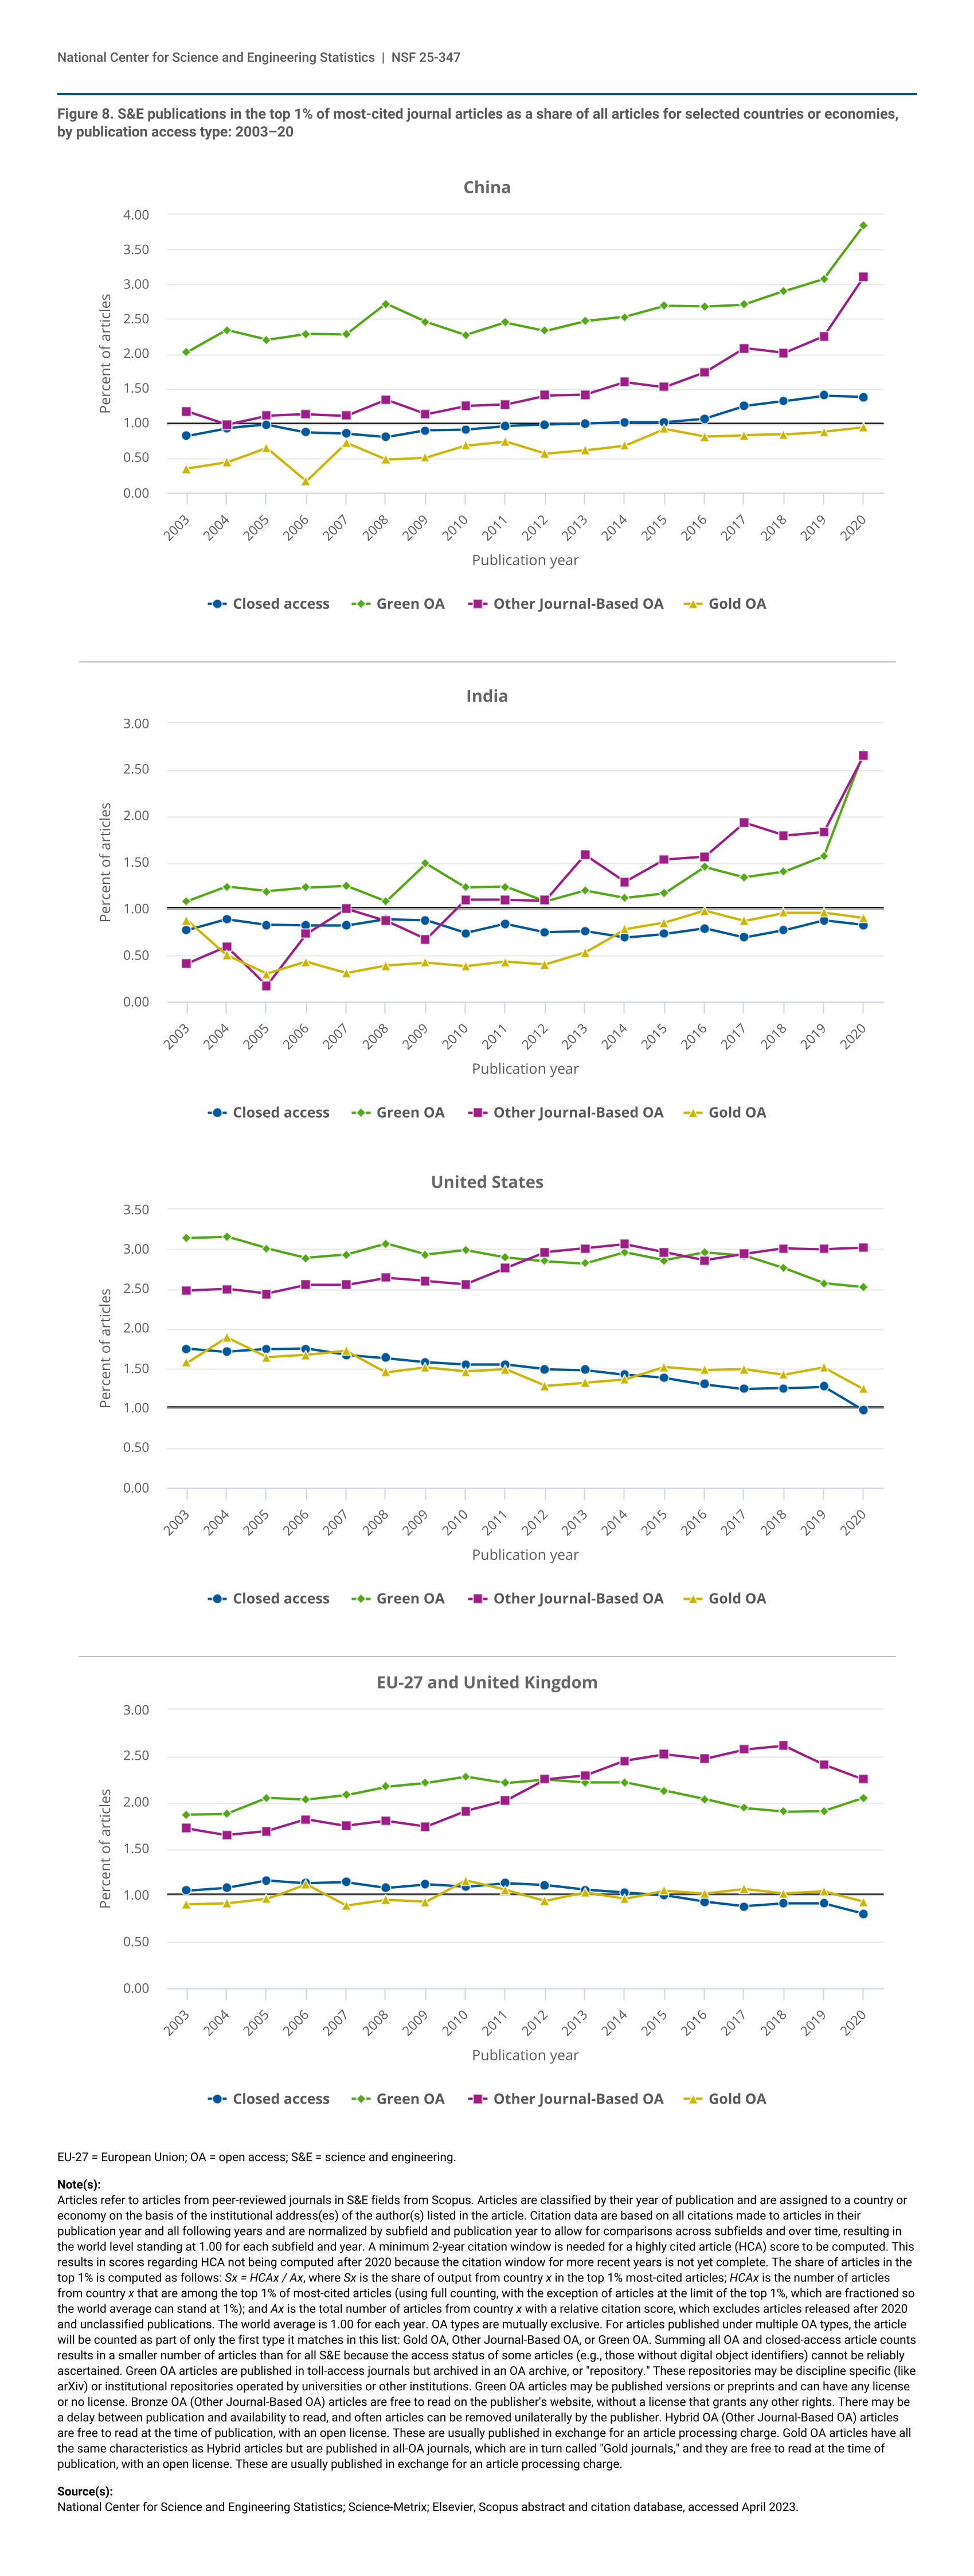
There is further variation by OA type over time for publications from the United States, China, the EU-27 and the UK, and India. For publications from the United States between 2003 and 2020, only the HCA ratio for Other Journal-Based OA has grown, whereas there has been a decline in the HCA ratio among Green OA, Gold OA, and Closed-access publications (figure 8). Closed-access and Gold OA publications from the EU-27 and the UK had modest HCA ratio declines, but mixed trends for Other Journal-Based and Green OA HCA ratios. Publications from China and India both had the highest HCA ratios in Green and Other Journal-Based OA articles, and Other Journal-Based OA grew the most between 2003 and 2020. In 2020, of the countries and economies featured, China had the highest HCA for Green OA (3.84), Other Journal-Based OA (3.10), and Closed access (1.38), while the United States had the highest for Gold OA (1.24).
| Publication year | Closed access | Green OA | Other Journal-Based OA | Gold OA |
|---|---|---|---|---|
| 2003 | 0.82 | 2.02 | 1.17 | 0.35 |
| 2004 | 0.93 | 2.34 | 0.98 | 0.44 |
| 2005 | 0.98 | 2.20 | 1.11 | 0.65 |
| 2006 | 0.87 | 2.29 | 1.13 | 0.17 |
| 2007 | 0.85 | 2.28 | 1.11 | 0.72 |
| 2008 | 0.80 | 2.72 | 1.34 | 0.48 |
| 2009 | 0.90 | 2.46 | 1.13 | 0.51 |
| 2010 | 0.91 | 2.27 | 1.25 | 0.68 |
| 2011 | 0.96 | 2.45 | 1.27 | 0.74 |
| 2012 | 0.98 | 2.33 | 1.40 | 0.56 |
| 2013 | 1.00 | 2.47 | 1.41 | 0.61 |
| 2014 | 1.02 | 2.53 | 1.59 | 0.68 |
| 2015 | 1.02 | 2.69 | 1.52 | 0.92 |
| 2016 | 1.07 | 2.68 | 1.73 | 0.81 |
| 2017 | 1.25 | 2.71 | 2.08 | 0.83 |
| 2018 | 1.32 | 2.90 | 2.01 | 0.84 |
| 2019 | 1.40 | 3.08 | 2.25 | 0.88 |
| 2020 | 1.38 | 3.84 | 3.10 | 0.94 |
| Publication year | Closed access | Green OA | Other Journal-Based OA | Gold OA |
|---|---|---|---|---|
| 2003 | 0.77 | 1.08 | 0.41 | 0.88 |
| 2004 | 0.89 | 1.24 | 0.59 | 0.50 |
| 2005 | 0.83 | 1.19 | 0.17 | 0.30 |
| 2006 | 0.82 | 1.23 | 0.73 | 0.43 |
| 2007 | 0.82 | 1.25 | 1.00 | 0.31 |
| 2008 | 0.89 | 1.08 | 0.87 | 0.39 |
| 2009 | 0.88 | 1.49 | 0.67 | 0.42 |
| 2010 | 0.74 | 1.23 | 1.10 | 0.38 |
| 2011 | 0.84 | 1.24 | 1.10 | 0.43 |
| 2012 | 0.75 | 1.08 | 1.09 | 0.40 |
| 2013 | 0.76 | 1.20 | 1.58 | 0.53 |
| 2014 | 0.69 | 1.12 | 1.29 | 0.78 |
| 2015 | 0.73 | 1.17 | 1.53 | 0.85 |
| 2016 | 0.79 | 1.45 | 1.56 | 0.98 |
| 2017 | 0.69 | 1.34 | 1.93 | 0.87 |
| 2018 | 0.77 | 1.40 | 1.79 | 0.96 |
| 2019 | 0.88 | 1.57 | 1.83 | 0.96 |
| 2020 | 0.83 | 2.68 | 2.65 | 0.90 |
| Publication year | Closed access | Green OA | Other Journal-Based OA | Gold OA |
|---|---|---|---|---|
| 2003 | 1.75 | 3.14 | 2.48 | 1.57 |
| 2004 | 1.71 | 3.16 | 2.50 | 1.89 |
| 2005 | 1.74 | 3.01 | 2.44 | 1.64 |
| 2006 | 1.75 | 2.89 | 2.55 | 1.67 |
| 2007 | 1.67 | 2.93 | 2.55 | 1.72 |
| 2008 | 1.63 | 3.07 | 2.64 | 1.45 |
| 2009 | 1.58 | 2.93 | 2.60 | 1.51 |
| 2010 | 1.55 | 2.99 | 2.56 | 1.46 |
| 2011 | 1.55 | 2.90 | 2.76 | 1.49 |
| 2012 | 1.49 | 2.85 | 2.96 | 1.28 |
| 2013 | 1.48 | 2.82 | 3.01 | 1.32 |
| 2014 | 1.42 | 2.96 | 3.06 | 1.36 |
| 2015 | 1.38 | 2.86 | 2.96 | 1.52 |
| 2016 | 1.30 | 2.96 | 2.86 | 1.48 |
| 2017 | 1.24 | 2.92 | 2.94 | 1.49 |
| 2018 | 1.25 | 2.76 | 3.01 | 1.42 |
| 2019 | 1.27 | 2.57 | 3.00 | 1.51 |
| 2020 | 0.97 | 2.52 | 3.02 | 1.24 |
| Publication year | Closed access | Green OA | Other Journal-Based OA | Gold OA |
|---|---|---|---|---|
| 2003 | 1.05 | 1.87 | 1.72 | 0.90 |
| 2004 | 1.08 | 1.88 | 1.65 | 0.91 |
| 2005 | 1.16 | 2.05 | 1.69 | 0.96 |
| 2006 | 1.13 | 2.03 | 1.82 | 1.12 |
| 2007 | 1.14 | 2.08 | 1.75 | 0.89 |
| 2008 | 1.08 | 2.17 | 1.80 | 0.95 |
| 2009 | 1.12 | 2.21 | 1.74 | 0.93 |
| 2010 | 1.09 | 2.28 | 1.91 | 1.16 |
| 2011 | 1.13 | 2.21 | 2.02 | 1.06 |
| 2012 | 1.11 | 2.25 | 2.25 | 0.94 |
| 2013 | 1.06 | 2.22 | 2.29 | 1.03 |
| 2014 | 1.03 | 2.22 | 2.45 | 0.96 |
| 2015 | 1.00 | 2.13 | 2.52 | 1.05 |
| 2016 | 0.93 | 2.04 | 2.47 | 1.02 |
| 2017 | 0.88 | 1.94 | 2.57 | 1.07 |
| 2018 | 0.91 | 1.90 | 2.61 | 1.02 |
| 2019 | 0.91 | 1.91 | 2.41 | 1.04 |
| 2020 | 0.80 | 2.05 | 2.25 | 0.93 |
EU-27 = European Union; OA = open access; S&E = science and engineering.
Articles refer to articles from peer-reviewed journals in S&E fields from Scopus. Articles are classified by their year of publication and are assigned to a country or economy on the basis of the institutional address(es) of the author(s) listed in the article. Citation data are based on all citations made to articles in their publication year and all following years and are normalized by subfield and publication year to allow for comparisons across subfields and over time, resulting in the world level standing at 1.00 for each subfield and year. A minimum 2-year citation window is needed for a highly cited article (HCA) score to be computed. This results in scores regarding HCA not being computed after 2020 because the citation window for more recent years is not yet complete. The share of articles in the top 1% is computed as follows: Sx = HCAx / Ax, where Sx is the share of output from country x in the top 1% most-cited articles; HCAx is the number of articles from country x that are among the top 1% of most-cited articles (using full counting, with the exception of articles at the limit of the top 1%, which are fractioned so the world average can stand at 1%); and Ax is the total number of articles from country x with a relative citation score, which excludes articles released after 2020 and unclassified publications. The world average is 1.00 for each year. OA types are mutually exclusive. For articles published under multiple OA types, the article will be counted as part of only the first type it matches in this list: Gold OA, Other Journal-Based OA, or Green OA. Summing all OA and closed-access article counts results in a smaller number of articles than for all S&E because the access status of some articles (e.g., those without digital object identifiers) cannot be reliably ascertained. Green OA articles are published in toll-access journals but archived in an OA archive, or "repository." These repositories may be discipline specific (like arXiv) or institutional repositories operated by universities or other institutions. Green OA articles may be published versions or preprints and can have any license or no license. Bronze OA (Other Journal-Based OA) articles are free to read on the publisher's website, without a license that grants any other rights. There may be a delay between publication and availability to read, and often articles can be removed unilaterally by the publisher. Hybrid OA (Other Journal-Based OA) articles are free to read at the time of publication, with an open license. These are usually published in exchange for an article processing charge. Gold OA articles have all the same characteristics as Hybrid articles but are published in all-OA journals, which are in turn called "Gold journals," and they are free to read at the time of publication, with an open license. These are usually published in exchange for an article processing charge.
National Center for Science and Engineering Statistics; Science-Metrix; Elsevier, Scopus abstract and citation database, accessed April 2023.
Conclusion
The rise in the number of OA articles may indicate a change in the publication practices of researchers across the world, as OA becomes increasingly common over time. Authors in the United States and China have demonstrated a growing tendency to publish OA articles over the past 20 years, even as their overall publication output is still predominantly Closed access. In addition, authors in many low-income countries published a higher share of Gold OA articles than counterparts in high-income countries. Among countries or economies with high volumes of publications, the United States and the EU-27 and the UK showed increases in the percent of articles published as Gold OA alongside overall decreases in articles published as Closed access, while China and India showed flat or increasing percentages of Closed-access articles alongside increases in Gold OA percentages. A variety of factors influence authors’ decisions about their article’s venue, including journal prestige, cost, or rejection from a preferred journal, so a tendency for or against OA may not directly indicate the preference of authors. However, these shifting patterns are important to study from the perspective of global access to research for readers and publication structures for authors, particularly because authors may pay fees to publish OA articles instead of readers paying subscription fees to access articles.
Data Sources, Limitations, and Availability
Data are from the Scopus database, a bibliometric database owned by Elsevier and containing scientific literature with English titles and abstracts. Publication output and citations are derived from information about research articles and conference papers (hereafter referred to collectively as “articles”) published in conference proceedings and peer-reviewed scientific and technical journals. All journals and conference proceedings must pass the standards for inclusion in Scopus, which includes reaching criteria for relevance and peer review. The articles exclude editorials, commentaries, errata, letters, and other material that do not present or discuss scientific data, theories, methods, apparatuses, or experiments. The National Center for Science and Engineering Statistics (NCSES) undertook additional filtering of the Scopus data to remove journals and conference papers flagged by the Directory of Open-Access Journals (DOAJ) for failing to adhere to its list of best practices for substantive peer review. Because the Scopus database is constructed from articles and conference proceedings with an English-language title and abstract, the database may be biased towards English language publications as not all science and engineering (S&E) articles and conference proceedings meet the English language requirement.
Open access (OA) status and type for articles is determined by the Unpaywall database, which allows for a single publication to be coded to an OA type. Articles are marked exclusively with their levels of OA—Gold OA (highest OA level), Other OA, Green OA, or Closed access—such that if an article is both Green OA (saved in a publicly available repository, like ArXiv) and Gold OA, then it will be listed as Gold OA but not Green OA.
NCSES has reviewed this product for unauthorized disclosure of confidential information and approved its release (NCSES-DRN24-069).
Notes
1 Piwowar H, Priem J, Larivière V, Alperin JP, Matthias L, Norlander B, Farley A, West J, Haustein S. 2018. The State of OA: A Large-Scale Analysis of the Prevalence and Impact of Open Access Articles. PeerJ 6:e4375. Available at https://doi.org/10.7717/peerj.4375. Accessed 27 July 2023.
2 Sugimoto CR, Larivière V. 2018. Do authors comply when funders enforce open access to research? Nature. Available at https://www.nature.com/articles/d41586-018-07101-w. Accessed 13 March 2023.
3 For a detailed description of Scopus data, see https://ncses.nsf.gov/pubs/nsb202333/technical-appendix.
4 Articles where OA status is unknown are excluded from this analysis. For total article counts see table SPBS-2 in National Science Board, National Science Foundation. 2023. Publications Output: U.S. Trends and International Comparisons. Science and Engineering Indicators 2024. NSB-2023-33. Alexandria, VA. Available at https://ncses.nsf.gov/pubs/nsb202333/.
5 Fractional counting is a method of counting S&E publications in which credit for coauthored publications is divided among the collaborating institutions or regions, countries, or economies based on the proportion of their participating authors. Fractional counting allocates the publication count based on the proportion of the coauthors named on the article with institutional addresses from each region, country, or economy. Fractional counting enables the counts to sum up to the number of total articles. For example, if a publication were authored by two researchers from the University of Oslo, one from University College London, and one from the University of Washington, half of the publication would be attributed to Norway, and a quarter each to the United Kingdom and the United States when the fractions are calculated at the level of researchers. For this report, fractions were calculated at the level of researchers. If an author provides multiple institutions, and those institutions are in different regions, countries, or economies, then each region, country, or economy receives an appropriate fraction of the count. For more information, see https://ncses.nsf.gov/pubs/nsb202333.
6 National Science Board, U.S. National Science Foundation. 2023. Publications Output: U.S. Trends and International Comparisons. Science and Engineering Indicators 2024. NSB-2023-33. Alexandria, VA. Available at https://ncses.nsf.gov/pubs/nsb202333/.
7 The top 1% is determined by scientific field to account for citation differences between scientific fields. For a given year with at least a 2-year citation window since publication, the two years of citations garnered by an article are used. From this, the top 1% of these articles is determined for each scientific field and this collection of articles for each year are classified as the highly cited articles (HCAs) for that year.
8 For further discussion of all publications at the region, country, or economy level and not subset by OA classification, see https://ncses.nsf.gov/pubs/nsb202333/impact-of-published-research.
9 Science-Metrix. 2023. Bibliometric Indicators for the Science and Engineering Indicators 2024. Technical Documentation. Available at https://science-metrix.com/bibliometrics-indicators-for-the-science-and-engineering-indicators-2024-technical-documentation/. Accessed 30 April 2025.
10 Elsevier. 2020. Scopus Content Coverage Guide. Available at https://www.elsevier.com/products/scopus/content. Accessed 20 May 2025.
11 Unpaywall (https://unpaywall.org/) is a database developed by the nonprofit OurResearch, which identifies and collects OA articles from both journals and preprint repositories. See https://www.nature.com/articles/d41586-018-05968-3.
Suggested Citation
National Center for Science and Engineering Statistics (NCSES). 2025. Open-Access Publishing in a Global Context. NSF 25-347. Alexandria, VA: U.S. National Science Foundation. Available at https://ncses.nsf.gov/pubs/nsf25347.
Contact Us
NCSES
National Center for Science and Engineering Statistics
Directorate for Social, Behavioral and Economic Sciences
U.S. National Science Foundation
2415 Eisenhower Avenue, Suite W14200
Alexandria, VA 22314
Tel: (703) 292-8780
FIRS: (800) 877-8339
TDD: (800) 281-8749
E-mail: ncsesweb@nsf.gov