 An official website of the United States government
U.S. Nonprofits Spent $31 Billion on R&D Activities in FY 2023
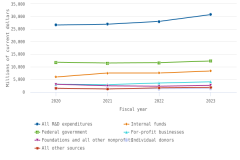
U.S. nonprofits spent an estimated $30.8 billion on research and experimental development (R&D) performed within their organizations in FY 2023, an increase of 10% in current dollars from FY 2022 (figure 1).
| Fiscal year | All R&D expenditures | Internal funds | Federal government | For-profit businesses | Foundations and all other nonprofits | Individual donors | All other sources |
|---|---|---|---|---|---|---|---|
| 2020 | 26,709 | 5,975 | 11,809 | 3,070 | 3,060 | 1,360 | 1,435 |
| 2021 | 27,030 | 7,536 | 11,481 | 2,994 | 2,395 | 1,382 | 1,243 |
| 2022 | 28,053 | 7,568 | 11,648 | 3,593 | 2,242 | 1,336 | 1,666 |
| 2023 | 30,817 | 8,376 | 12,353 | 4,057 | 2,667 | 1,498 | 1,865 |
For for-profit businesses, more than 50% of the FY 2023 estimate is a combination of imputation and reweighting to account for nonresponse. These data exclude nonprofit universities and colleges and federally funded research and development centers administered by nonprofit organizations. All other sources includes state and local government, universities, and other miscellaneous sources. Detail may not add to total because of rounding.
National Center for Science and Engineering Statistics and Census Bureau, Nonprofit Research Activities module of the Annual Business Survey.
Data in this InfoBrief are from the Nonprofit Research Activities (NPRA) FY 2023 module of the 2024 Annual Business Survey. The NPRA Survey was funded by the National Center for Science and Engineering Statistics (NCSES) within the U.S. National Science Foundation, and data collection was conducted by the Census Bureau.
Sources of Funding for Nonprofit R&D Performance
The largest funding source for nonprofit R&D performance in FY 2023 was the federal government, contributing $12.4 billion, or 40%, of the total. Nonprofit organizations’ internal funds were the next largest source at $8.4 billion, or 27%, of the total. For-profit businesses funded $4.1 billion (13%), foundations and all other nonprofits contributed $2.7 billion (9%), and individual donors contributed $1.5 billion (5%). The remaining sources contributed a combined total of 6% to total nonprofit R&D performance.
Overall, total FY 2023 R&D expenditures within nonprofit organizations increased 10% from the total reported for FY 2022, and 15% since FY 2020. The source of funding showing the largest increase between FY 2020 and FY 2023 was the nonprofit organizations themselves (internal funds). Internally funded R&D expenditures increased 40% between FY 2020 and FY 2023, from $6.0 billion to $8.4 billion. The smallest percentage increase over the 4-year span between FY 2020 and FY 2023 was in federal funding of nonprofit R&D, growing 5% from $11.8 billion in FY 2020 to $12.4 billion in FY 2023. Funding from foundations and all other nonprofits declined 13% between FY 2020 and FY 2023, from $3.1 billion to $2.7 billion.
Nonprofit R&D Performance by Type of R&D
Nonprofits reported that approximately half (51% or $15.7 billion) of their FY 2023 R&D performance was categorized as basic research and 32% ($9.9 billion) was applied research (table 1). The remaining 17%, or $5.3 billion, was categorized as experimental development. A higher proportion of the federally funded R&D total was spent on applied research (37%) compared to the nonfederally funded R&D total (29%).
i = more than 50% of the estimate is a combination of imputation and reweighting to account for nonresponse.
These data exclude nonprofit universities and colleges and federally funded research and development centers administered by nonprofit organizations. Detail may not add to total because of rounding.
National Center for Science and Engineering Statistics and Census Bureau, Nonprofit Research Activities FY 2023 module of the 2024 Annual Business Survey.
Nonprofit R&D Performance by Field
The vast majority (72%) of nonprofit R&D spending was again concentrated in biological, biomedical, and health sciences in FY 2023, with the total increasing 16% from FY 2022 (table 2).
These data exclude nonprofit universities and colleges and federally funded research and development centers administered by nonprofit organizations. Detail may not add to total because of rounding.
National Center for Science and Engineering Statistics and Census Bureau, Nonprofit Research Activities module of the Annual Business Survey.
Two fields experienced significant growth between FY 2022 and FY 2023. R&D in physical sciences partially rebounded from a 45% decline between FY 2021 and FY 2022 and increased 35% from FY 2022 ($391 million) to FY 2023 ($529 million). The field grouping with the largest decline between FY 2022 and FY 2023 was mathematics, statistics, and computer and information sciences, declining 28% from $1 billion in FY 2022 to $761 million in FY 2023.
Nonprofit R&D Capital Expenditures
Significant growth of R&D capital expenditures occurred in the second year of data collection for this measure. In FY 2023, nonprofits spent $1.8 billion on capital purchases related to R&D activities, an increase of 82% from the FY 2022 total of $972 million (table 3). The two largest categories for these expenditures were buildings and land improvement ($813 million) and major machinery and equipment ($634 million).
These data exclude nonprofit universities and colleges and federally funded research and development centers administered by nonprofit organizations. Detail may not add to total because of rounding.
National Center for Science and Engineering Statistics and Census Bureau, Nonprofit Research Activities module of the Annual Business Survey.
Nonprofit R&D Personnel
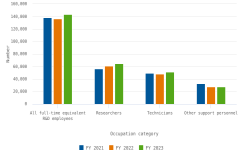
An estimated total of 177,925 employees worked on R&D within U.S. nonprofit organizations in FY 2023, including 143,650 full-time equivalent (FTE) employees. Of the FTE total, 45% were classified as researchers, 36% were classified as technicians, and the remaining 19% were other support personnel (figure 2). The total number of FTE employees working on R&D grew 5.5% from FY 2022.
| Occupation category | FY 2021 | FY 2022 | FY 2023 |
|---|---|---|---|
| All full-time equivalent R&D employees | 137,947 | 136,206 | 143,650 |
| Researchers | 56,068 | 60,574 | 64,459 |
| Technicians | 49,530 | 48,256 | 51,364 |
| Other support personnel | 32,348 | 27,376 | 27,828 |
These data exclude nonprofit universities and colleges and federally funded research and development centers administered by nonprofit organizations. All other sources includes state and local government, universities, and other miscellaneous sources. Detail may not add to total because of rounding.
National Center for Science and Engineering Statistics and Census Bureau, Nonprofit Research Activities module of the Annual Business Survey.
Of the three categories of personnel, the number of FTE researchers has shown the most growth between FY 2021 and FY 2023, increasing 15% from 56,068 to 64,459. Other support personnel declined 14% between FY 2021 and FY 2023, from 32,348 to 27,828.
Survey Information and Data Availability
The NPRA FY 2023 module of the 2024 Annual Business Survey was conducted in 2024 with a sample of 8,000 nonprofit organizations representing 45,000 eligible nonprofit organizations in the United States. Higher education institutions and nonprofit-administered federally funded research and development centers are not included in this survey, as these populations are already included in NCSES’s Higher Education R&D Survey and FFRDC R&D Survey. The fiscal year referred to throughout this report was the nonprofit organizations’ fiscal year; for the majority of organizations reporting R&D performance, this fiscal year ended in either September or December of 2023.
The response rate for the NPRA FY 2023 module was 78%. The estimates in this InfoBrief are based on responses from a sample of the population and may differ from actual values because of sampling variability or other factors. As a result, apparent differences between the estimates for two or more groups may not be statistically significant. Unless otherwise noted, all comparative statements in this InfoBrief have undergone statistical testing and are significant at the 90% confidence level. The variances of estimates in this report were calculated using the delete-a-group jackknife replication method. The complete set of data tables for FY 2023 is available at https://ncses.nsf.gov/surveys/nonprofit-research-activities/2023#data. For more information, please contact NCSES.
NCSES has reviewed this product for unauthorized disclosure of confidential information and approved its release (NCSES-DRN24-093).
Notes
1 All amounts in this report are shown in current dollars.
2 National Center for Science and Engineering Statistics (NCSES). 2024. U.S. Nonprofits Spent $28 Billion on R&D Activities in FY 2022. NSF 24-337. Alexandria, VA: U.S. National Science Foundation. Available at https://ncses.nsf.gov/pubs/nsf24337.
3 See detailed statistical table 10 in the FY 2023 data tables for R&D personnel counts.
4 Employee numbers were reported both as total headcounts and as full-time equivalents (FTEs). Headcounts represent every individual employed by the organization during FY 2023 regardless of their total hours worked. The FTE counts convert the headcounts to a total of FTE employees using the following calculation: 1 FTE equals 40 hours per week for 52 weeks per year. If an employee works 20 hours per week, the employee counts as half of an FTE.
5 See the “Technical Notes” to the FY 2023 data tables for details on the survey frame and exclusions.
Suggested Citation
National Center for Science and Engineering Statistics (NCSES). 2025. U.S. Nonprofits Spent $31 Billion on R&D Activities in FY 2023. NSF 25-355. Alexandria, VA: U.S. National Science Foundation. Available at https://ncses.nsf.gov/pubs/nsf25355.
Contact Us
National Center for Science and Engineering Statistics
Directorate for Social, Behavioral and Economic Sciences
U.S. National Science Foundation
2415 Eisenhower Avenue, Suite W14200
Alexandria, VA 22314
Tel: (703) 292-8780
FIRS: (800) 877-8339
TDD: (800) 281-8749
E-mail: ncsesweb@nsf.gov