 An official website of the United States government
Innovation Data from the 2023 Annual Business Survey: Data Year 2022
Nearly one-quarter (23%) of the estimated 4.9 million for-profit companies with at least one employee introduced an innovation during 2020–22 (table 1). Ten percent of companies reported a product innovation and 20% of companies reported a business process innovation during this period.
NAICS = 2017 North American Industry Classification System.
The Annual Business Survey (ABS) measured innovation by asking companies if they had any incidence of innovation during a 3-year period. For example, the 2023 ABS (data year 2022) asked about innovation during the period 2020–22. Detail across rows may not add to total because of rounding or unavailable NAICS detail for select records beyond the 4-digit industry classification. Detail across columns have been adjusted to add to total. Industry classification is based on dominant establishment payroll. Statistics are representative of companies located in the United States.
National Center for Science and Engineering Statistics and Census Bureau, 2023 Annual Business Survey: Data Year 2022.
Data are from the 2023 Annual Business Survey (ABS) (data year 2022), which provides a comprehensive view of business innovation in the United States. ABS survey questions are based on the Oslo Manual (2018 edition), developed by the Organisation for Economic Co-operation and Development (OECD) and Eurostat (the statistical office of the European Union). The manual provides internationally recognized definitions and guidelines for measuring innovation. In the Oslo framework, innovation is defined as “the introduction of new or improved products (goods or services) or business processes that differed significantly from the business’s previous products or processes.”
The ABS was developed and is cosponsored by the National Center for Science and Engineering Statistics within the U.S. National Science Foundation and by the Census Bureau.
ABS Innovation Trends
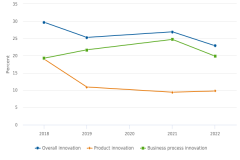
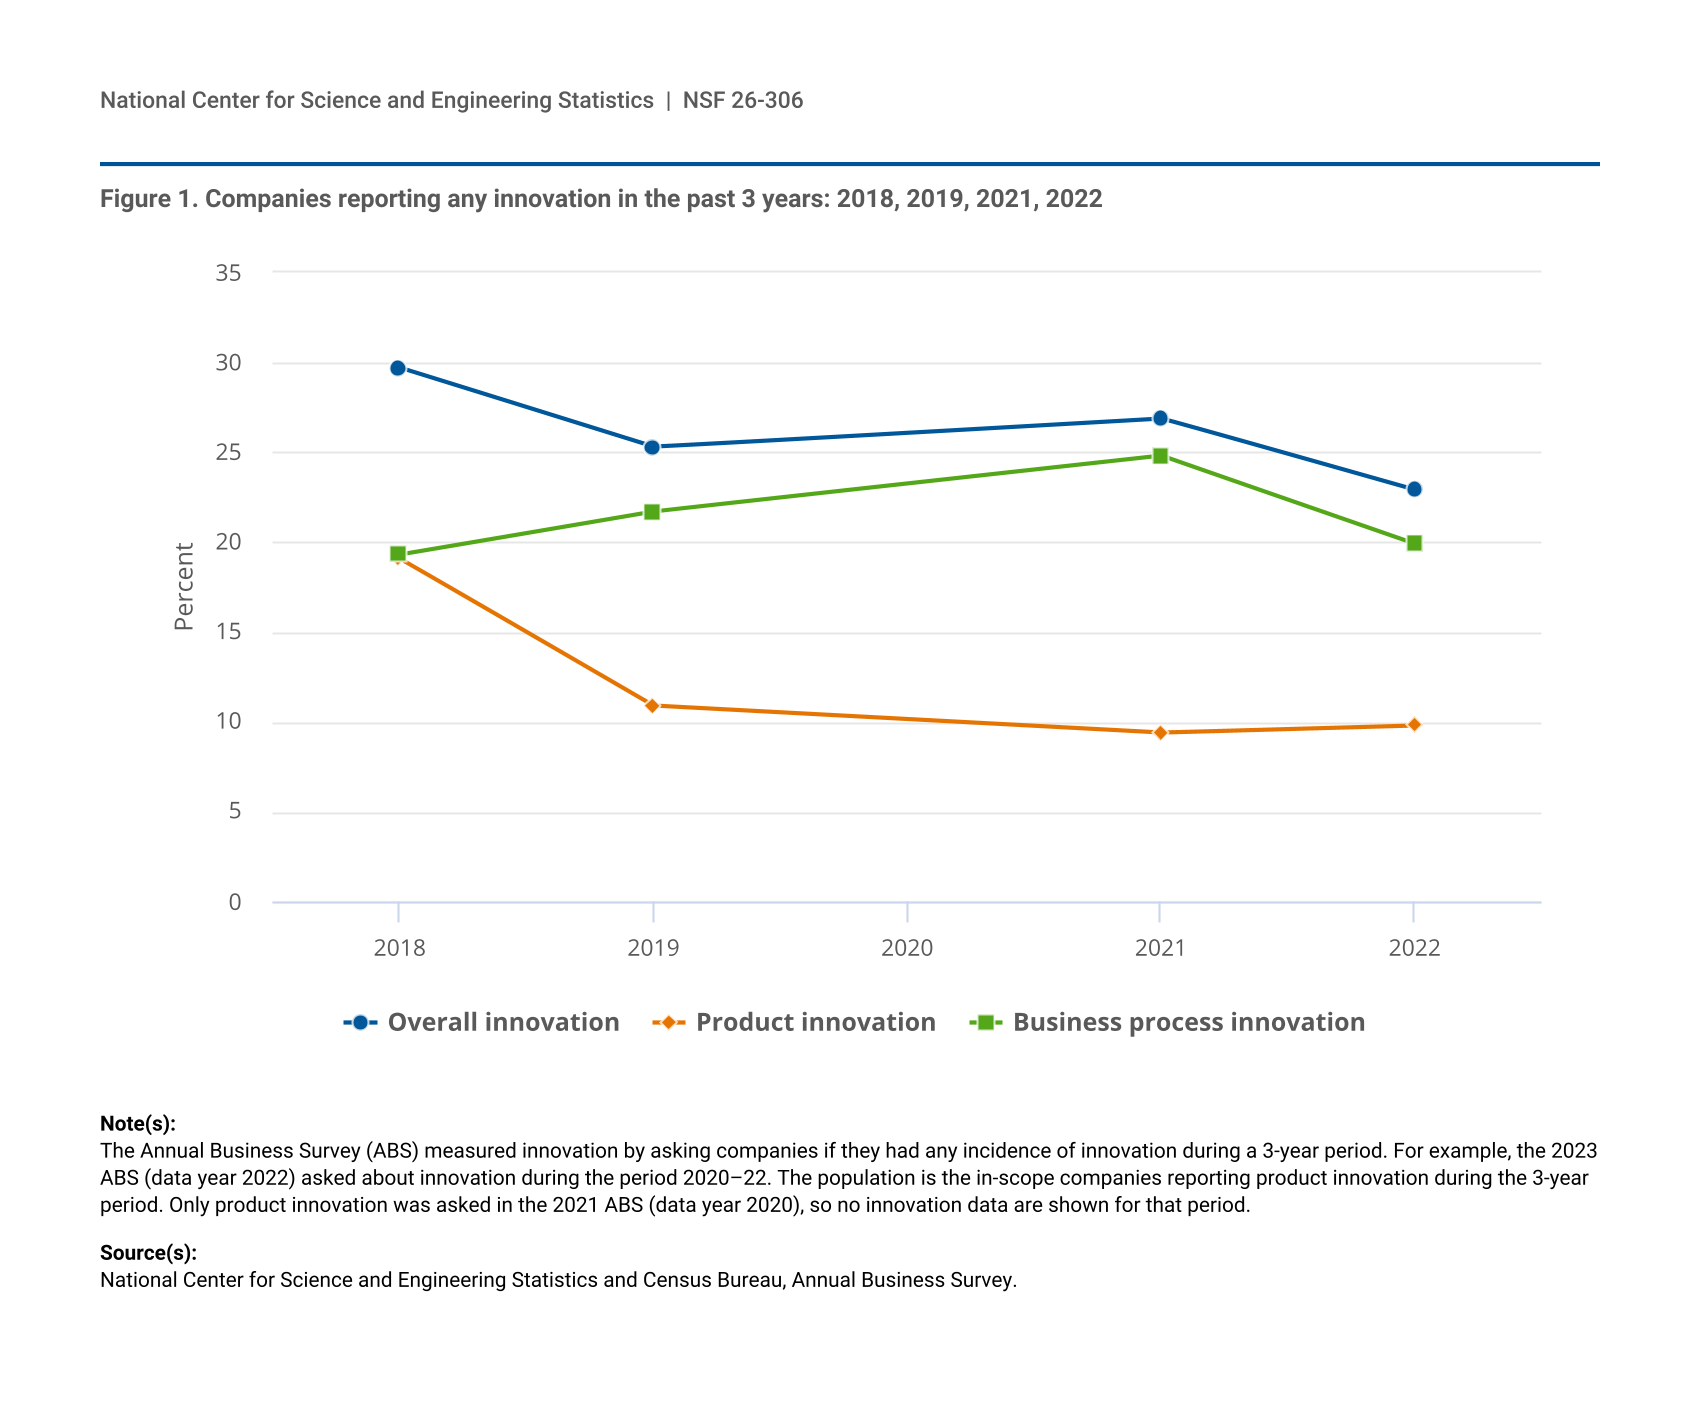
The ABS measured innovation by asking companies about innovation during a 3-year period. For example, the 2023 ABS (data year 2022) asked about innovation during the period 2020–22. Among for-profit companies with at least one employee in the United States, overall innovation decreased from 30% of companies in 2016–18 to 23% in 2020–22 (figure 1). Product innovation decreased from 19% of companies in 2016–18 to 10% in 2020–22, whereas business process innovation increased slightly from 19% of companies in 2016–18 to 20% in 2020–22. These changes in overall innovation rates were not uniform across company size classifications or across industries.
| Innovation | Overall innovation | Product innovation | Business process innovation |
|---|---|---|---|
| 2018 | 29.7 | 19.1 | 19.3 |
| 2019 | 25.3 | 10.9 | 21.7 |
| 2020 | - | - | - |
| 2021 | 26.9 | 9.4 | 24.8 |
| 2022 | 22.9 | 9.8 | 19.9 |
The Annual Business Survey (ABS) measured innovation by asking companies if they had any incidence of innovation during a 3-year period. For example, the 2023 ABS (data year 2022) asked about innovation during the period 2020–22. The population is the in-scope companies reporting product innovation during the 3-year period. Only product innovation was asked in the 2021 ABS (data year 2020), so no innovation data are shown for that period.
National Center for Science and Engineering Statistics and Census Bureau, Annual Business Survey.
Several factors accounted for the decrease in product innovation over time between the 2019 ABS (data year 2018) and the 2023 ABS (data year 2022). The six smallest company size classifications (fewer than 250 employees) all had statistically significant decreases in rates of companies with product innovation between 2016–18 and 2020–22, whereas the remaining six larger size classifications (250 or more employees) showed no significant changes except for two company size categories (5,000 to 9,999 and 10,000 to 24,999) (table 2). The COVID-19 pandemic also began in 2020.
r = relative standard error > 50%.
The Annual Business Survey (ABS) measured innovation by asking companies if they had any incidence of innovation during a 3-year period. For example, the 2023 ABS (data year 2022) asked about innovation during the period 2020–22. Detail across rows may not add to total because of rounding. Detail across columns have been adjusted to add to total. Statistics are representative of companies located in the United States.
National Center for Science and Engineering Statistics and Census Bureau, Annual Business Survey.
Product innovation includes innovation in goods or services. Innovation in goods was steady from 7% in 2016–18 to 6% in 2020–22, but innovation in services decreased by nearly half, from 15% in 2016–18 to 8% in 2020–22. This suggests that the differences over the 2016–18 to 2020–22 period can be attributed to smaller service-oriented companies. For example, the services innovation incidence rate for the smallest microbusinesses (1 to 4 employees) was 7% in 2020–22 and 16% in 2016–18.
Innovation by Industry
Although rates of companies reporting innovation generally are higher for companies in manufacturing industries than for those in nonmanufacturing industries (28% versus 23%), the absolute number of companies reporting innovation is larger for companies in nonmanufacturing industries (table 1).
The product innovation incidence rate was 14% for companies in manufacturing industries and 10% for nonmanufacturing industries. For business process innovation, the incidence rate was 23% for companies in the nonmanufacturing sector and 20% for those in the manufacturing sector.
Just over half of companies (54%) in the software publishers industry (North American Industry Classification System code [NAICS] 5112) reported an innovation in the 2020–22 period, followed by the navigational, measuring, electromedical, and control instruments industry (NAICS 3345) at 46%.
Innovation by State
For the most part, the differences in the innovation rate between the states were small and not statistically significant. The innovation incidence rate ranged from 28% in the District of Columbia to 16% in West Virginia, and although this comparison is statistically significant, most state differences are not (table 3).
The Annual Business Survey (ABS) measured innovation by asking companies if they had any incidence of innovation during a 3-year period. For example, the 2023 ABS (data year 2022) asked about innovation during the period 2020–22. Detail across rows may not add to total because of rounding. Detail across columns have been adjusted to add to total. A company with establishments in multiple states is counted only in the state where the survey was addressed. Statistics are representative of companies located in the United States.
National Center for Science and Engineering Statistics and Census Bureau, 2023 Annual Business Survey: Data Year 2022.
Innovation Activities
Innovation activities are defined as “all developmental, financial and commercial activities undertaken by a firm that are intended to result in an innovation for the firm.” Examples of innovation activities include research and development (R&D) activities, engineering and design activities, marketing and brand equity activities, activities related to intellectual property, and employee training activities. Innovation activities may result in an innovation; these activities can be ongoing, postponed, or even abandoned.
Two-fifths (41%) of companies that reported an innovation said that their company engaged in activities to develop employee knowledge and skills (table 4). This is followed by one-third each of companies who engaged in acquisition of machinery, equipment, and other tangible assets (34%) and in marketing and brand equity activities (33%) and by one-quarter of companies who engaged in R&D activities (25%).
The Annual Business Survey (ABS) measured innovation by asking companies if they had any incidence of innovation during a 3-year period. For example, the 2023 ABS (data year 2022) asked about innovation during the period 2020–22. Detail by size category may not add to total because of rounding. Companies may be counted in zero, one, or more innovation activity categories. Statistics are representative of companies located in the United States.
National Center for Science and Engineering Statistics and Census Bureau, 2023 Annual Business Survey: Data Year 2022.
Innovation and Government Aid
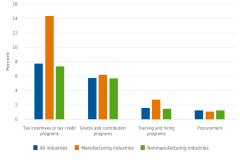
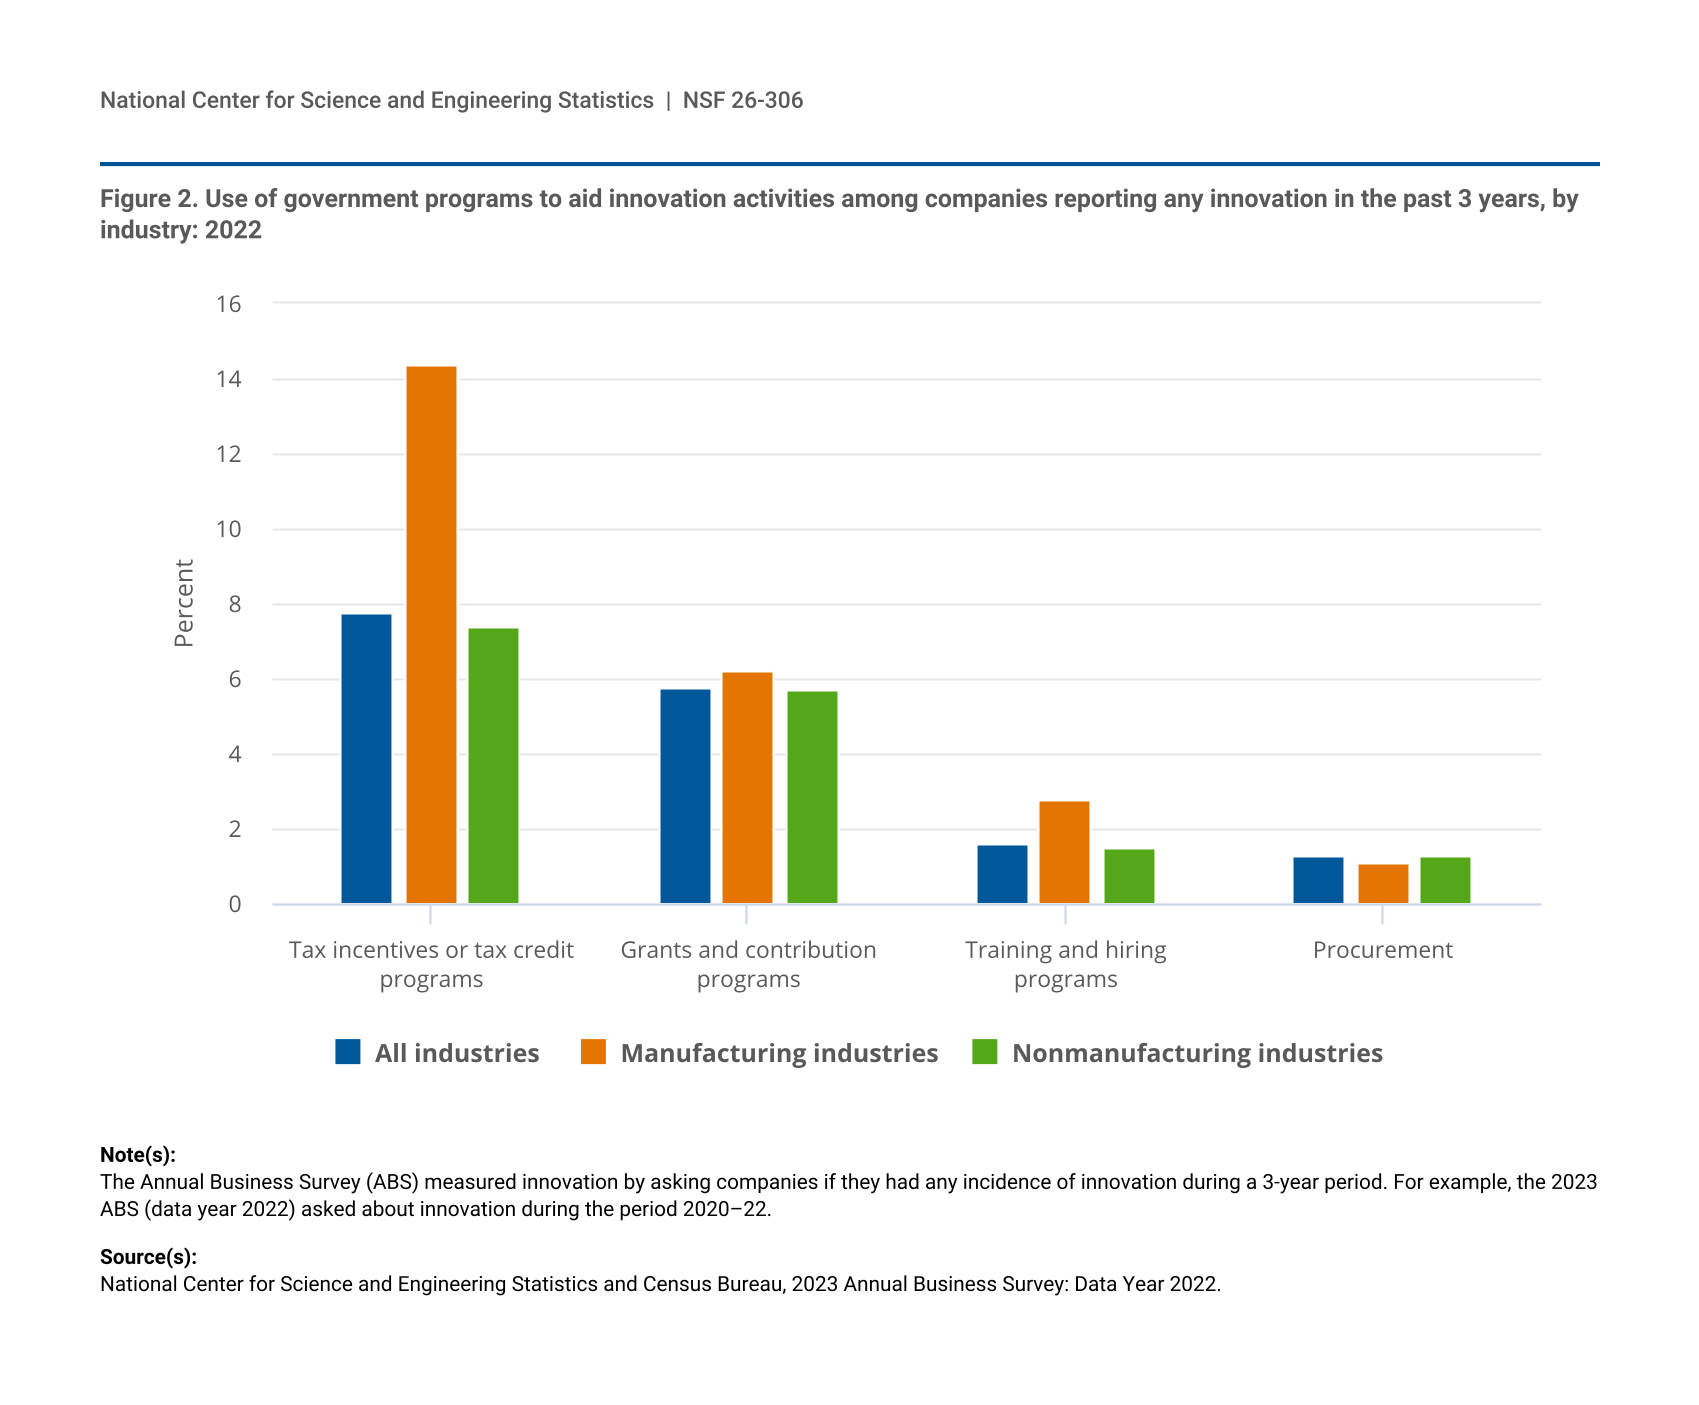
Although some businesses partnered with governments on innovation, few businesses used government programs to aid in innovation activities. Overall, 8% of innovative companies used tax incentives or tax credit programs to aid in innovation activities, 6% used government grants and contribution programs, 2% used training and hiring programs, and 1% used government procurement programs (figure 2).
| Industry | All industries | Manufacturing industries | Nonmanufacturing industries |
|---|---|---|---|
| Tax incentives or tax credit programs | 7.8 | 14.4 | 7.4 |
| Grants and contribution programs | 5.8 | 6.2 | 5.7 |
| Training and hiring programs | 1.6 | 2.8 | 1.5 |
| Procurement | 1.3 | 1.1 | 1.3 |
The Annual Business Survey (ABS) measured innovation by asking companies if they had any incidence of innovation during a 3-year period. For example, the 2023 ABS (data year 2022) asked about innovation during the period 2020–22.
National Center for Science and Engineering Statistics and Census Bureau, 2023 Annual Business Survey: Data Year 2022.
Innovative manufacturing companies were twice as likely to use government tax incentive programs as were innovative nonmanufacturing companies (14% versus 7%). The aerospace products and parts industry (NAICS 3364) and the communications equipment industry (NAICS 3342) were the manufacturing industries with the highest use of government tax incentives at 27% and 25%, respectively.
Barriers to Innovation
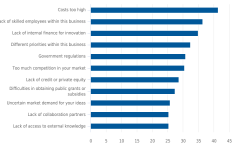
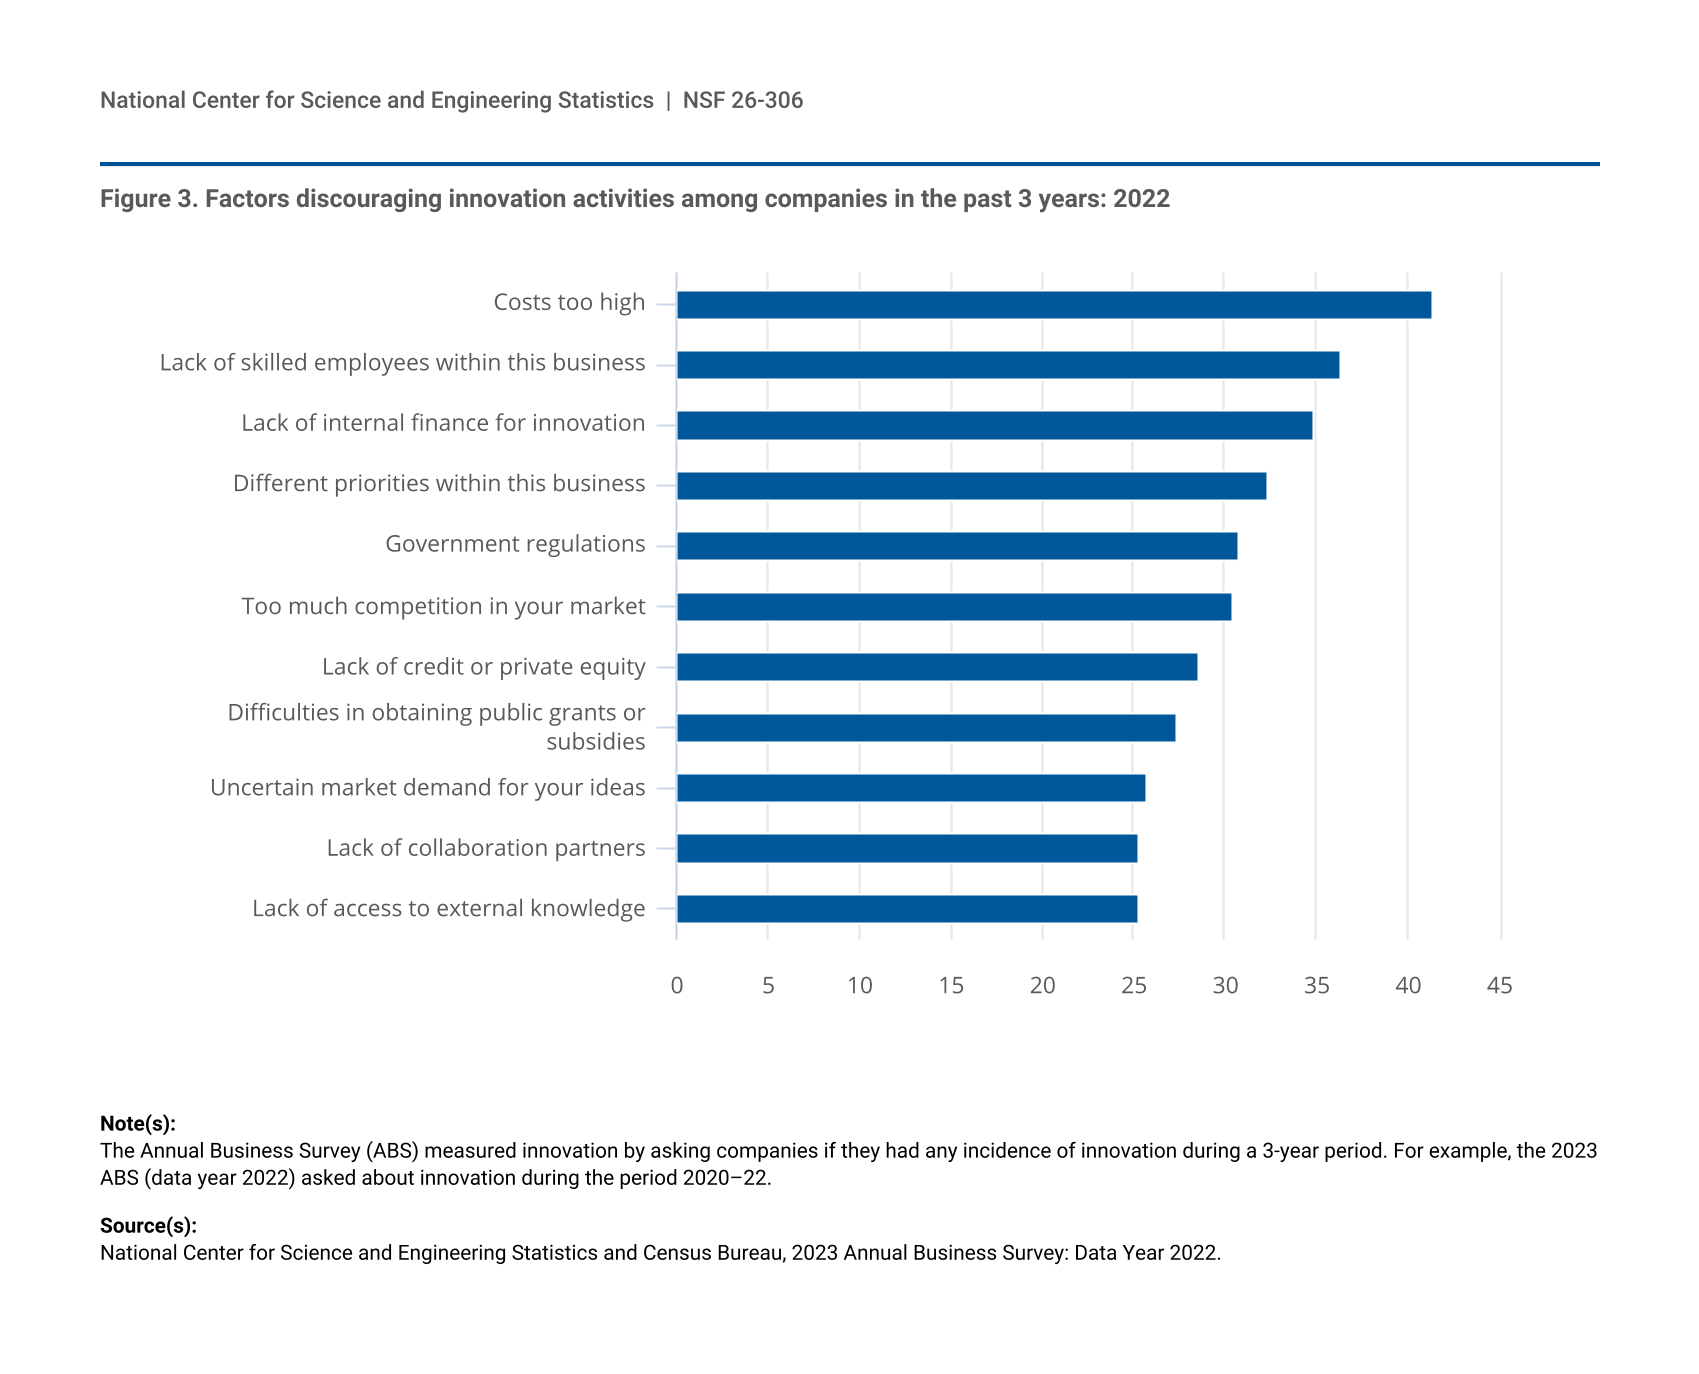
All businesses were asked about 11 potential barriers to innovation. Costs being too high were cited by 41% of businesses. This was followed by lack of skilled employees (36%), lack of internal finance for innovation activities (35%), and different priorities for the business (32%) (figure 3).
| Factor | Percent |
|---|---|
| Costs too high | 41.3 |
| Lack of skilled employees within this business | 36.3 |
| Lack of internal finance for innovation | 34.9 |
| Different priorities within this business | 32.3 |
| Government regulations | 30.8 |
| Too much competition in your market | 30.4 |
| Lack of credit or private equity | 28.6 |
| Difficulties in obtaining public grants or subsidies | 27.3 |
| Uncertain market demand for your ideas | 25.7 |
| Lack of collaboration partners | 25.3 |
| Lack of access to external knowledge | 25.3 |
The Annual Business Survey (ABS) measured innovation by asking companies if they had any incidence of innovation during a 3-year period. For example, the 2023 ABS (data year 2022) asked about innovation during the period 2020–22.
National Center for Science and Engineering Statistics and Census Bureau, 2023 Annual Business Survey: Data Year 2022.
Collaboration Partners
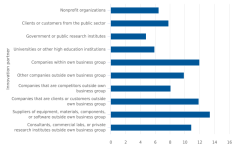
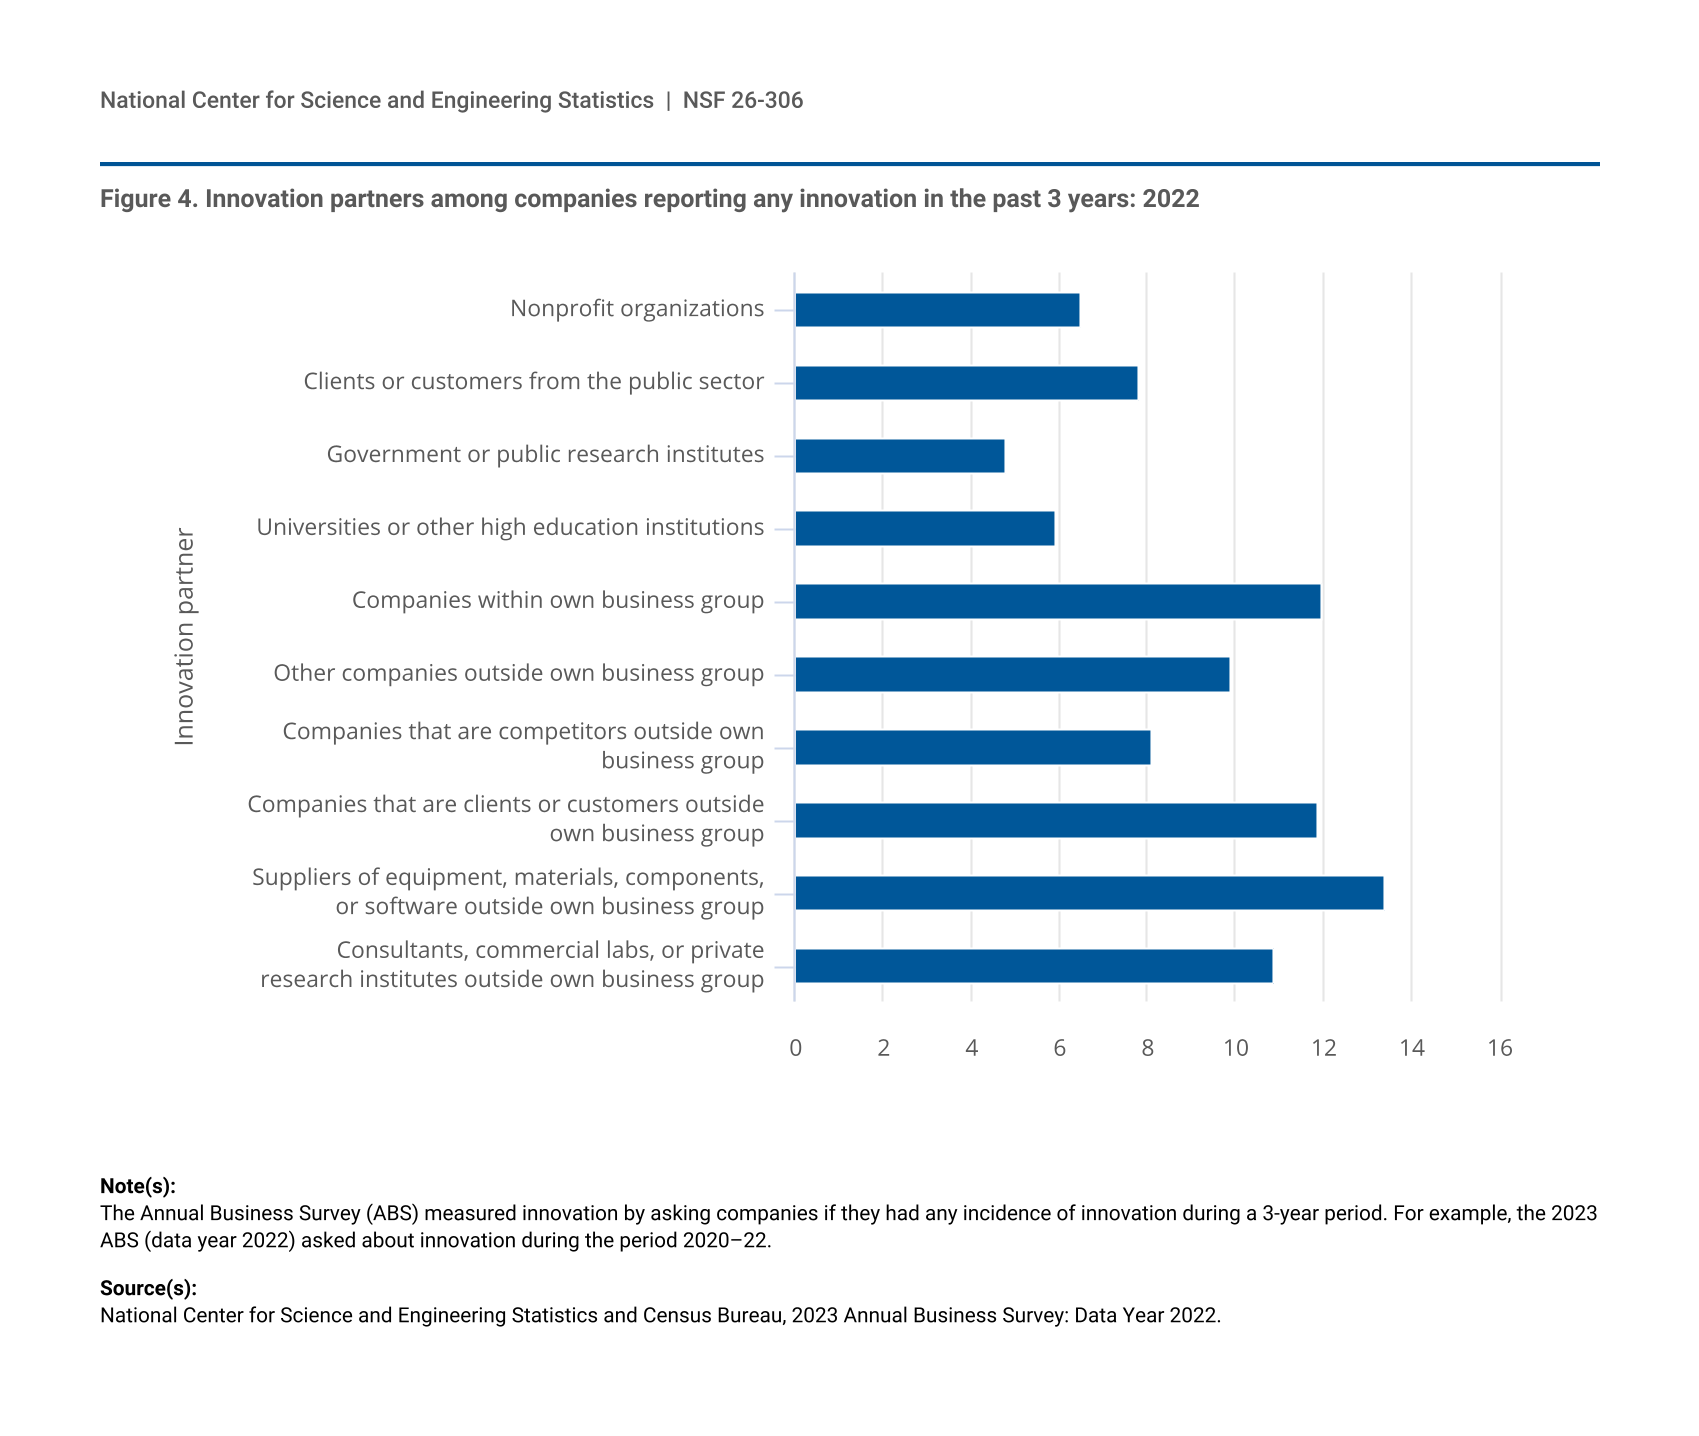
Lack of collaboration partners was mentioned by 25% of businesses when respondents were asked about potential barriers to innovation (figure 3). For those businesses that reported innovation, 13% reported suppliers as partners in innovation, followed by companies within their own business group and by companies that are clients or customers outside their own business group at 12% each (figure 4). Only 6% of businesses that were innovative reported academic institutions as partners, and 5% reported government or other public research institutions as partners.
| Innovation partner | Percent |
|---|---|
| Nonprofit organizations | 6.5 |
| Clients or customers from the public sector | 7.8 |
| Government or public research institutes | 4.8 |
| Universities or other high education institutions | 5.9 |
| Companies within own business group | 12.0 |
| Other companies outside own business group | 9.9 |
| Companies that are competitors outside own business group | 8.1 |
| Companies that are clients or customers outside own business group | 11.9 |
| Suppliers of equipment, materials, components, or software outside own business group | 13.4 |
| Consultants, commercial labs, or private research institutes outside own business group | 10.9 |
The Annual Business Survey (ABS) measured innovation by asking companies if they had any incidence of innovation during a 3-year period. For example, the 2023 ABS (data year 2022) asked about innovation during the period 2020–22.
National Center for Science and Engineering Statistics and Census Bureau, 2023 Annual Business Survey: Data Year 2022.
Data Source, Limitations, and Availability
The ABS is a sample survey, designed to collect a wide range of data on business R&D, intellectual property, company and primary owner characteristics, and innovation activities in the United States. The ABS was developed and is cosponsored by the National Center for Science and Engineering Statistics and by the Census Bureau. The statistics from the survey are based on a sample, and as such, they are subject to both sampling and nonsampling errors (see the survey technical notes).
For the 2023 ABS, a total of 850,000 employer companies were sampled to represent the population of 4.9 million employer companies. The unit response rate was 62.0%.
The full set of data tables on innovation, R&D, company demographics, technology, and patent and intellectual property protection from this survey are available in the report Annual Business Survey: 2023 (data year 2022) at https://ncses.nsf.gov/surveys/annual-business-survey/2023#data. Tables with relative standard errors and imputation rates from the 2023 survey are available upon request.
The estimates in this InfoBrief are based on responses from a sample of the population and may differ from actual values because of sampling variability or other factors. As a result, apparent differences between the estimates for two or more groups may not be statistically significant. All comparative statements in this InfoBrief have undergone statistical testing and are significant at the 90% confidence level unless otherwise noted. The ABS used the extended delete-a-group jackknife variance estimator.
Notes
1 Organisation for Economic Co-operation and Development (OECD) and Eurostat. 2018. Oslo Manual 2018: Guidelines for Collecting, Reporting and Using Data on Innovation, 4th ed. The Measurement of Scientific, Technological and Innovation Activities. OECD Publishing, Paris/Eurostat, Luxembourg.
2 Organisation for Economic Co-operation and Development (OECD) and Eurostat. 2018. Oslo Manual 2018: Guidelines for Collecting, Reporting and Using Data on Innovation, 4th ed., p. 20. The Measurement of Scientific, Technological and Innovation Activities. OECD Publishing, Paris/Eurostat, Luxembourg.
3 See table 55 in the full set of data tables.
Suggested Citation
National Center for Science and Engineering Statistics (NCSES). 2026. Innovation Data from the 2023 Annual Business Survey: Data Year 2022. NSF 26-306. Alexandria, VA: U.S. National Science Foundation. Available at https://ncses.nsf.gov/pubs/nsf26306.
Contact Us
National Center for Science and Engineering Statistics
Directorate for Social, Behavioral and Economic Sciences
U.S. National Science Foundation
Tel: (703) 292-8780
FIRS: (800) 877-8339
TDD: (800) 281-8749
E-mail: ncsesweb@nsf.gov