 An official website of the United States government
U.S. R&D Totaled $937 Billion in 2023; Estimate for 2024 Indicates Further Increase to $993 Billion
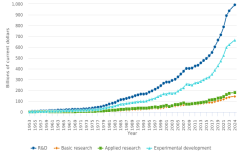
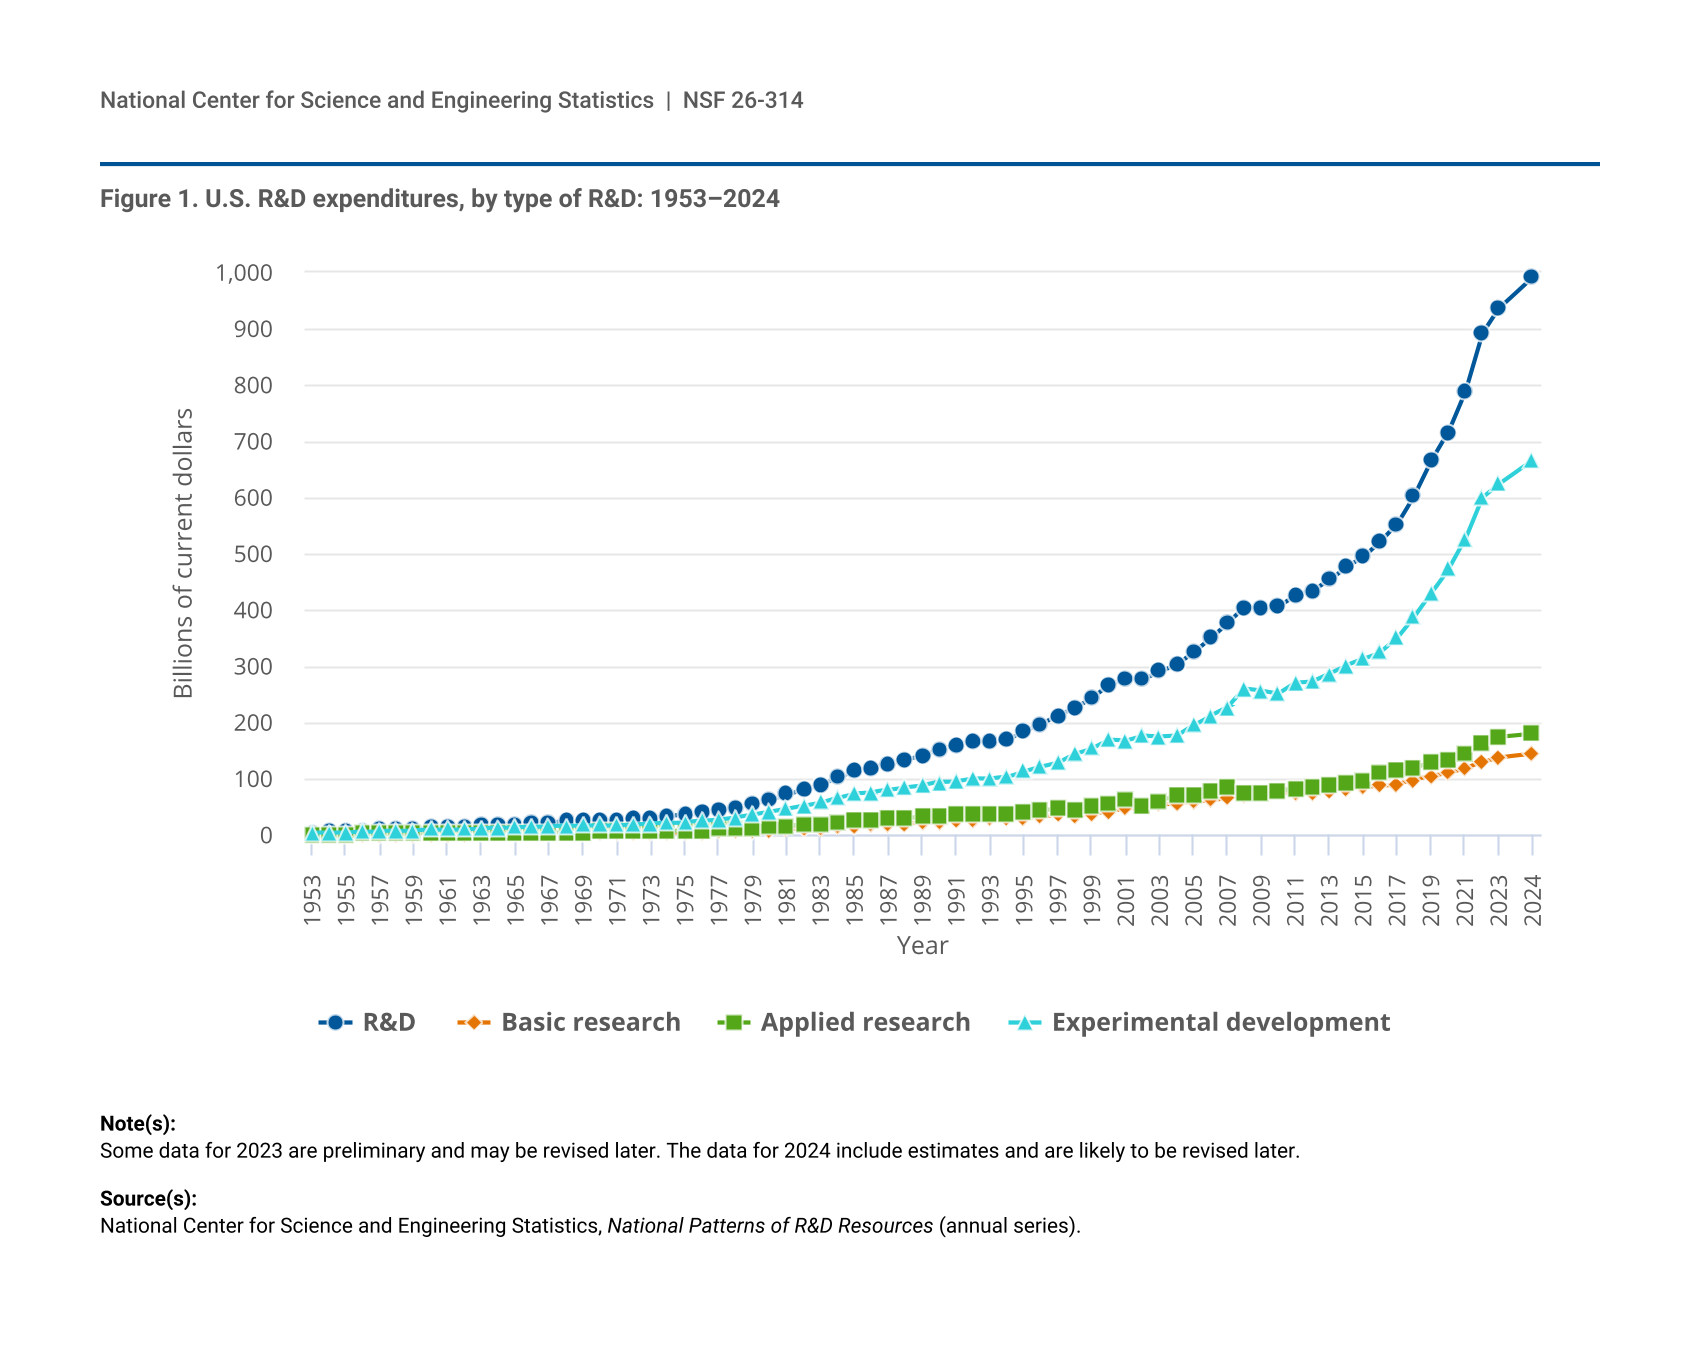
New data from the National Center for Science and Engineering Statistics (NCSES) within the U.S. National Science Foundation indicate that research and experimental development (R&D) performed in the United States totaled $937 billion in 2023 (figure 1). The estimated total for 2024, based on performer-reported expectations, is $993 billion. These data present details on the nature of the R&D activity (type of R&D), the sector performing the activity (R&D performer), and sector paying for the R&D activity (R&D funding source). Each aspect is of interest in part because of variation in direct and indirect benefits of the knowledge, products, and processes resulting from R&D activities.
| Year | R&D | Basic research | Applied research | Experimental development |
|---|---|---|---|---|
| 1953 | 5.16 | 0.46 | 1.29 | 3.41 |
| 1954 | 5.62 | 0.51 | 1.38 | 3.73 |
| 1955 | 6.19 | 0.57 | 1.50 | 4.11 |
| 1956 | 8.50 | 0.72 | 1.93 | 5.85 |
| 1957 | 9.91 | 0.81 | 2.41 | 6.68 |
| 1958 | 10.92 | 0.94 | 2.76 | 7.21 |
| 1959 | 12.49 | 1.09 | 2.94 | 8.46 |
| 1960 | 13.71 | 1.29 | 3.07 | 9.36 |
| 1961 | 14.56 | 1.51 | 3.12 | 9.93 |
| 1962 | 15.64 | 1.82 | 3.70 | 10.11 |
| 1963 | 17.52 | 2.12 | 3.86 | 11.54 |
| 1964 | 19.10 | 2.40 | 4.20 | 12.51 |
| 1965 | 20.25 | 2.66 | 4.37 | 13.22 |
| 1966 | 22.07 | 2.93 | 4.65 | 14.49 |
| 1967 | 23.35 | 3.17 | 4.85 | 15.33 |
| 1968 | 24.67 | 3.38 | 5.14 | 16.15 |
| 1969 | 26.00 | 3.49 | 5.45 | 17.05 |
| 1970 | 26.27 | 3.59 | 5.75 | 16.92 |
| 1971 | 26.95 | 3.72 | 5.83 | 17.40 |
| 1972 | 28.74 | 3.85 | 6.15 | 18.74 |
| 1973 | 30.95 | 4.10 | 6.66 | 20.20 |
| 1974 | 33.36 | 4.51 | 7.34 | 21.50 |
| 1975 | 35.67 | 4.87 | 8.09 | 22.71 |
| 1976 | 39.43 | 5.37 | 8.98 | 25.09 |
| 1977 | 43.34 | 6.01 | 9.66 | 27.67 |
| 1978 | 48.72 | 6.96 | 10.70 | 31.06 |
| 1979 | 55.38 | 7.84 | 12.10 | 35.45 |
| 1980 | 63.22 | 8.75 | 13.73 | 40.75 |
| 1981 | 72.29 | 9.66 | 16.33 | 46.31 |
| 1982 | 80.75 | 10.65 | 18.22 | 51.88 |
| 1983 | 89.95 | 11.88 | 20.30 | 57.77 |
| 1984 | 102.24 | 13.33 | 22.45 | 66.46 |
| 1985 | 114.67 | 14.75 | 25.40 | 74.52 |
| 1986 | 120.25 | 17.15 | 27.24 | 75.86 |
| 1987 | 126.36 | 18.48 | 27.95 | 79.93 |
| 1988 | 133.88 | 19.79 | 29.53 | 84.57 |
| 1989 | 141.89 | 21.89 | 32.28 | 87.72 |
| 1990 | 151.99 | 23.03 | 34.90 | 94.07 |
| 1991 | 160.88 | 27.14 | 38.63 | 95.10 |
| 1992 | 165.35 | 27.60 | 37.94 | 99.81 |
| 1993 | 165.73 | 28.74 | 37.28 | 99.71 |
| 1994 | 169.21 | 29.65 | 36.62 | 102.94 |
| 1995 | 183.63 | 29.61 | 40.94 | 113.08 |
| 1996 | 197.35 | 32.80 | 43.17 | 121.38 |
| 1997 | 211.89 | 36.72 | 46.52 | 128.66 |
| 1998 | 225.76 | 34.84 | 46.25 | 144.67 |
| 1999 | 244.45 | 38.28 | 51.85 | 154.32 |
| 2000 | 267.95 | 42.03 | 56.50 | 169.41 |
| 2001 | 278.54 | 46.36 | 64.20 | 167.97 |
| 2002 | 277.91 | 50.40 | 50.54 | 176.97 |
| 2003 | 291.37 | 54.82 | 60.98 | 175.56 |
| 2004 | 302.73 | 56.38 | 69.32 | 177.03 |
| 2005 | 325.29 | 59.90 | 69.77 | 195.62 |
| 2006 | 350.91 | 61.55 | 76.50 | 212.86 |
| 2007 | 377.89 | 66.49 | 83.66 | 227.74 |
| 2008 | 404.78 | 70.47 | 74.73 | 259.58 |
| 2009 | 402.93 | 74.38 | 72.59 | 255.96 |
| 2010 | 406.60 | 76.43 | 78.91 | 251.26 |
| 2011 | 426.21 | 73.67 | 81.73 | 270.82 |
| 2012 | 433.70 | 73.97 | 86.63 | 273.10 |
| 2013 | 454.24 | 79.21 | 88.00 | 287.02 |
| 2014 | 475.94 | 82.84 | 91.63 | 301.46 |
| 2015 | 494.47 | 84.38 | 97.09 | 313.00 |
| 2016 | 521.69 | 87.45 | 109.48 | 324.76 |
| 2017 | 553.53 | 90.05 | 113.33 | 350.15 |
| 2018 | 603.84 | 97.72 | 118.28 | 387.84 |
| 2019 | 665.27 | 104.79 | 130.14 | 430.33 |
| 2020 | 716.48 | 111.56 | 132.39 | 472.53 |
| 2021 | 788.73 | 118.55 | 143.76 | 526.42 |
| 2022 | 891.88 | 130.17 | 161.69 | 600.02 |
| 2023 | 937.24 | 138.14 | 174.08 | 625.02 |
| 2024 | 993.43 | 144.81 | 180.44 | 668.18 |
Some data for 2023 are preliminary and may be revised later. The data for 2024 include estimates and are likely to be revised later.
National Center for Science and Engineering Statistics, National Patterns of R&D Resources (annual series).
Trends in R&D, by Type
Of the $937 billion in 2023 U.S. domestic R&D performance, $138 billion was basic research, $174 billion was applied research, and $625 billion was experimental development (figure 1). Experimental development accounts for 67% of domestic R&D expenditures for 2021–24. This is comparable to the experimental development share in the 1950s. The share of R&D performance classified as basic research was 9% in 1953 and 15% in 2023; the share classified as applied research was 25% in 1953 and 19% in 2023.
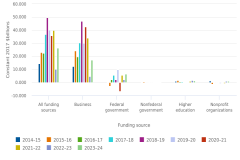
Trends in Funding Sources for Domestic R&D Performance
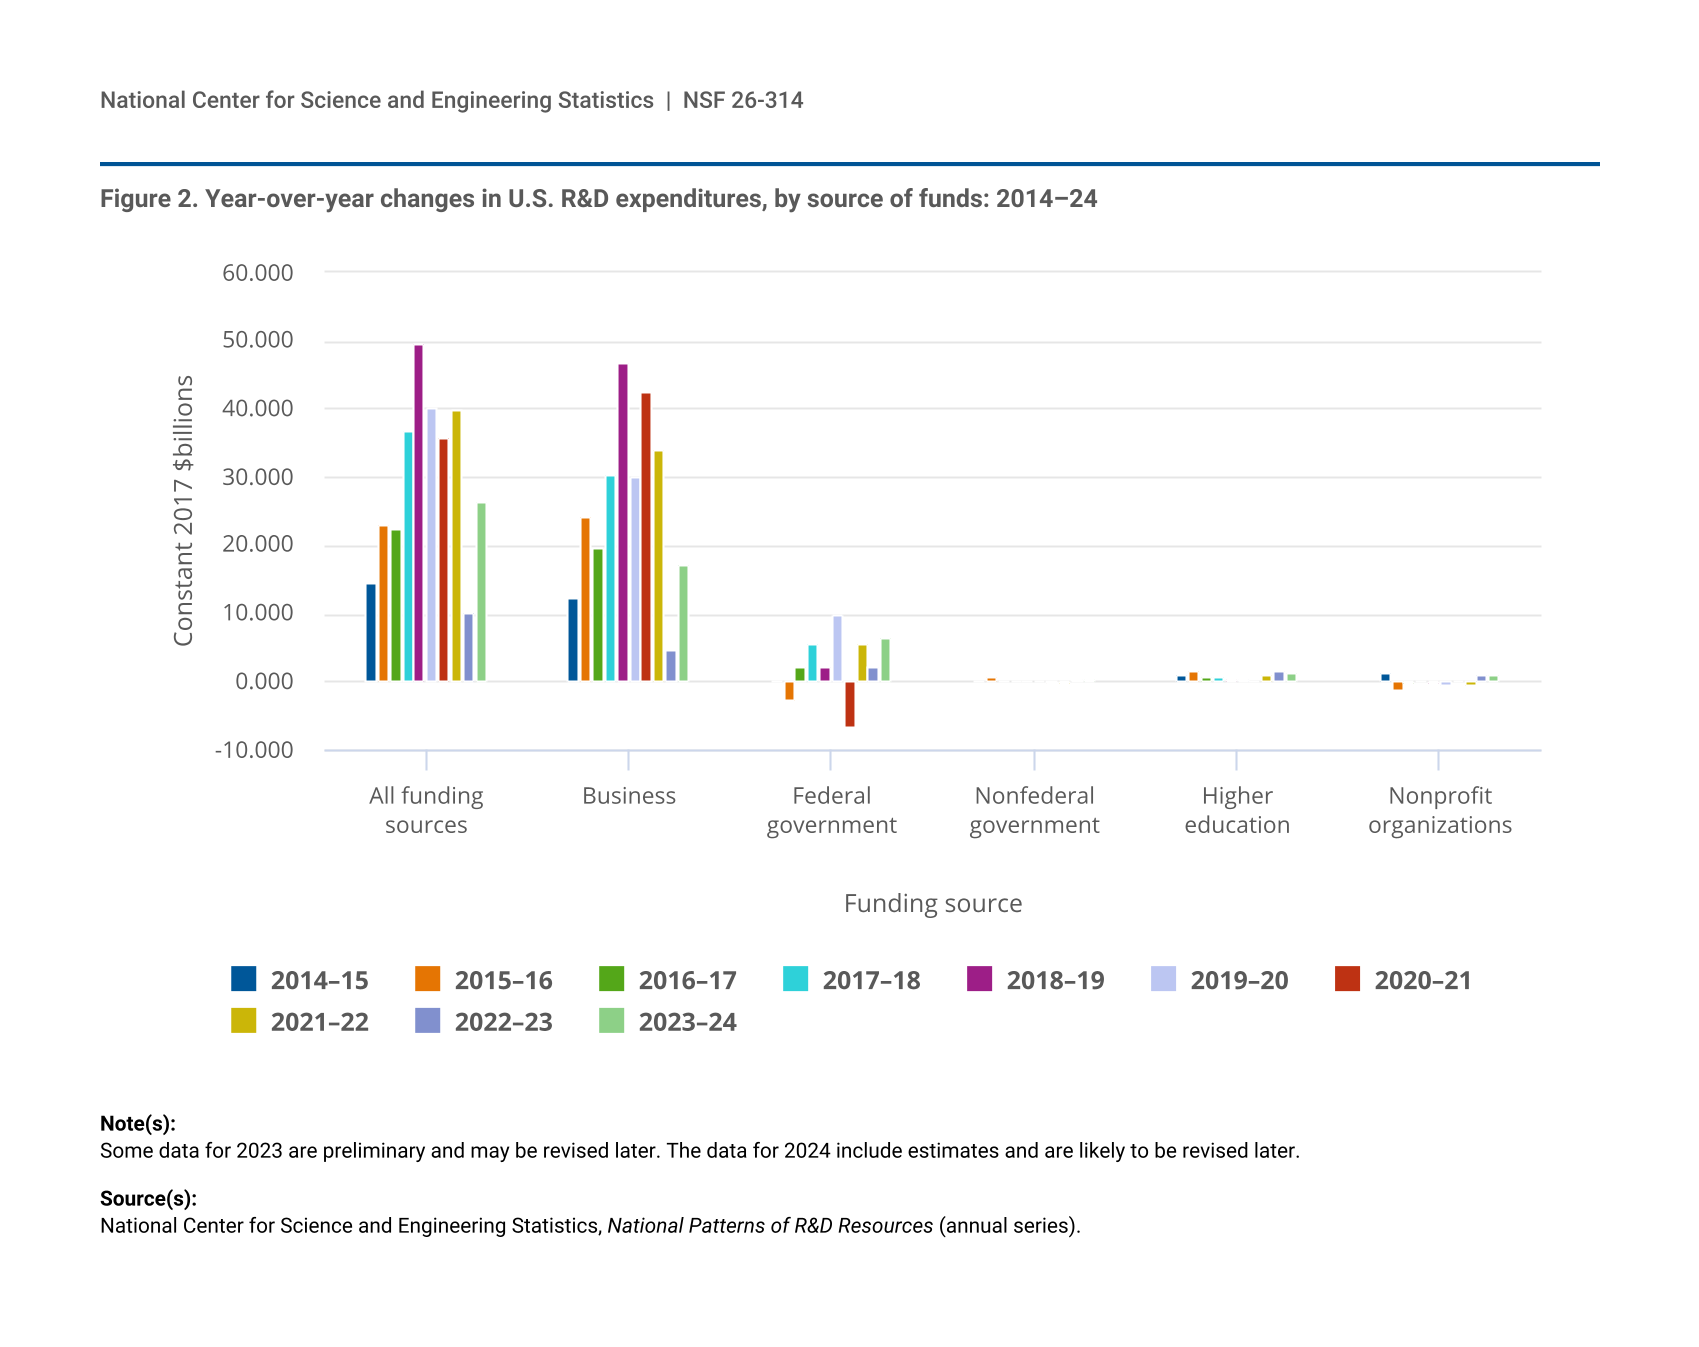
Adjusting for inflation (in constant 2017 dollars), U.S. total R&D expenditures are estimated to be $792 billion in 2024 (data tables: table 6). The business sector funded $592 billion of this amount and the federal government funded an additional $148 billion. The $26 billion increase in total domestic R&D performance between 2023 and 2024 is largely based on the $17 billion increase in business funding for R&D, with the federal government accounting for an additional $7 billion of the increase (figure 2). During the 2023 Business Enterprise Research and Development (BERD) Survey data collection of 2023 R&D expenditures and projected 2024 R&D expenditures, some respondents revised their reporting practices and eliminated expenditures that did not meet the definition of R&D. The revised reporting has resulted in a meaningful decrease in the 2023 U.S. R&D performance compared to the amount that could be estimated based on data reported in 2022. This change also affected the comparability of the 2023 and 2024 estimates to those published for years prior to 2023.
| Funding source | 2014–15 | 2015–16 | 2016–17 | 2017–18 | 2018–19 | 2019–20 | 2020–21 | 2021–22 | 2022–23 | 2023–24 |
|---|---|---|---|---|---|---|---|---|---|---|
| All funding sources | 14.506 | 22.924 | 22.499 | 36.791 | 49.489 | 40.111 | 35.896 | 39.864 | 10.097 | 26.254 |
| Business | 12.205 | 24.310 | 19.788 | 30.388 | 46.825 | 30.026 | 42.547 | 34.017 | 4.760 | 17.290 |
| Federal government | 0.068 | -2.539 | 2.146 | 5.647 | 2.373 | 9.981 | -6.789 | 5.737 | 2.269 | 6.541 |
| Nonfederal government | 0.025 | 0.690 | -0.009 | 0.057 | 0.129 | 0.122 | -0.180 | -0.110 | 0.389 | 0.304 |
| Higher education | 0.960 | 1.478 | 0.753 | 0.625 | 0.510 | 0.386 | 0.177 | 0.881 | 1.583 | 1.248 |
| Nonprofit organizations | 1.248 | -1.015 | -0.179 | 0.074 | -0.348 | -0.404 | 0.141 | -0.661 | 1.097 | 0.870 |
Some data for 2023 are preliminary and may be revised later. The data for 2024 include estimates and are likely to be revised later.
National Center for Science and Engineering Statistics, National Patterns of R&D Resources (annual series).
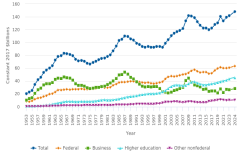
Federal Funding for R&D, by Performer
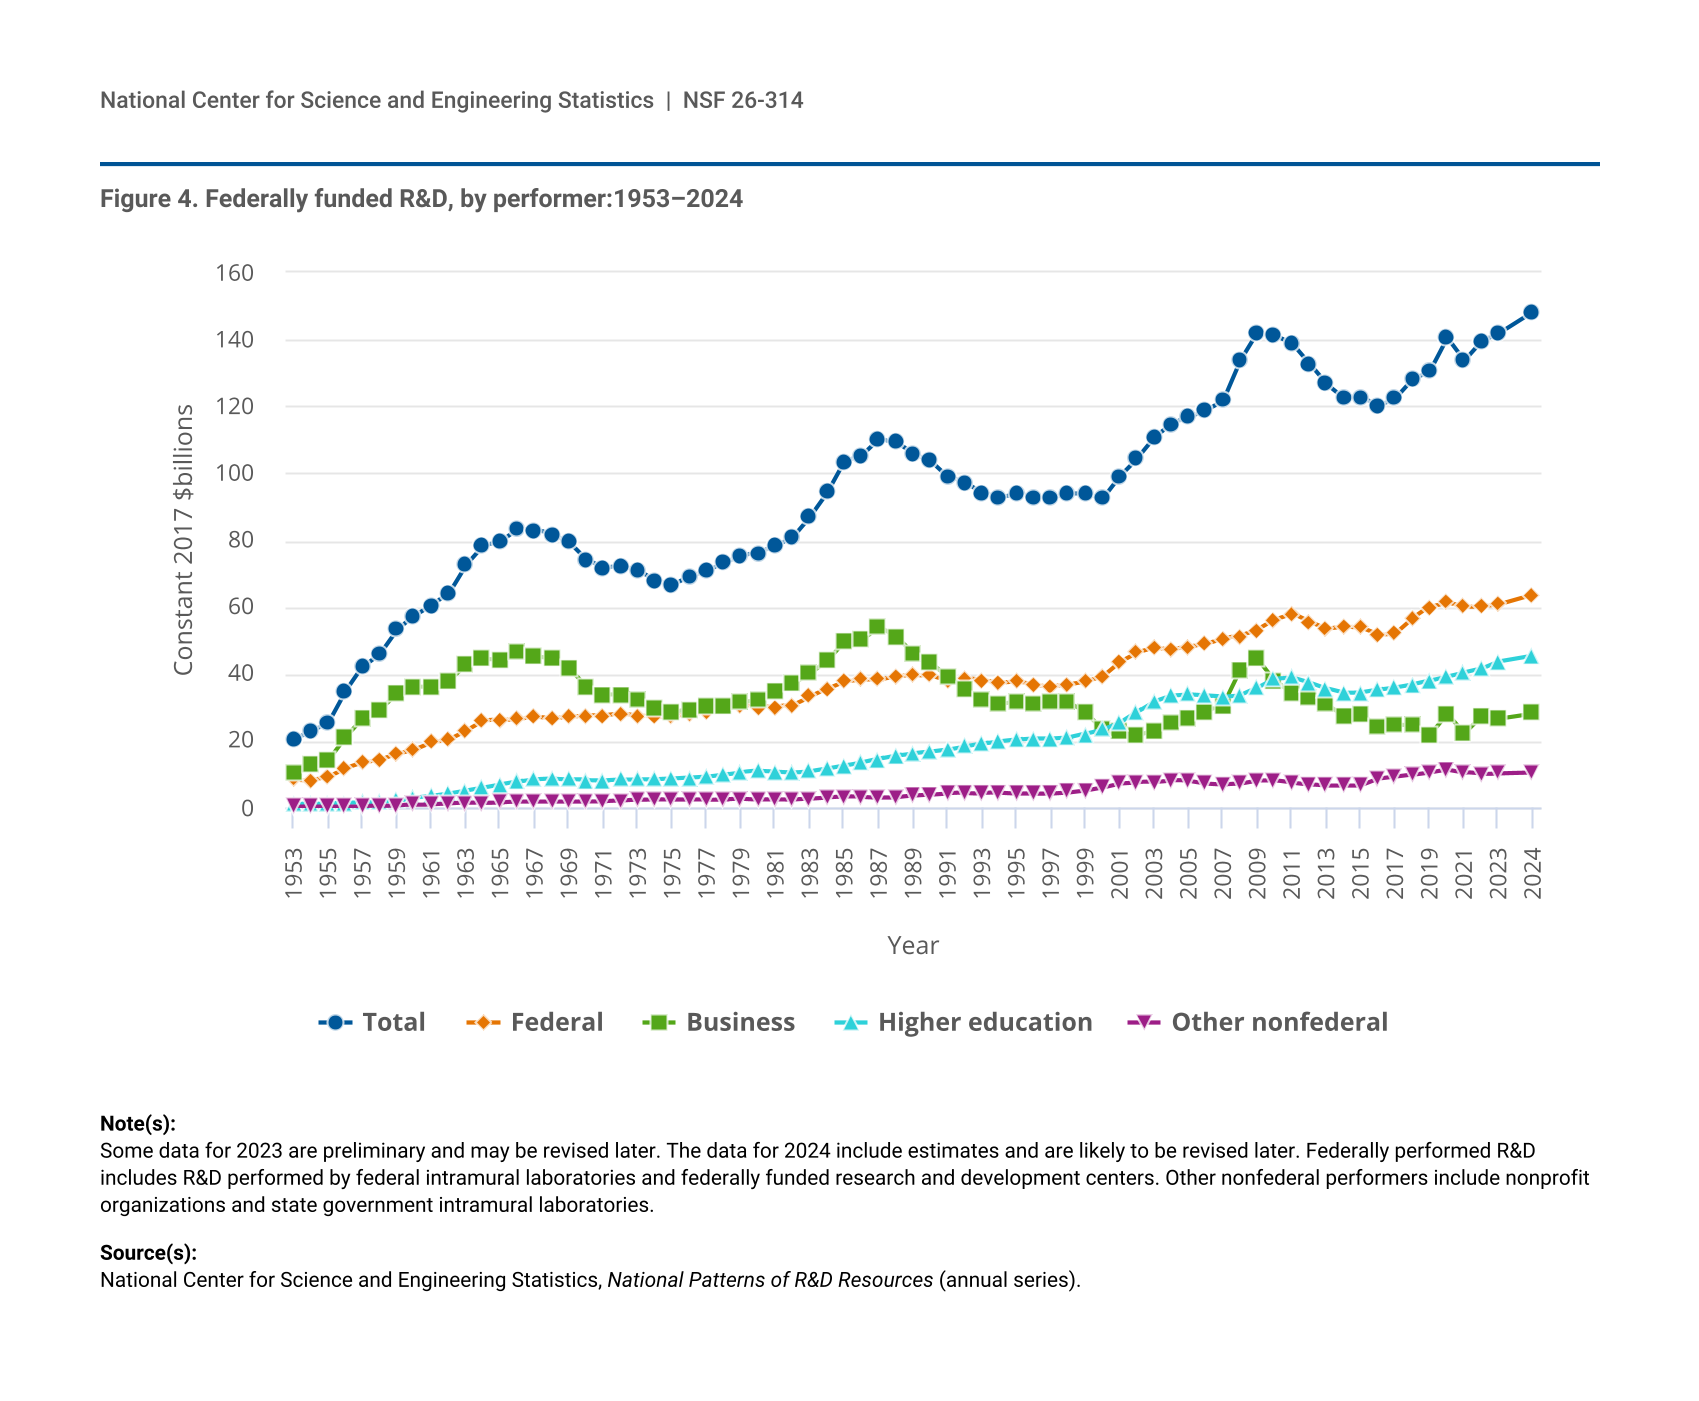
The federal government provides funding for R&D that is performed by organizations in all sectors of the economy. R&D performers include the federal government (intramural laboratories and federally funded research and development centers [FFRDCs]), private businesses, higher education institutions, nonprofit organizations, and nonfederal governments such as state and local governments. Using inflation adjusted dollars (i.e., constant 2017 dollars), the federal government funded $142 billion in R&D in 2023 (figure 4). Of the R&D funded by the federal government in 2023, $61 billion was performed by the federal government (federal intramural and FFRDCs combined), $44 billion was performed by universities and $27 billion by businesses. In recent years, federal funding for R&D performed by the federal government (federal intramural and FFRDCs combined) and federal funding for R&D performed by universities have each exceeded federal funding for R&D performed by businesses.
| Year | Total | Federal | Business | Higher education | Other nonfederal |
|---|---|---|---|---|---|
| 1953 | 20.69 | 8.52 | 10.63 | 1.11 | 0.43 |
| 1954 | 22.86 | 8.31 | 12.90 | 1.21 | 0.45 |
| 1955 | 25.41 | 9.36 | 14.20 | 1.38 | 0.47 |
| 1956 | 34.88 | 11.85 | 20.98 | 1.55 | 0.50 |
| 1957 | 42.27 | 13.46 | 26.64 | 1.64 | 0.53 |
| 1958 | 46.25 | 14.34 | 29.42 | 1.86 | 0.63 |
| 1959 | 53.42 | 16.16 | 34.12 | 2.33 | 0.81 |
| 1960 | 57.53 | 17.49 | 36.16 | 2.92 | 0.96 |
| 1961 | 60.56 | 19.63 | 36.30 | 3.55 | 1.08 |
| 1962 | 63.96 | 20.46 | 37.91 | 4.33 | 1.26 |
| 1963 | 72.63 | 23.18 | 42.76 | 5.23 | 1.46 |
| 1964 | 78.42 | 26.19 | 44.58 | 6.11 | 1.54 |
| 1965 | 79.60 | 26.39 | 44.45 | 7.04 | 1.73 |
| 1966 | 83.14 | 26.55 | 46.82 | 7.84 | 1.93 |
| 1967 | 83.06 | 27.29 | 45.32 | 8.50 | 1.95 |
| 1968 | 81.86 | 26.64 | 44.56 | 8.68 | 1.99 |
| 1969 | 79.41 | 27.27 | 41.65 | 8.47 | 2.02 |
| 1970 | 74.22 | 27.66 | 36.19 | 8.35 | 2.03 |
| 1971 | 71.70 | 27.57 | 33.82 | 8.29 | 2.01 |
| 1972 | 72.48 | 28.06 | 33.75 | 8.54 | 2.13 |
| 1973 | 71.06 | 27.47 | 32.56 | 8.60 | 2.42 |
| 1974 | 67.95 | 27.18 | 29.76 | 8.49 | 2.51 |
| 1975 | 66.67 | 27.27 | 28.34 | 8.63 | 2.43 |
| 1976 | 69.19 | 28.27 | 29.56 | 8.93 | 2.42 |
| 1977 | 70.85 | 28.62 | 30.57 | 9.29 | 2.38 |
| 1978 | 73.22 | 30.44 | 30.31 | 9.98 | 2.49 |
| 1979 | 75.40 | 30.57 | 31.44 | 10.66 | 2.73 |
| 1980 | 76.16 | 30.18 | 32.39 | 11.01 | 2.58 |
| 1981 | 78.29 | 30.16 | 34.80 | 10.84 | 2.49 |
| 1982 | 81.15 | 30.74 | 37.28 | 10.66 | 2.47 |
| 1983 | 87.17 | 33.31 | 40.16 | 10.96 | 2.75 |
| 1984 | 94.32 | 35.56 | 43.96 | 11.67 | 3.14 |
| 1985 | 103.57 | 37.83 | 49.84 | 12.57 | 3.33 |
| 1986 | 105.35 | 38.40 | 50.15 | 13.55 | 3.25 |
| 1987 | 110.31 | 38.36 | 54.12 | 14.62 | 3.21 |
| 1988 | 109.31 | 39.18 | 51.30 | 15.62 | 3.20 |
| 1989 | 105.77 | 39.76 | 46.11 | 16.30 | 3.61 |
| 1990 | 103.89 | 39.67 | 43.51 | 16.76 | 3.96 |
| 1991 | 99.14 | 38.07 | 39.30 | 17.40 | 4.37 |
| 1992 | 97.14 | 38.61 | 35.67 | 18.38 | 4.47 |
| 1993 | 94.29 | 38.22 | 32.47 | 19.17 | 4.43 |
| 1994 | 92.70 | 37.54 | 30.90 | 19.82 | 4.44 |
| 1995 | 94.07 | 37.87 | 31.64 | 20.31 | 4.25 |
| 1996 | 93.00 | 36.75 | 31.33 | 20.66 | 4.26 |
| 1997 | 92.82 | 36.39 | 31.44 | 20.65 | 4.35 |
| 1998 | 94.00 | 36.86 | 31.50 | 20.96 | 4.68 |
| 1999 | 93.96 | 37.75 | 28.82 | 22.10 | 5.29 |
| 2000 | 92.46 | 39.21 | 23.54 | 23.51 | 6.20 |
| 2001 | 99.24 | 43.61 | 22.73 | 25.52 | 7.38 |
| 2002 | 104.45 | 46.40 | 21.72 | 28.68 | 7.65 |
| 2003 | 110.55 | 47.82 | 23.11 | 31.90 | 7.72 |
| 2004 | 114.82 | 47.26 | 25.63 | 33.67 | 8.27 |
| 2005 | 116.99 | 48.08 | 26.86 | 34.02 | 8.02 |
| 2006 | 118.87 | 49.02 | 28.91 | 33.63 | 7.31 |
| 2007 | 121.75 | 50.61 | 30.79 | 33.27 | 7.08 |
| 2008 | 133.63 | 51.36 | 41.31 | 33.67 | 7.29 |
| 2009 | 142.02 | 53.22 | 44.69 | 35.84 | 8.27 |
| 2010 | 141.26 | 56.21 | 38.15 | 38.69 | 8.21 |
| 2011 | 138.84 | 58.07 | 34.22 | 39.07 | 7.47 |
| 2012 | 132.89 | 55.53 | 32.86 | 37.52 | 6.98 |
| 2013 | 126.76 | 53.50 | 30.98 | 35.71 | 6.57 |
| 2014 | 122.76 | 54.25 | 27.54 | 34.35 | 6.62 |
| 2015 | 122.83 | 53.93 | 27.73 | 34.49 | 6.67 |
| 2016 | 120.29 | 51.73 | 24.59 | 35.31 | 8.66 |
| 2017 | 122.44 | 52.17 | 24.97 | 36.00 | 9.29 |
| 2018 | 128.08 | 56.66 | 24.63 | 36.88 | 9.92 |
| 2019 | 130.46 | 60.02 | 21.79 | 37.99 | 10.66 |
| 2020 | 140.44 | 61.40 | 28.25 | 39.29 | 11.49 |
| 2021 | 133.65 | 60.13 | 22.31 | 40.51 | 10.70 |
| 2022 | 139.38 | 60.26 | 27.38 | 41.60 | 10.14 |
| 2023 | 141.65 | 60.76 | 26.72 | 43.81 | 10.37 |
| 2024 | 148.19 | 63.68 | 28.33 | 45.58 | 10.60 |
Some data for 2023 are preliminary and may be revised later. The data for 2024 include estimates and are likely to be revised later. Federally performed R&D includes R&D performed by federal intramural laboratories and federally funded research and development centers. Other nonfederal performers include nonprofit organizations and state government intramural laboratories.
National Center for Science and Engineering Statistics, National Patterns of R&D Resources (annual series).
Data Sources, Limitations, and Availability
The statistics on U.S. R&D presented in this report derive mainly from integrating the data on R&D expenditures and funding collected by NCSES’s annual national surveys of the organizations that perform and fund the vast majority of U.S. R&D. Data are presented in current and inflation-adjusted dollars. These surveys cover each of four sectors of the economy: higher education, government, business enterprise, and nonprofit organizations. In some cases, the primary data from these surveys are adjusted to enable consistent integration of the statistics across these separately conducted surveys.
The 2024 business R&D data are based on respondents’ projected R&D costs reported on the 2023 BERD Survey, and trends for business R&D performance. Every survey year, some of the variation in BERD estimates is due to changes in individual respondent reporting practices. During the 2023 BERD data collection of 2023 R&D expenditures and projected 2024 R&D expenditures, some respondents revised their reporting practices and eliminated expenditures that did not meet the definition of R&D. This has resulted in a meaningful decrease in preliminary 2023 U.S. R&D performance compared to the amounts estimated based on data reported in 2022. The 2023 and estimated 2024 business R&D expenditures reported here reflect some changes due to revised reporting that occurred in the 2023 BERD. The revised reporting has affected the comparability of the 2023 and 2024 estimates to those published for years prior to 2023.
In addition, preliminary or otherwise estimated values may be used where final data from one or more of the surveys are not yet available but can reasonably be estimated. Estimates in this InfoBrief are based on census and sample survey data that are subject to nonsampling error. Sample-survey–based estimates are also subject to sampling error. All comparative statements in this InfoBrief have undergone statistical testing and are significant at the 90% confidence level except statements reliant on modeled estimates.
The R&D surveys include NCSES’s annual surveys of business R&D (the BERD Survey since 2019, the preceding Business Research and Development Survey for 2017–18, the Business R&D and Innovation Survey for 2008–16, and the Survey of Industrial R&D for 2007 and earlier years). In addition, the business R&D totals include R&D expenditures reported by “micro” companies (defined as companies with fewer than 10 employees) through NCSES surveys fielded for 2016 and forward (the 2016 Business R&D and Innovation Survey—Microbusiness and the Annual Business Survey [ABS] since 2017). Other NCSES survey data sources are the Higher Education Research and Development Survey (since FY 2010), the preceding Survey of R&D Expenditures at Universities and Colleges (FY 2009 and earlier years), the Survey of Federal Funds for Research and Development (FY 2023 and earlier years), the Federal Facilities Research and Development Survey (FY 2024) and the FFRDC Research and Development Survey (FY 2024 and earlier years). In 2024, the data source for federal intramural R&D expenditures changed from the NCSES Survey of Federal Funds for Research and Development to the NCSES Federal Facilities Research and Development Survey. For differences in methodology, see the respective survey pages and NSF 25-305, New Survey Shows R&D Performance Within Federal Facilities Totaled $34.5 Billion in FY 2022. Amounts for the R&D performed by nonprofit organizations with funding from the nonprofit sector and from business sources are estimated based on data and parameters from the FYs 2020–23 Nonprofit Research Activities (NPRA) modules of the ABS, the 2016 NPRA Survey, and the 1996–97 Survey of R&D Funding and Performance by Nonprofit Organizations.
A full set of detailed statistical tables and methodology information for the National Patterns data are available at https://ncses.nsf.gov/data-collections/national-patterns/2023-2024. NCSES has reviewed this product for unauthorized disclosure of confidential information and approved its release (NCSES-DRN25-070).
For further information and questions, contact NCSES.
Notes
1 The Business Enterprise Research and Development survey and the Survey of Federal Funds for Research and Development collect data on respondent projected R&D. Together, these data account for 78% of the 2024 estimated R&D performance. Reported data for fiscal years ending during calendar year 2024 account for an additional 9% of 2024 estimated R&D performance.
2 See the National Patterns “Technical Notes”.
3 Estimates from the NCSES business and nonprofit organization R&D surveys mentioned are all derived from sample data and thereby contain sampling error. Consequently, estimates of total U.S. R&D also contain sampling error. For more information on this topic and other surveys used in the National Patterns tabulations, see the “Technical Notes”.
4 National Center for Science and Engineering Statistics (NCSES). 2024. New Survey Shows R&D Performance Within Federal Facilities Totaled $34.5 Billion in FY 2022. NSF 25-305. Alexandria, VA: U.S. National Science Foundation. Available at https://ncses.nsf.gov/pubs/nsf25305.
Suggested Citation
National Center for Science and Engineering Statistics (NCSES). 2026. U.S. R&D Totaled $937 Billion in 2023; Estimate for 2024 Indicates Further Increase to $993 Billion. NSF 26-314. Alexandria, VA: U.S. National Science Foundation. Available at https://ncses.nsf.gov/pubs/nsf26314.
Contact Us
National Center for Science and Engineering Statistics
Directorate for Social, Behavioral and Economic Sciences
U.S. National Science Foundation
Tel: (703) 292-8780
FIRS: (800) 877-8339
TDD: (800) 281-8749
E-mail: ncsesweb@nsf.gov