 An official website of the United States government

Labor Costs Account for Over Two-Thirds of U.S. Business R&D Performance in 2020
Labor costs accounted for $372 billion of U.S. business research and development expenditures in 2020—or over two-thirds of the $538 billion in business R&D performance. In 2020, these labor costs included $300.0 billion in salaries, wages, and fringe benefits; $48.3 billion in stock-based compensation; and $23.5 billion in temporary staffing. This InfoBrief explores the labor costs of business R&D, highlighting selected characteristics over time and across industries. Data are from the 2020 Business Enterprise Research and Development Survey (BERD), developed and cosponsored by the National Center for Science and Engineering Statistics within the National Science Foundation and by the Census Bureau, which collected and tabulated data for the survey.
Changes in R&D Labor Costs Over Time
In a span of 10 years, business R&D performance in the United States increased 93% in current dollars, from $279 billion in 2010 to $538 billion in 2020 (63% increase in constant dollars). During this period of rapid growth, the share of labor costs in domestic business R&D performance changed relatively little (table 1). Examining detailed labor cost categories (salaries, wages, and fringe benefits; stock-based compensation; and temporary staffing costs) reveals larger relative changes over this period. In particular, the share of R&D performance for stock-based compensation tripled from 3% in 2010 to 9% in 2020. Stock-based compensation typically takes the form of stock options or restricted stock issued to employees, and generally accepted accounting principles (GAAP) require U.S. businesses to expense the fair value of this compensation.
U.S. business R&D performance, by type of cost: 2010, 2015, and 2020
Note(s):
Estimates for 2010 and 2015 do not include companies with fewer than 5 domestic employees. Estimates for 2020 do not include companies with fewer than 10 domestic employees. Detail may not add to total because of rounding. Statistics are representative of companies located in the United States that performed R&D.
Source(s):
National Center for Science and Engineering Statistics and Census Bureau, Business Enterprise Research and Development Survey.
Industry Differences
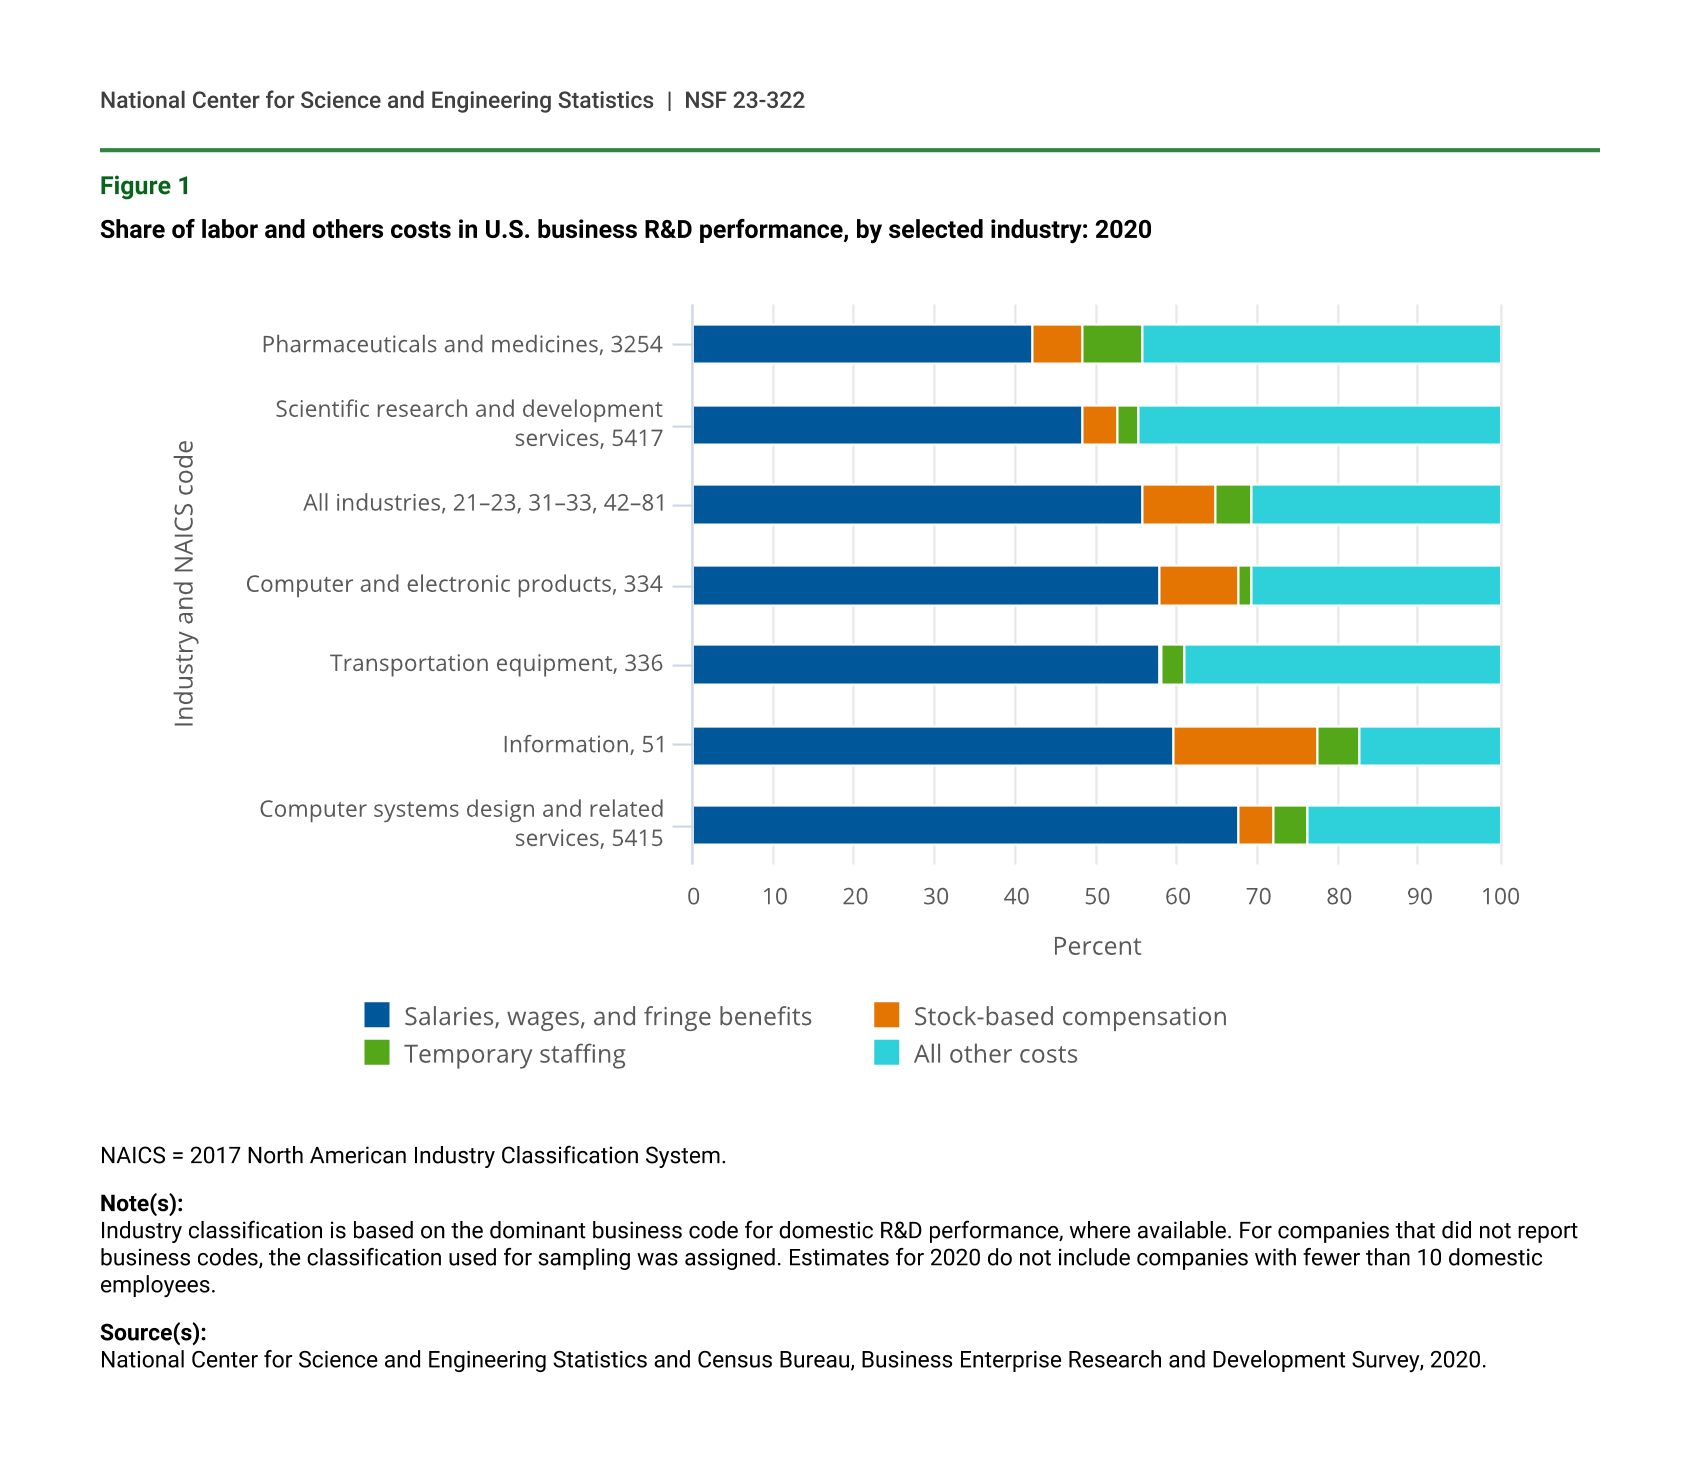
Across all industries, R&D relies on the creative input of skilled and often highly educated workers, but labor costs as a share of total R&D performance varies among the industries tracked by BERD. Labor costs account for half or more of the R&D performed in the United States for all but a few industries. Among the larger industries in terms of R&D performance, pharmaceuticals and medicines manufacturing (North American Industry Classification System [NAICS] code 3254) is relatively less labor-intensive (56%), as defined as labor cost share of R&D expenditures. By contrast, over 80% of the information sector’s (NAICS 51) R&D performance is for labor costs. Looking at the components of labor costs, the information sector is also notable for the share of its R&D performance that is attributed to stock-based compensation (18.0%), which is nearly three times the average for all other industries (6.1%) (figure 1).
Share of labor and others costs in U.S. business R&D performance, by selected industry: 2020
| Industry and NAICS code | Salaries, wages, and fringe benefits | Stock-based compensation | Temporary staffing | All other costs |
|---|---|---|---|---|
| Pharmaceuticals and medicines, 3254 | 42.2 | 6.0 | 7.5 | 44.3 |
| Scientific research and development services, 5417 | 48.3 | 4.3 | 2.6 | 44.8 |
| All industries, 21–23, 31–33, 42–81 | 55.8 | 9.0 | 4.4 | 30.8 |
| Computer and electronic products, 334 | 58.0 | 9.6 | 1.7 | 30.7 |
| Transportation equipment, 336 | 58.0 | 0.2 | 2.7 | 39.1 |
| Information, 51 | 59.6 | 18.0 | 5.0 | 17.4 |
| Computer systems design and related services, 5415 | 67.6 | 4.5 | 4.2 | 23.7 |
NAICS = 2017 North American Industry Classification System.
Note(s):
Industry classification is based on the dominant business code for domestic R&D performance, where available. For companies that did not report business codes, the classification used for sampling was assigned. Estimates for 2020 do not include companies with fewer than 10 domestic employees.
Source(s):
National Center for Science and Engineering Statistics and Census Bureau, Business Enterprise Research and Development Survey, 2020.
Compensation of R&D Employees
R&D performing businesses located in the United States employed 22.0 million workers in 2020, of which 1.9 million were classified as R&D employees. As part of their expenditures for R&D, businesses spent $300 billion in compensation in the form of salaries, wages, and fringe benefits. Using these estimates, the average annual compensation of business R&D employees in 2020 was $155,000 in salaries, wages, and fringe benefits (figure 2). This figure grew 31% in current dollars between 2010 and 2020 (11% increase in constant dollars).
Compensation per domestic R&D employee: 2010, 2015, and 2020
| Year | Salaries, wages, and fringe benefits per domestic R&D employee | Stock-based compensation per domestic R&D employee | U.S. average private industry worker total compensation (BLS) |
|---|---|---|---|
| 2010 | 118,000 | 6,000 | 55,500 |
| 2015 | 132,000 | 13,000 | 63,140 |
| 2020 | 155,000 | 25,000 | 71,740 |
BLS = Bureau of Labor Statistics.
Note(s):
Statistics from the Business Enterprise Research and Development Survey are representative of companies located in the United States that performed R&D. Estimates for 2010 and 2015 do not include companies with fewer than 5 domestic employees. Estimates for 2020 do not include companies with fewer than 10 domestic employees. U.S. average annual compensation is derived from the BLS National Compensation Survey as the average hourly total private industry total compensation for all occupations multiplied by 2,000 hours. Dollars are rounded to the nearest 1,000.
Source(s):
National Center for Science and Engineering Statistics and Census Bureau, Business Enterprise Research and Development Survey; Bureau of Labor Statistics, National Compensation Survey.
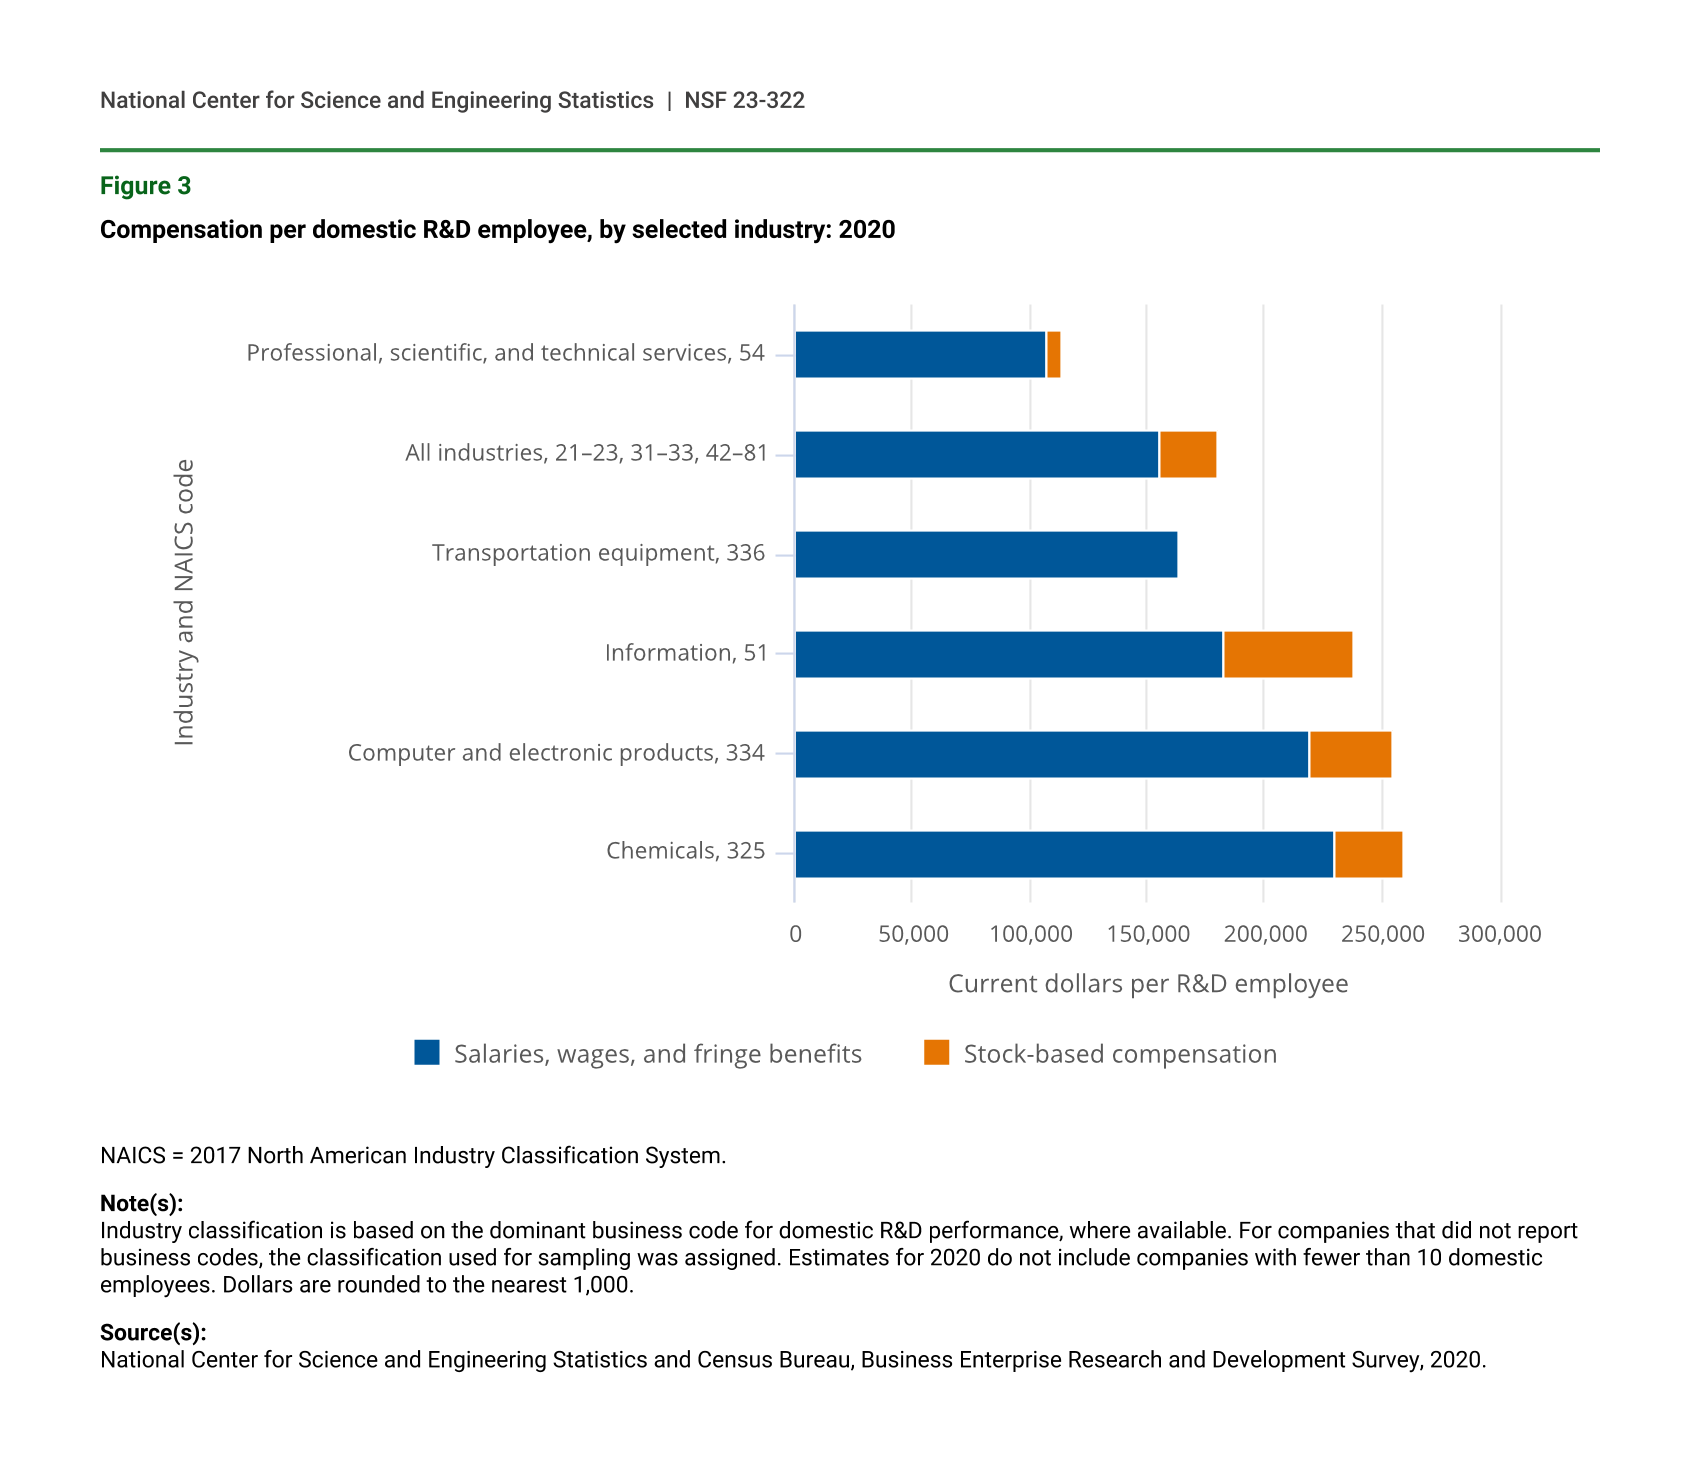
Large differences in compensation per R&D employee are evident across industries. In the chemicals manufacturing industry (which includes pharmaceuticals and medicines) the average salaries, wages, and fringe benefits per R&D employee was $230,000 in 2020, compared with $163,000 in the transportation equipment manufacturing industry (NAICS 336) and $107,000 in the professional, scientific, and technical services industry (NAICS 54) (which includes scientific research and development services) (figure 3). The average compensation per R&D employee in an industry may be associated with many factors, such as the R&D labor composition—for example, by occupation or R&D function (e.g., researchers or technicians)—and level of education. Figure 4 shows a scatter plot of salaries, wages, and fringe benefits per R&D employee and the share of researchers in R&D employment, illustrating that industries with higher shares of researchers (in contrast to other types of R&D employment) tend to have higher shares of compensation in the form of salaries, wages, and fringe benefits.
Compensation per domestic R&D employee, by selected industry: 2020
| Industry and NAICS code | Salaries, wages, and fringe benefits | Stock-based compensation |
|---|---|---|
| Professional, scientific, and technical services, 54 | 107,000 | 7,000 |
| All industries, 21–23, 31–33, 42–81 | 155,000 | 25,000 |
| Transportation equipment, 336 | 163,000 | 0 |
| Information, 51 | 183,000 | 55,000 |
| Computer and electronic products, 334 | 219,000 | 36,000 |
| Chemicals, 325 | 230,000 | 29,000 |
NAICS = 2017 North American Industry Classification System.
Note(s):
Industry classification is based on the dominant business code for domestic R&D performance, where available. For companies that did not report business codes, the classification used for sampling was assigned. Estimates for 2020 do not include companies with fewer than 10 domestic employees. Dollars are rounded to the nearest 1,000.
Source(s):
National Center for Science and Engineering Statistics and Census Bureau, Business Enterprise Research and Development Survey, 2020.
Salaries, wages, and fringe benefits per R&D employee vs. share of researchers per R&D employee: BERD 2020
BERD = Business Enterprise Research and Development.
Note(s):
Dots on the figure represent industry codes using 2017 North American Industry Classification System (NAICS). See source data table for full name of industries. Values for the aggregate of all industries is not shown: $155,000 per R&D employee and 68% researcher per R&D employee. Upward sloping line shows ordinary least squares fitted values with BERD 2020 survey data by industry.
Source(s):
National Center for Science and Engineering Statistics and Census Bureau, Business Enterprise Research and Development Survey.
Survey Information and Data Availability
A company is defined in BERD as a business organization located in the United States, either U.S. owned or a U.S. affiliate of a foreign parent company, of one or more establishments under common ownership or control.
BERD samples are selected to represent all for-profit, nonfarm companies that were publicly or privately held, had 10 or more employees in the United States, and performed or funded R&D either domestically or abroad. Industry classification of businesses in BERD was based on the dominant business activity for domestic R&D performance, where available. For reporting units that did not report business activity codes for R&D, the classification used for sampling was assigned.
Beginning in survey year 2018, companies that performed or funded less than $50,000 of R&D were excluded from tabulation. In prior years, companies that performed or funded any amount of R&D were tabulated. This change has affected the comparability of these estimates to those published in prior years.
Because the statistics from the survey are based on a sample, they are subject to both sampling and nonsampling errors. (See the “Technical Notes” section in the detailed statistical tables reports at https://www.nsf.gov/statistics/srvybrds/.)
Notes
1Change in constant dollars based on the Bureau of Economic Analysis’s gross domestic product (GDP) deflator (2012 = 100) in the National Income and Product Accounts (NIPA) table 1.1.9. Implicit Price Deflators for GDP. Accessed 2 August 2022 from https://apps.bea.gov/iTable/index_nipa.cfm.
2In addition to labor costs, expenditures for R&D performance include materials and supplies; depreciation and amortization on R&D property, plant, equipment, and intangible assets; royalties and licensing fees; expensed equipment (not capitalized); and non-R&D services.
3Federal Accounting Standards Board (FASB) reporting standard for companies to expense the fair value of stock options granted to employees came into effect in 2004.
4These industries together account for less than 1% of all business R&D performed in the United States.
5See table 4 in Wolfe R; National Center for Science and Engineering Statistics (NCSES). 2022. Businesses Spent Over a Half Trillion Dollars for R&D Performance in the United States During 2020, a 9.1% Increase Over 2019. NSF 22-343. Alexandria, VA: National Science Foundation. Available at http://ncses.nsf.gov/pubs/nsf22343. R&D employees include researchers, R&D managers, technicians, clerical staff, and others assigned to R&D groups.
6By way of comparison, the U.S. average private industry worker’s total compensation (wages and benefits) was $72,000 in 2020 based on data from Bureau of Labor Statistics (BLS) National Compensation Survey (https://beta.bls.gov/dataViewer/view/timeseries/CMU2010000000000D). This estimate was calculated by multiplying the average 2020 hourly compensation by 2,000 hours.
7For an examination of PhD researchers, see Moris F; National Center for Science and Engineering Statistics (NCSES). 2019. PhD Researchers in the Business Sector: Domestic and Foreign Employment and Industry-Level Characteristics of Domestic R&D. NSF 19-320. Alexandria, VA: National Science Foundation. Available at https://www.nsf.gov/statistics/2019/nsf19320/.
8A scatter plot illustrating positive association or co-movement between two variables does not imply causation. For example, changes in both variables may be caused by a third variable not shown in the figure.
Suggested Citation
Moris F and Shackelford B; National Center for Science and Engineering Statistics (NCSES). 2023. Labor Costs Account for Over Two-Thirds of U.S. Business R&D Performance in 2020. NSF 23-322. Alexandria, VA: National Science Foundation. Available at https://ncses.nsf.gov/pubs/nsf23322.
Contact Us
NCSES
National Center for Science and Engineering Statistics
Directorate for Social, Behavioral and Economic Sciences
National Science Foundation
2415 Eisenhower Avenue, Suite W14200
Alexandria, VA 22314
Tel: (703) 292-8780
FIRS: (800) 877-8339
TDD: (800) 281-8749
E-mail: ncsesweb@nsf.gov
NSF 23-322
|February 21, 2023