 An official website of the United States government

Research Funding for U.S. Doctorate Recipients at Research-Intensive Institutions
New research data created by linking administrative records to a subset of the Survey of Earned Doctorates (SED) suggest that 51% of science and engineering (S&E) doctorate recipients who graduated from U.S. research-intensive institutions between academic years (AYs) 2014 and 2017 received research funding during their graduate studies. Among those S&E doctorate recipients that linked to the limited number of institutions in the administrative records, 42% received research funding solely from federal funders. On average, this group of funded doctorate recipients received funding from 3.7 research grants with a funding duration of 36 months from a mean of 60 months of observable grant data. The median research team size was 6 for this group of funded S&E doctorate recipients. The linked data only include those doctorate recipients that attended 1 of the 21 institutions in the administrative data. Results may not be applicable to all doctorate recipients.
This InfoBrief introduces a new resource, the SED-UMETRICS linked data, for analyzing research funding dynamics among doctorate recipients at research-intensive institutions. Member universities of the Institute for Research on Innovation and Science (IRIS) submit administrative records drawn directly from data systems on university-sponsored projects, procurement, and human resources that track direct cost expenditures on research grants, and IRIS compiles this information to construct the Universities: Measuring the Impacts of Research on Innovation, Competitiveness, and Science (UMETRICS) data. The SED, an annual census of research doctorate recipients conducted by the National Center for Science and Engineering Statistics (NCSES) within the National Science Foundation (NSF) collects information on educational history, demographic characteristics, and postgraduation plans. The SED was linked to UMETRICS data from 21 member universities (Garner et al.). The set of SED-UMETRICS linked data used for this InfoBrief includes almost 41,000 doctorate graduates who received their degree in AYs 2014–17 from these universities. Using this linked data, it is possible to gain additional insight on rates of funding, source of funding (federal vs. nonfederal), funding duration, team size on grants, and funding agency.
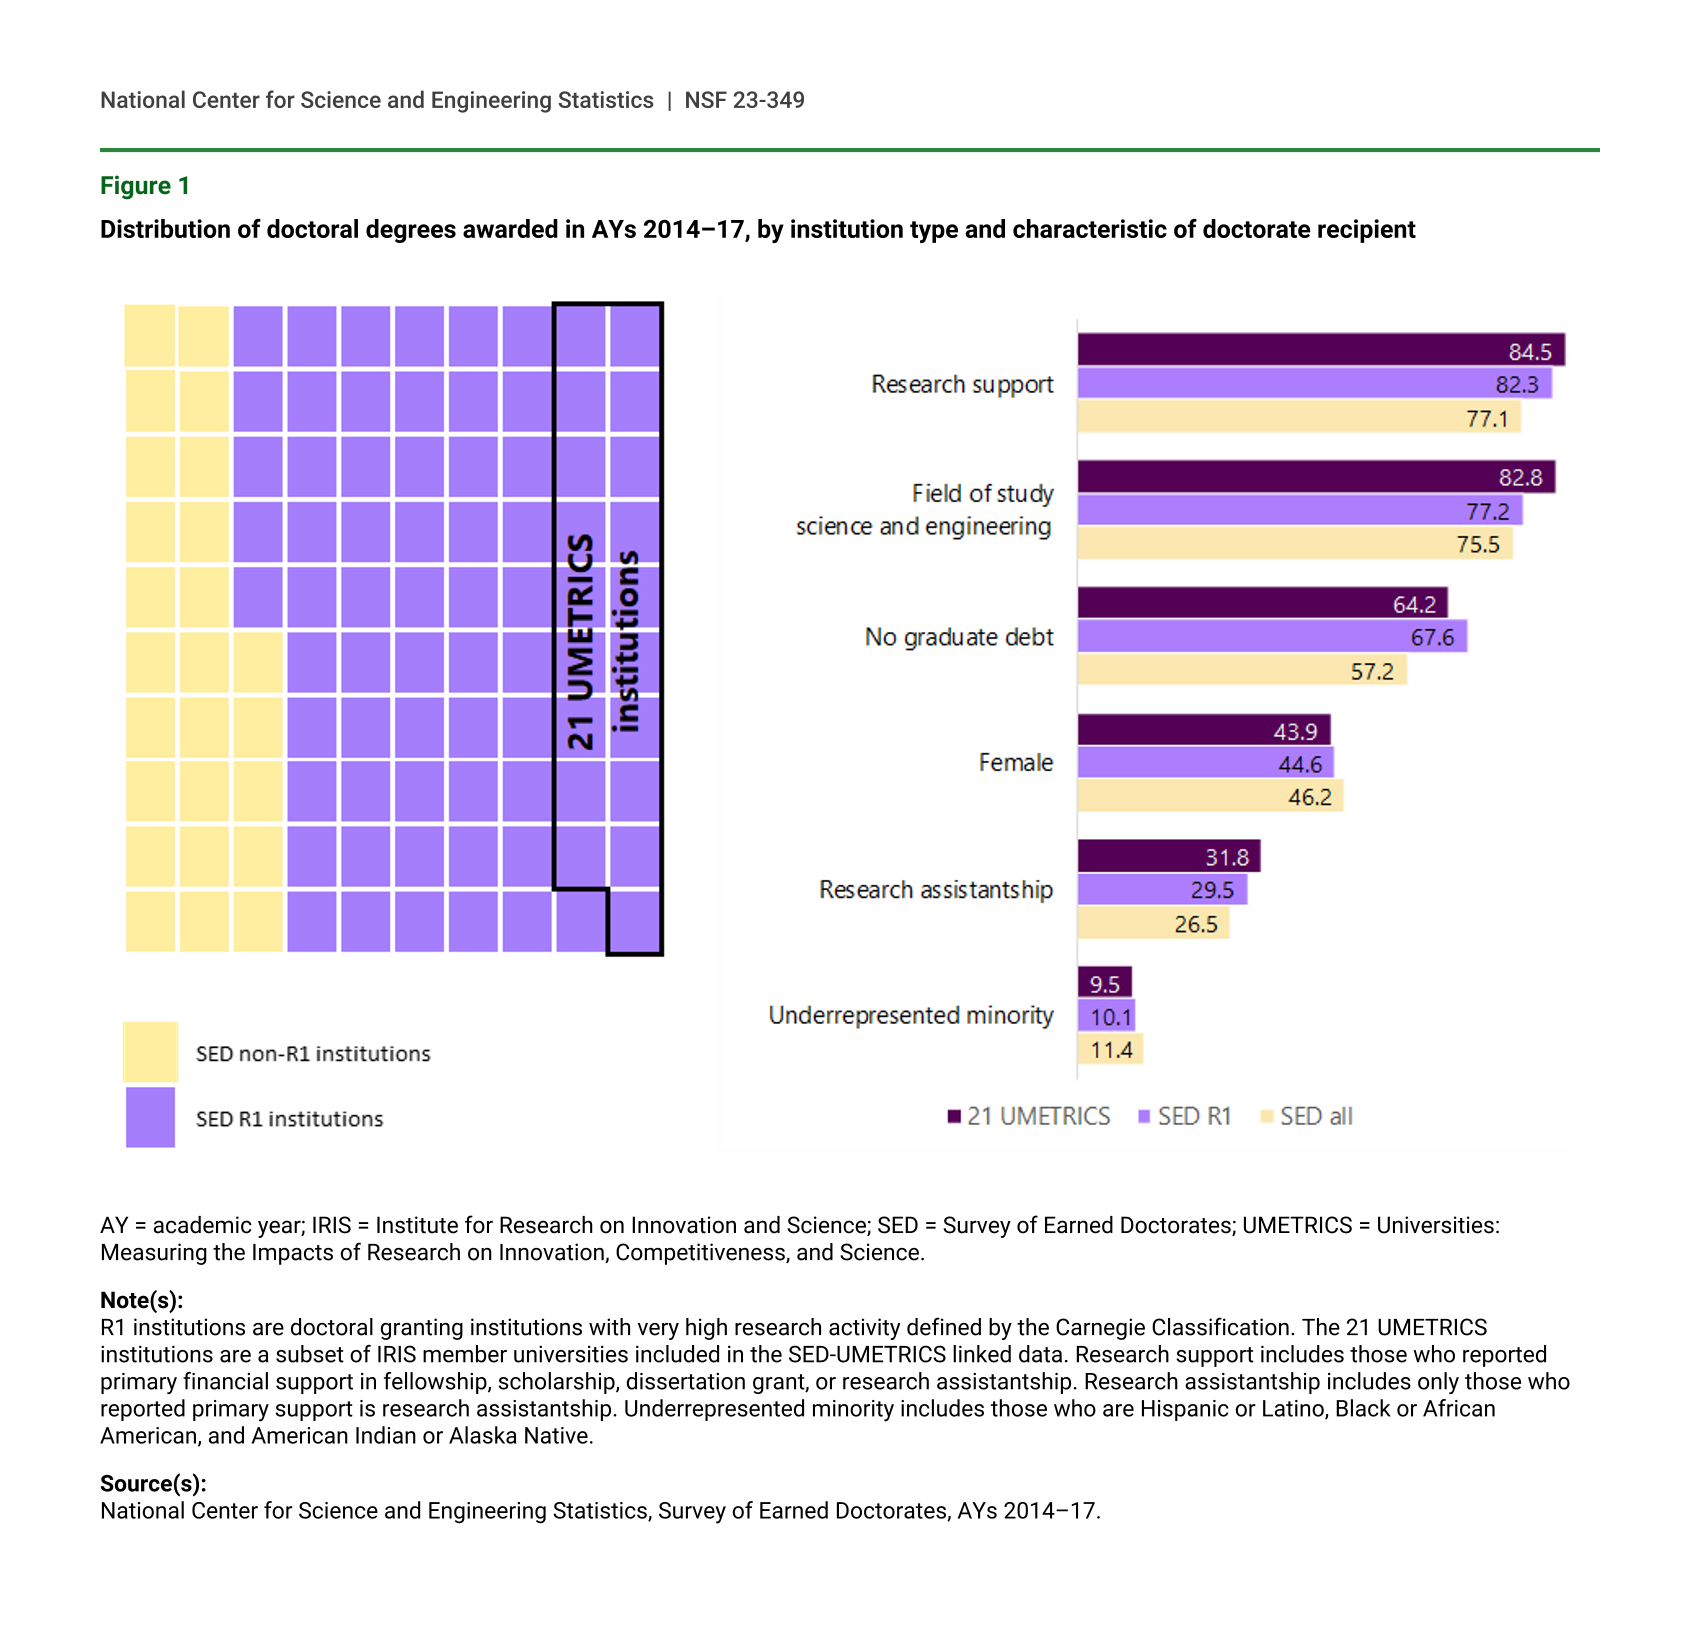
About 75% of U.S research doctorates awarded in AYs 2014–17 were from universities with very high research activities (R1 institutions). All institutions in the SED-UMETRICS linked data are classified as “R1,” and together they account for 25% of doctorate recipients from R1 institutions (figure 1). Moreover, the demographic composition of doctorate recipients was similar in this large SED-UMETRICS sample and in the cohort from all SED R1 institutions, although the SED-UMETRICS sample had slightly lower rates of graduate debt, female graduates, and minority graduates and slightly higher rates of reporting research support as the primary financial support. Consequently, estimates of the research funding characteristics derived from the SED-UMETRICS linked data may offer some insights into the overall characteristics of doctorate recipients from R1 institutions.
Distribution of doctoral degrees awarded in AYs 2014–17, by institution type and characteristic of doctorate recipient
AY = academic year; IRIS = Institute for Research on Innovation and Science; SED = Survey of Earned Doctorates; UMETRICS = Universities: Measuring the Impacts of Research on Innovation, Competitiveness, and Science.
Note(s):
R1 institutions are doctoral granting institutions with very high research activity defined by the Carnegie Classification. The 21 UMETRICS institutions are a subset of IRIS member universities included in the SED-UMETRICS linked data. Research support includes those who reported primary financial support in fellowship, scholarship, dissertation grant, or research assistantship. Research assistantship includes only those who reported primary support is research assistantship. Underrepresented minority includes those who are Hispanic or Latino, Black or African American, and American Indian or Alaska Native.
Source(s):
National Center for Science and Engineering Statistics, Survey of Earned Doctorates, AYs 2014–17.
Prevalence of Research Funding of Doctorate Recipients
All individuals who were linked between UMETRICS and SED represent doctorate recipients who worked on research grants while pursuing their doctoral degree at R1 institutions. Thus the proportion of individuals who were linked can be used to provide insight into the research funding rates at R1 institutions (Chang et al. 2019).
Research funding rates were estimated for single year cohorts and for the combined AYs 2014–17 cohort. Overall, 36% of doctorate recipients in the AYs 2014–17 cohort received research funding, and funding rates varied across the doctorate fields of study (table 1). Funding rates were higher among those in S&E fields than among those in non-S&E fields. The highest funding rates in the S&E fields were among those in physical science and earth sciences (range of 42%–63% between AYs 2014 and 2017), followed by mathematics and computer sciences (35%–53%), life sciences (37%–46%), and engineering (37%–50%).
The university coverage for UMETRICS is uneven but has improved over time. Underestimation of funding rates due to fewer years of available data is expected for earlier years. A more robust estimate based on individuals for whom full coverage is available for their institution (full institutional coverage) reveals a higher funding rate of 44%, compared with the full-sample funding rate of 36% (table 1) for AYs 2014–17. Because the linkage rate is an approximation for the rates of research funding receipt, this is the most appropriate group to consider when analyzing patterns of research funding. Thus, all subsequent statistics reported will be on individuals from the group with full institutional coverage.
Doctorate recipients matched to UMETRICS research funding data: AYs 2014–17
AY = academic year; S&E = science and engineering; SED = Survey of Earned Doctorates; UMETRICS = Universities: Measuring the Impacts of Research on Innovation, Competitiveness, and Science.
Note(s):
Proportion of SED graduates matched to UMETRICS research funding data is calculated for each academic year cohort and for the AYs 2014–17 combined cohort. The matched proportion was also calculated using a subset of doctorate graduates having UMETRICS data from their institutions for a full 3 years prior to their graduation date (full institutional coverage).
Source(s):
SED-UMETRICS linked data, AYs 2014–17.
Research Funding Disparities
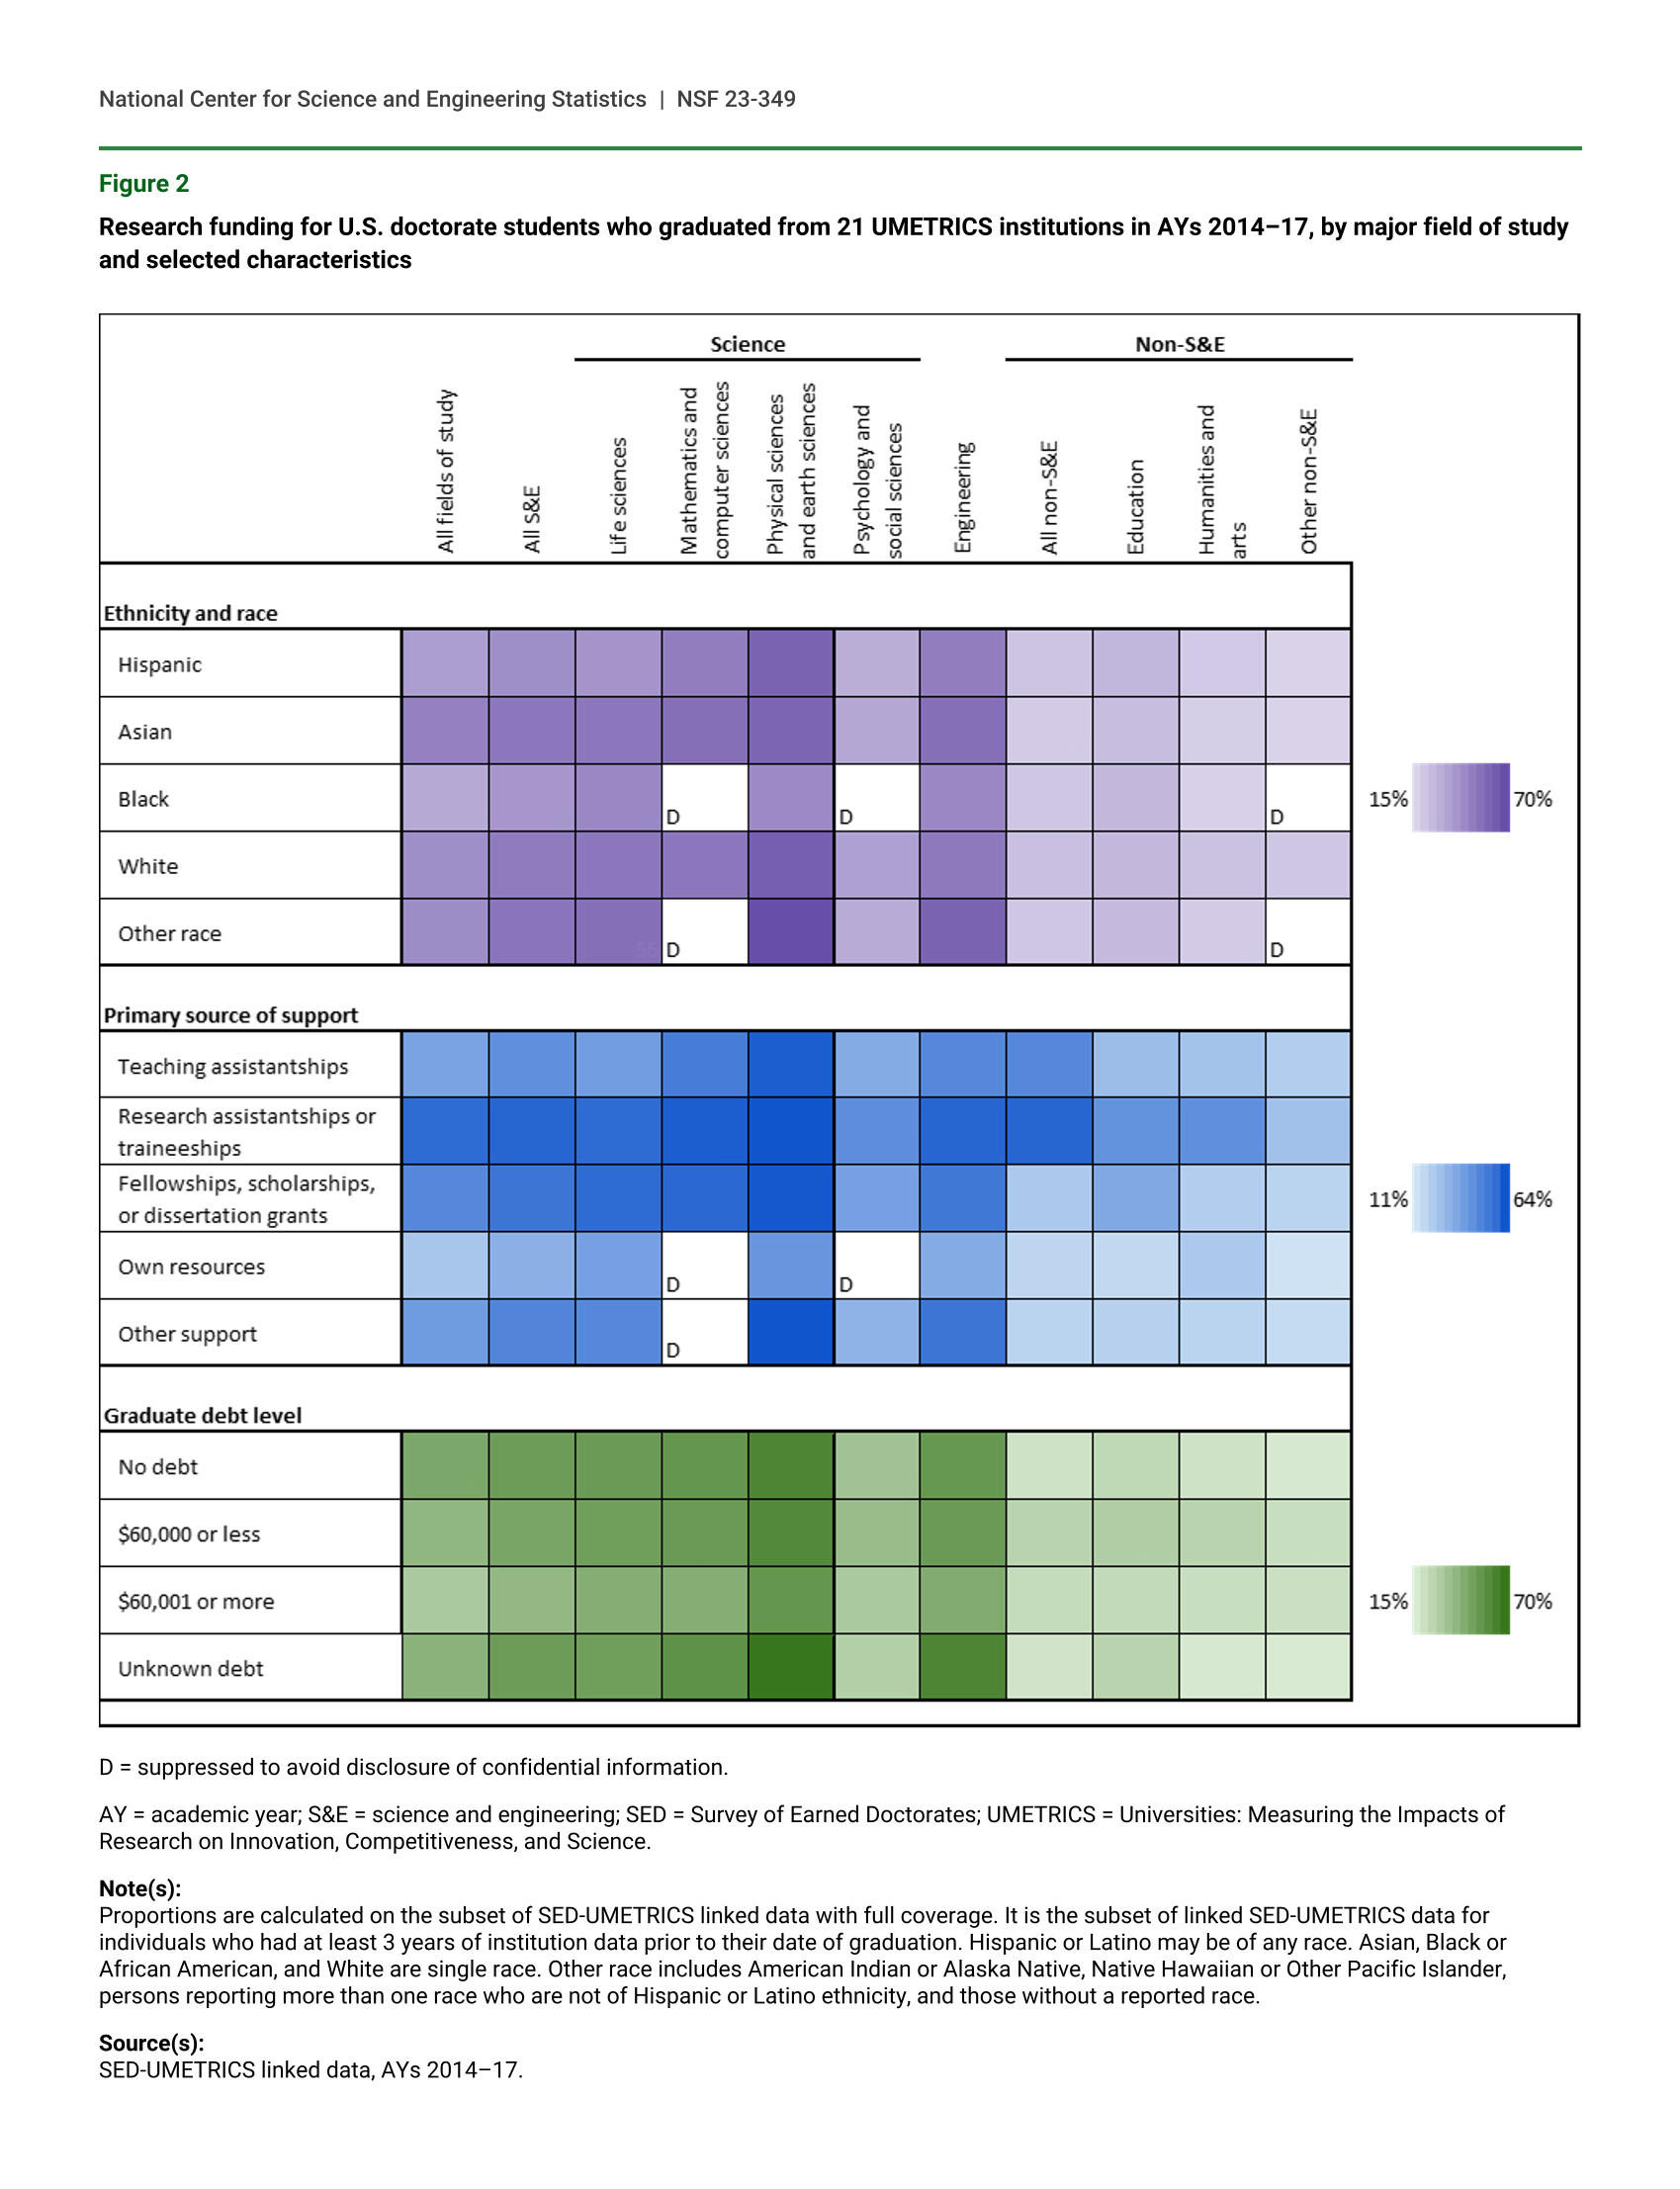
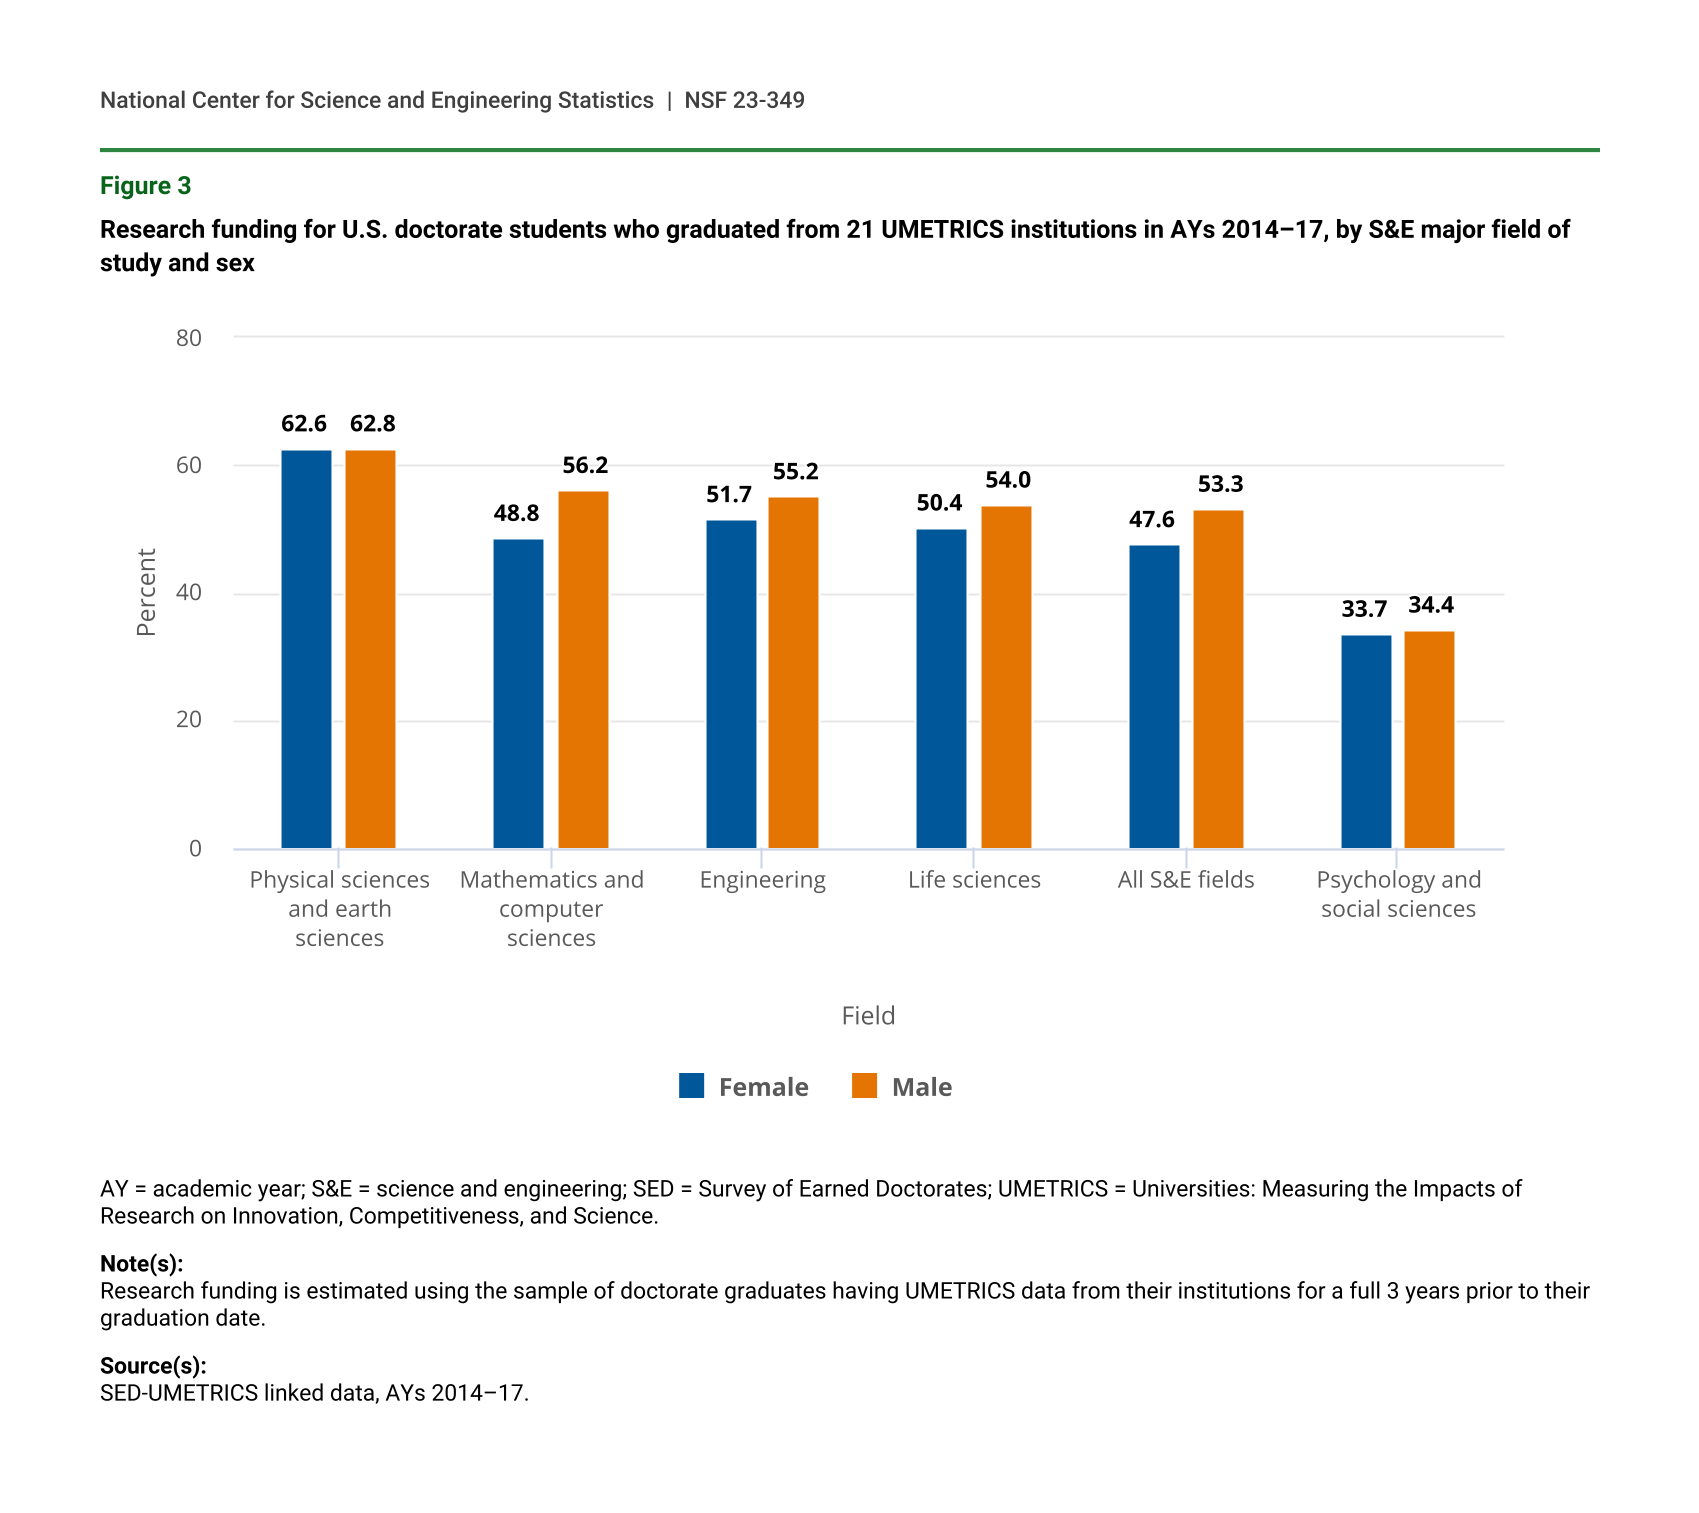
Uneven research funding rates are observed by field of study, various demographic characteristics, level of graduate debt, and source of graduate financial support (figure 2). In general, funding rates are higher among those in S&E fields than among those in non-S&E fields (51% vs. 21%) for the AYs 2014–17 cohort of doctorate recipients. Overall, men have higher rates of funding than women (48% vs. 40%). Some of the difference in funding rates may be due to the lower proportion of women pursuing fields of study that are better funded (69% of women in the sample earned an S&E doctoral degree, whereas 83% of men in the sample did so). Funding differences by sex were also seen when looking at funding rates within S&E subfields (figure 3).
There were also differences by racial or ethnic groups in the overall funding rates, where funding rates for Asian (49%) and White (43%) doctorate recipients exceed those of Hispanic or Latino (37%) and Black or African American (32%) doctorate recipients (figure 2). As with the sex differences, the lower funding rate for Black or African American doctorate recipients was associated with the distribution of fields of study they pursued (87% of Asians earned their doctoral degree in S&E, but 61% of Blacks or African Americans did so). Racial or ethnic differences persist when looking at funding rates within the broad fields of study. Asian and White doctorate recipients have higher funding rates than Black or African American and Hispanic or Latino doctorate recipients in engineering and in life sciences, which contribute to Asians and Whites having the highest rates of funding in all S&E (figure 2).
Research funding for U.S. doctorate students who graduated from 21 UMETRICS institutions in AYs 2014–17, by major field of study and selected characteristics
D = suppressed to avoid disclosure of confidential information.
AY = academic year; S&E = science and engineering; SED = Survey of Earned Doctorates; UMETRICS = Universities: Measuring the Impacts of Research on Innovation, Competitiveness, and Science.
Note(s):
Proportions are calculated on the subset of SED-UMETRICS linked data with full coverage. It is the subset of linked SED-UMETRICS data for individuals who had at least 3 years of institution data prior to their date of graduation. Hispanic or Latino may be of any race. Asian, Black or African American, and White are single race. Other race includes American Indian or Alaska Native, Native Hawaiian or Other Pacific Islander, persons reporting more than one race who are not of Hispanic or Latino ethnicity, and those without a reported race.
Source(s):
SED-UMETRICS linked data, AYs 2014–17.
By primary source of financial support reported in the SED, funding rates were highest among those with research assistantships as the primary source of financial support, with a funding rate of 58% for S&E fields. However, the funding rates were still significantly below 100%, indicating that many doctorate students received a research assistantship or traineeship that was not directly funded by a research grant. For those who reported having more than $60,000 in graduate debt, the funding rate was 39% for S&E doctorate recipients; generally, this debt group had the lowest funding rate for each of the S&E subfields.
Research funding for U.S. doctorate students who graduated from 21 UMETRICS institutions in AYs 2014–17, by S&E major field of study and sex
| Field | Female | Male |
|---|---|---|
| Physical sciences and earth sciences | 62.6 | 62.8 |
| Mathematics and computer sciences | 48.8 | 56.2 |
| Engineering | 51.7 | 55.2 |
| Life sciences | 50.4 | 54.0 |
| All S&E fields | 47.6 | 53.3 |
| Psychology and social sciences | 33.7 | 34.4 |
AY = academic year; S&E = science and engineering; SED = Survey of Earned Doctorates; UMETRICS = Universities: Measuring the Impacts of Research on Innovation, Competitiveness, and Science.
Note(s):
Research funding is estimated using the sample of doctorate graduates having UMETRICS data from their institutions for a full 3 years prior to their graduation date.
Source(s):
SED-UMETRICS linked data, AYs 2014–17.
Source of Research Funding of Doctorate Recipients
The linked SED-UMETRICS data not only allows researchers to estimate research funding rates, but the linked data also offer insights into the type of research grants by which doctorate students are funded and the source funding agencies.
A great majority (84%) of funded doctorate recipients received funding from federal sources either solely (41%) or alongside nonfederal sources (43%), and a small proportion of funded individuals received only nonfederal funding (16%) (table 2). Among S&E doctorate recipients, mathematics and computer sciences funded graduates were most likely to receive federal-only funding (54%). Among all doctorate recipients, Black or African American students had the highest rate of receiving only federal funding (50%) relative to other racial or ethnic groups (39%–42%). Funding source distribution may also vary with the graduate debt levels reported: among doctorate recipients receiving research funding, a higher proportion of those without debt or having less than $60,000 in graduate debt received funding from both federal and nonfederal sources (44% and 40%, respectively).
Research funding characteristics of U.S. doctorate students who graduated from 21 UMETRICS institutions in AYs 2014–17, by funding source and federal funding agency
D = suppressed to avoid disclosure of confidential information.
AY = academic year; DOD = Department of Defense; DOE = Department of Energy; ED = Department of Education; HHS = Department of Health and Human Services; NASA = National Aeronautics and Space Administration; NIH = National Institutes of Health; NSF = National Science Foundation; S&E = science and engineering; SED = Survey of Earned Doctorates; UMETRICS = Universities: Measuring the Impacts of Research on Innovation, Competitiveness, and Science.
a Hispanic or Latino may be of any race.
b Asian, Black or African American, and White are single race.
c Other race includes American Indian or Alaska Native, Native Hawaiian or Other Pacific Islander, and persons reporting more than one race who are not of Hispanic or Latino ethnicity, and it includes those without a reported race.
Note(s):
Proportions are calculated using the subset of SED-UMETRICS linked data with full coverage. It is the subset of linked SED-UMETRICS data for individuals who had at least 3 years of institution data prior to their date of graduation.
Source(s):
SED-UMETRICS linked data, AYs 2014–17.
Delving into the federal sources of funding, NSF funded the most doctorate recipients, funding 41% of those with research funding in S&E fields and the majority of doctorate recipients with research funding in mathematics and computer sciences (78%) and physical sciences and earth sciences (56%). The National Institutes of Health was the second most prominent funder of S&E doctorate recipients (37%), followed by the Department of Defense and the Department of Energy (12% each).
Funding Experience of Doctorate Recipients
Among those who were funded, table 3 provides information characterizing funding experience through the average number of months funded, the average number of months federally funded, the average number of unique grants worked on, and the median team size. In all fields, the average number of months funded was almost 35, with most of the months (30.8) being funded by federal sources. The average number of grants was about 3.6 grants per person, and the median team size was 6, but both measures vary by subgroup.
Research funding of U.S. doctorate students who graduated from 21 UMETRICS institutions in AYs 2014–17, by average funding duration, average number of grants, and median team size
AY = academic year; S&E = science and engineering; SED = Survey of Earned Doctorates; UMETRICS = Universities: Measuring the Impacts of Research on Innovation, Competitiveness, and Science.
a Hispanic or Latino may be of any race.
b Asian, Black or African American, and White are single race.
c Other race includes American Indian or Alaska Native, Native Hawaiian or Other Pacific Islander, and persons reporting more than one race who are not of Hispanic or Latino ethnicity, and it includes those without a reported race.
Note(s):
Funding characteristics are summarized as average numbers or medians and are calculated based on the subset of SED-UMETRICS linked data with full coverage. It is the subset of linked SED-UMETRICS data for individuals who had at least 3 years of institution data prior to their date of graduation.
Source(s):
SED-UMETRICS linked data, AYs 2014–17.
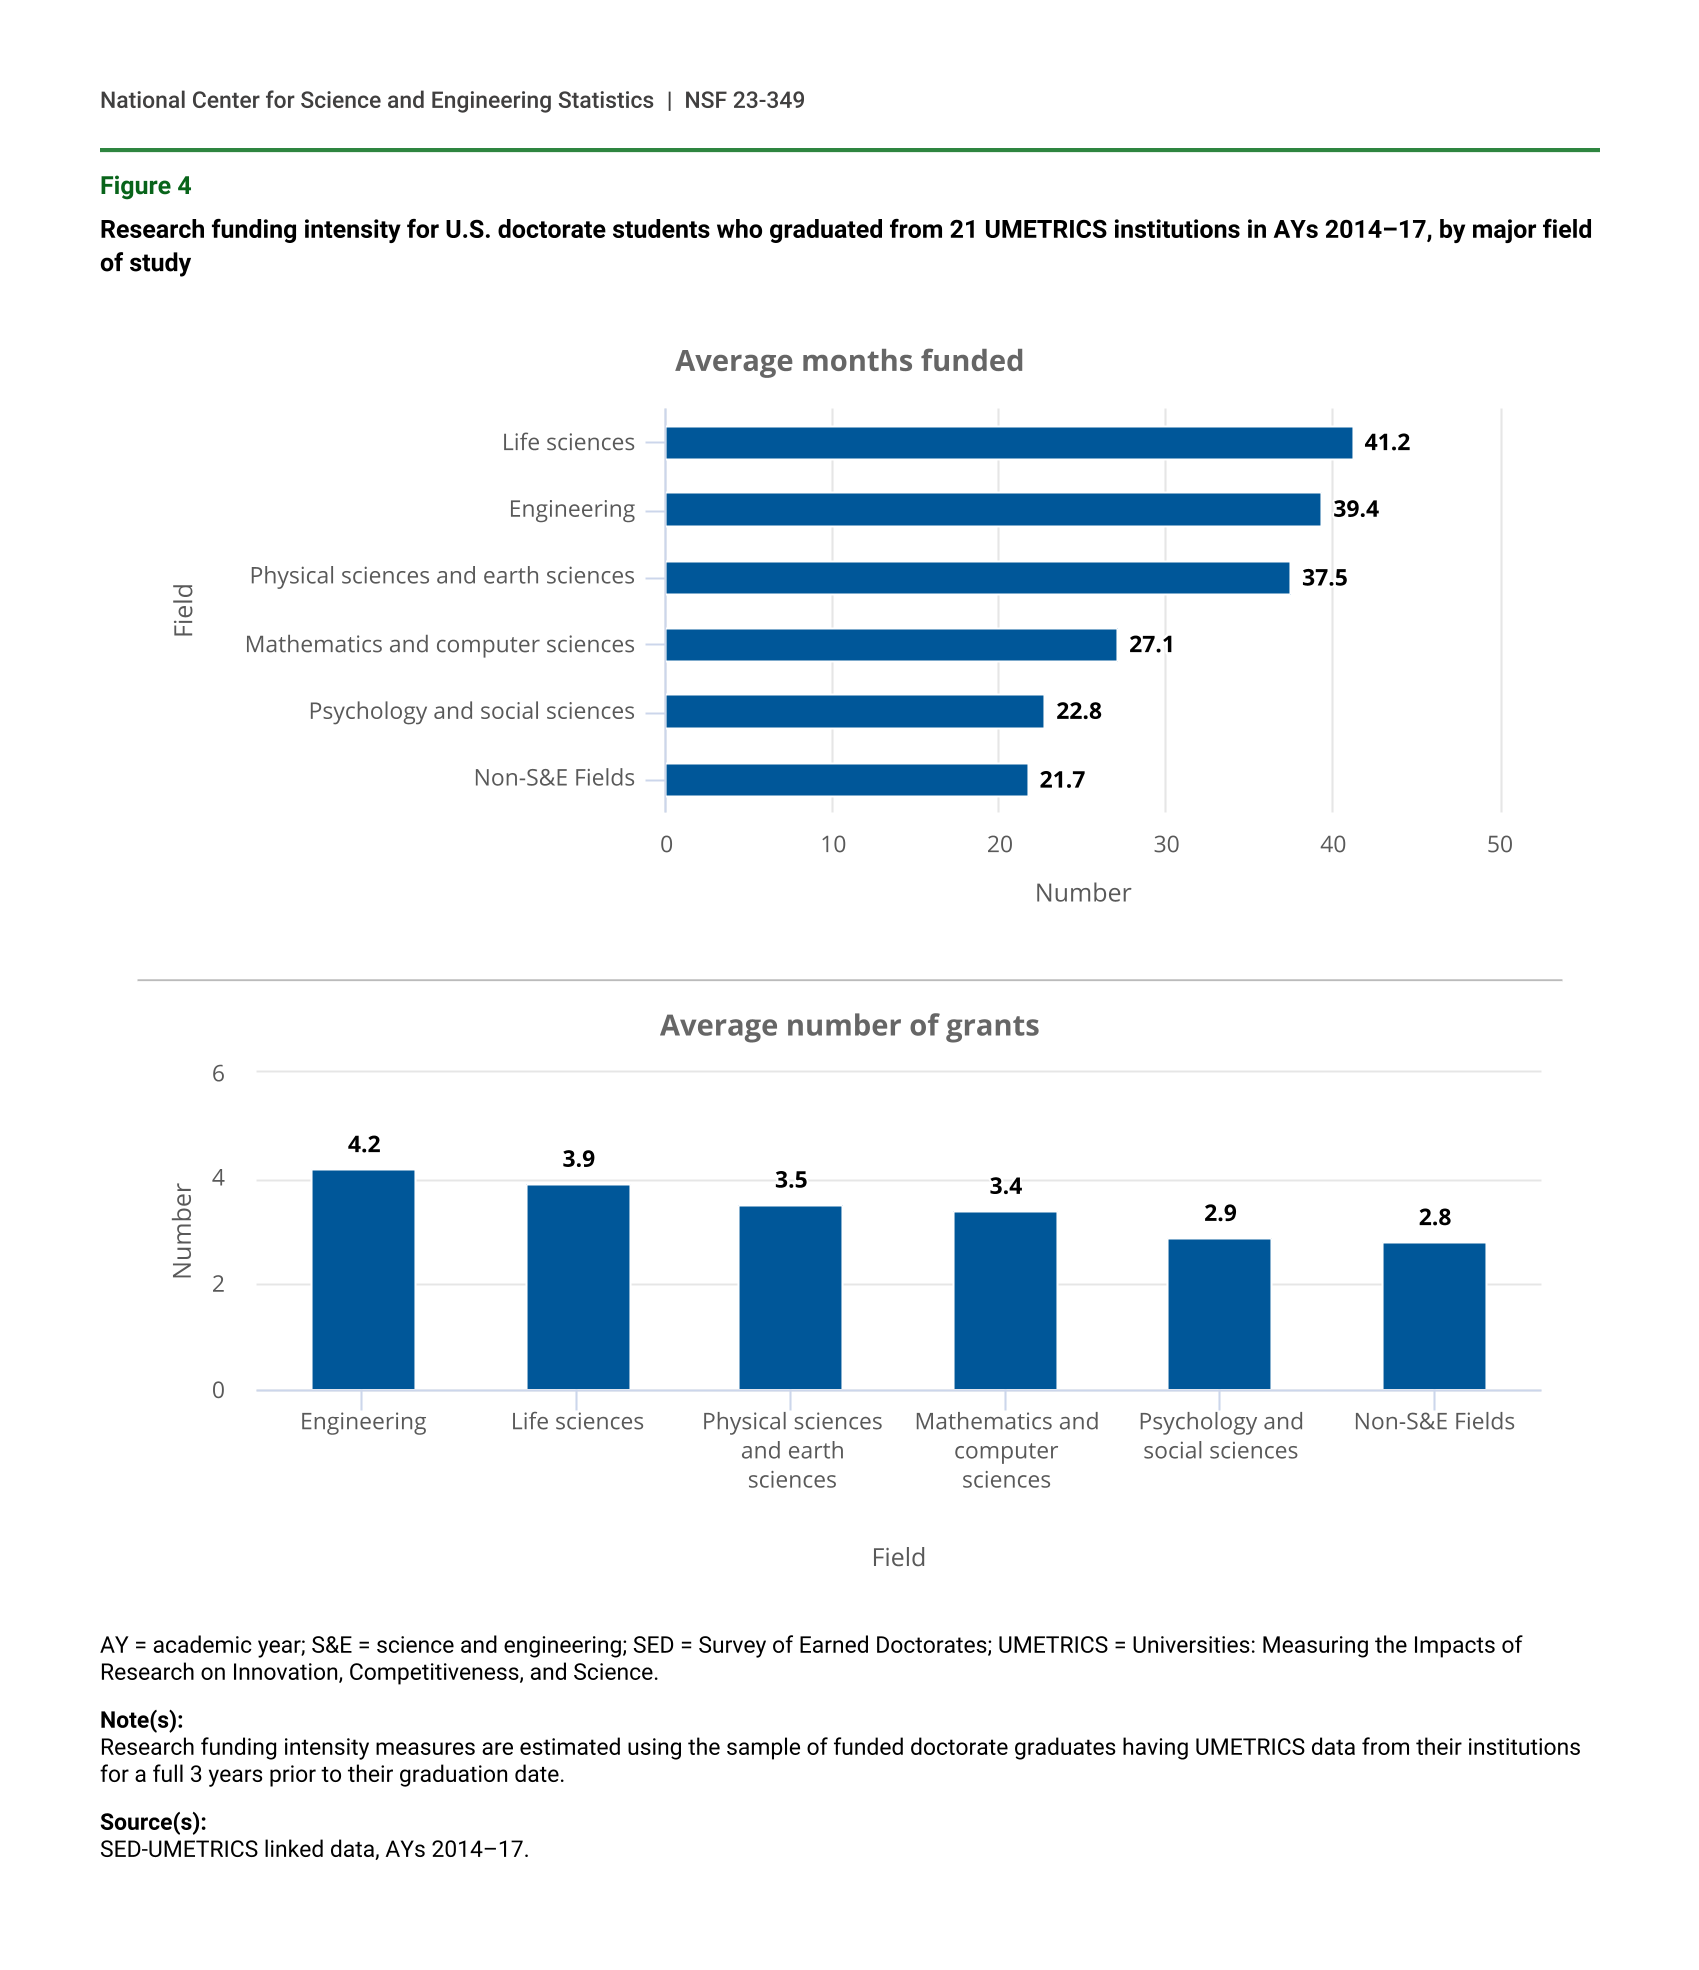
S&E fields generally were funded for longer periods and by more grants, compared with non-S&E fields (figure 4). In S&E fields, the longest average number of months funded was 41.2 in life sciences, whereas engineering was associated with the largest average number of grants per person (4.2). Psychology and social sciences were associated with both the shortest duration of funding (22.8 months) and the smallest average number of grants (2.9).
Research funding intensity for U.S. doctorate students who graduated from 21 UMETRICS institutions in AYs 2014–17, by major field of study
| Field | Average months funded |
|---|---|
| Life sciences | 41.2 |
| Engineering | 39.4 |
| Physical sciences and earth sciences | 37.5 |
| Mathematics and computer sciences | 27.1 |
| Psychology and social sciences | 22.8 |
| Non-S&E Fields | 21.7 |
| Field | Average number of grants |
|---|---|
| Engineering | 4.2 |
| Life sciences | 3.9 |
| Physical sciences and earth sciences | 3.5 |
| Mathematics and computer sciences | 3.4 |
| Psychology and social sciences | 2.9 |
| Non-S&E Fields | 2.8 |
AY = academic year; S&E = science and engineering; SED = Survey of Earned Doctorates; UMETRICS = Universities: Measuring the Impacts of Research on Innovation, Competitiveness, and Science.
Note(s):
Research funding intensity measures are estimated using the sample of funded doctorate graduates having UMETRICS data from their institutions for a full 3 years prior to their graduation date.
Source(s):
SED-UMETRICS linked data, AYs 2014–17.
Among those who received research funding, Black or African American doctorate recipients had the shortest duration of funding (29.1 months on average), worked on the smallest number of grants (2.9 grants on average), and worked with the largest team sizes (8-person teams on average), relative to their Asian, Hispanic or Latino, and White counterparts (table 3).
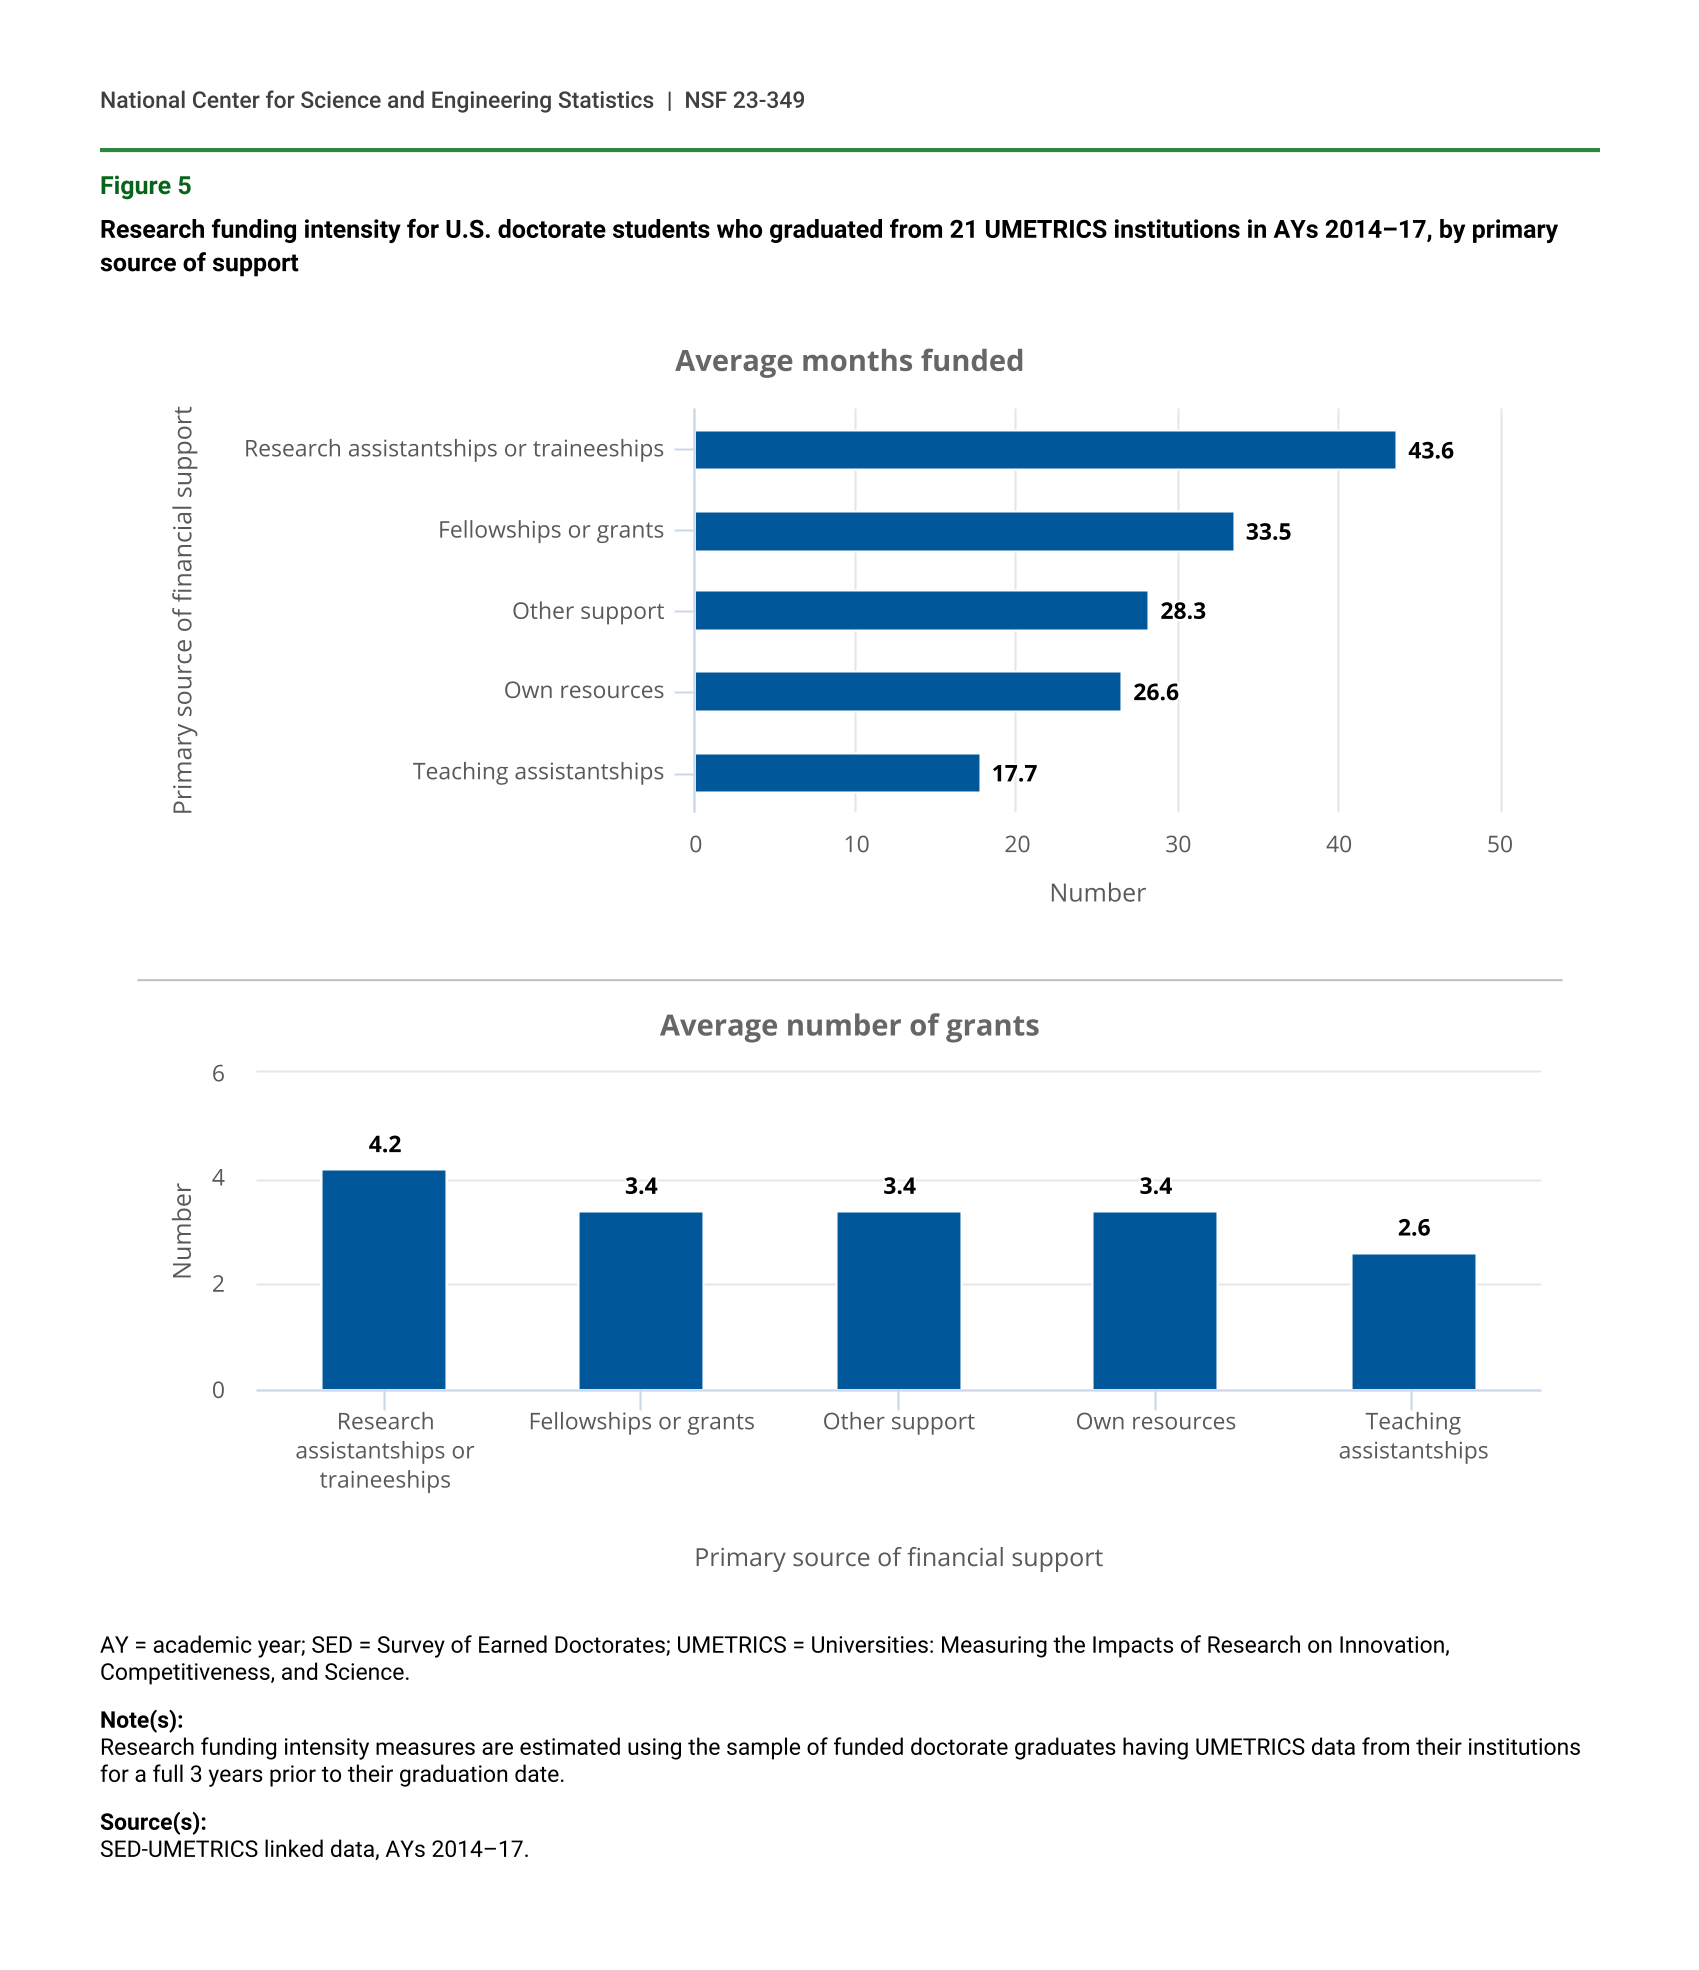
Having a research assistantship or traineeship as a primary source of support was associated with the longest research funding duration (43.6 months) and the most grants on average (4.2). Teaching assistantships were associated with the shortest duration of funding receipt (17.7 months) and the smallest number of grants on average (2.6). A lower level of funding intensity was also observed for doctorate recipients who reported having “own resources” as the primary source of support, with 26.6 months of funding receipt and 3.4 grants on average (table 3 and figure 5).
The number of individuals on the same grant (i.e., team size) as the doctorate student may also provide information about network size throughout the graduate career. Team size was generally smaller for S&E doctorate recipients than for their non-S&E counterparts.
Research funding intensity for U.S. doctorate students who graduated from 21 UMETRICS institutions in AYs 2014–17, by primary source of support
| Primary source of financial support | Average months funded |
|---|---|
| Research assistantships or traineeships | 43.6 |
| Fellowships or grants | 33.5 |
| Other support | 28.3 |
| Own resources | 26.6 |
| Teaching assistantships | 17.7 |
| Primary source of financial support | Average number of grants |
|---|---|
| Research assistantships or traineeships | 4.2 |
| Fellowships or grants | 3.4 |
| Other support | 3.4 |
| Own resources | 3.4 |
| Teaching assistantships | 2.6 |
AY = academic year; SED = Survey of Earned Doctorates; UMETRICS = Universities: Measuring the Impacts of Research on Innovation, Competitiveness, and Science.
Note(s):
Research funding intensity measures are estimated using the sample of funded doctorate graduates having UMETRICS data from their institutions for a full 3 years prior to their graduation date.
Source(s):
SED-UMETRICS linked data, AYs 2014–17.
Data sources, Limitations, and Availability
Two datasets underlie the analysis: the SED and UMETRICS. These data were linked at the individual level using first and last name, university identification, and date of birth. The linkage was conducted in joint effort by IRIS, NCSES, and the Coleridge Initiative. For more detailed information on UMETRICS linked to the SED, please see the SED-UMETRICS Linkage Technical Report at http://ncses/nsf.gov/pubs/ncses23215/. Estimates in this InfoBrief were computed by summing linked data without applying any further statistical adjustments. Doctorate-awarding institutions that are not R1 institutions are not represented by the SED-UMETRICS linked data.
SED
The SED is an annual census conducted since 1957 of all individuals receiving a research doctorate from an accredited U.S. institution in a given academic year, https://www.nsf.gov/statistics/srvydoctorates/. The SED cohort for AYs 2014–17 consists of more than 218,000 doctorate recipients, and the R1 institutions awarded 75% of the doctorates. A large sample of 40,982 graduates from 21 IRIS member universities, which are all R1 institutions, are included in the SED-UMETRICS linkage.
UMETRICS
UMETRICS data is submitted to IRIS by member universities and consists of transactional records providing information on individuals paid on research grants at IRIS institutions. UMETRICS data are available at the level of monthly transactions for nearly 450,000 federal and nonfederal sponsored project grants and includes more than 720,000 faculty, staff, students, and postdoctoral trainees employed on those grants. Currently data are available for 75 campuses at 33 universities, representing almost 50% of U.S. research funding; the time coverage varies across universities and ranges from 3 months to 18 years.
SED-UMETRICS linked data
For the period considered, AYs 2014–17, doctorate recipients from 21 institutions made up the sample of UMETRICS individuals that were linked to SED. After reporting initial funding statistics, the sample was narrowed to include only graduates for whom their institution provided data to UMETRICS the entire 3 years before graduation as visualized with the shaded cells in table 4. This table shows the number of consecutive years of available data from each institution, with institution 1 having 6 years of data available through the end of AY 2014 and institution 2 having only 1 year of data throughout the same year. Additionally, as indicated by the cells with NA, two institutions stopped providing data in 2017. This narrowed the number of linked SED graduates from almost 15,000 to just over 10,000. Even when considering this narrower sample, it is important to note there was still variation in coverage. The linked SED-UMETRICS data did not capture the entire graduate experience for 35% of doctorate recipients in this sample due to work done on grants prior to the date at which their institution began submitting data to UMETRICS. This could lead to this study underestimating both the rates of researcher funding and the duration of research funding.
Years of UMETRICS data available from each institution with respect to an end year: AYs 2014–17
NA = not available.
AY = academic year; UMETRICS = Universities: Measuring the Impacts of Research on Innovation, Competitiveness, and Science.
Note(s):
The shaded cells denote that at least 3 years of research funding data is available with respect to an end year.
Source(s):
UMETRICS data, 2020 release.
Notes
1Twenty-one of the 24 IRIS UMETRICS universities were selected to be linked to the SED for AYs 2014–17 because these 21 universities had personal identifiable information available for the linkage process and because they provided at least 3 years of data between academic years 2014 and 2017.
2Academic year (AY) refers to enrollment in fall of that year. For example, AY 2014 refers to enrollment in fall 2014.
3Classification of R1 institutions is defined using the 2018 Basic Carnegie Classification code value 15. R1 institutions are doctorate granting institutions with very high research activity.
4Here, the match rate represents the estimated proportion of doctorate recipients from the 21 UMETRICS institutions in AYs 2014–17 who were found to be working on at least one research grant while earning their doctoral degree. In this InfoBrief, it is assumed that the UMETRICS data have complete coverage of doctorate recipients and research grants from participating institutions.
5The full coverage is defined as having UMETRICS data from the doctorate recipients’ institutions for a full 3 years prior to the graduation date.
6Team size was calculated at the individual-grant level and represents the number of people each individual worked with at the same time on a given grant. When calculating the median team size for a subgroup, each individual-grant pair within a subgroup was used in the calculation of the median.
References
Garner M, Levitskaya E, Own-Smith J, Lane J, Chang W-Y. SED-UMETRICS Linkage Technical Report. NCSES 23-215. Alexandria, VA: National Science Foundation. Available at http://ncses/nsf.gov/pubs/ncses23215/.
Chang W-Y, Cheng W, Lane J, Weinberg B. 2019. Federal Funding of Doctoral Recipients: What Can Be Learned from Linked Data. Research Policy 48(6): 1487–92. Available at https://doi.org/10.1016/j.respol.2019.03.001.
Suggested Citation
Garner M, Nunez A, Chang W-Y; National Center for Science and Engineering Statistics (NCSES). 2023. Research Funding for U.S. Doctorate Recipients at Research-Intensive Institutions. NSF 23-349. Alexandria, VA: National Science Foundation. Available at https://ncses.nsf.gov/pubs/nsf23349/.
Contact Us
NCSES
National Center for Science and Engineering Statistics
Directorate for Social, Behavioral and Economic Sciences
National Science Foundation
2415 Eisenhower Avenue, Suite W14200
Alexandria, VA 22314
Tel: (703) 292-8780
FIRS: (800) 877-8339
TDD: (800) 281-8749
E-mail: ncsesweb@nsf.gov
NSF 23-349
|December 4, 2023