 An official website of the United States government

U.S. R&D Totaled $892 Billion in 2022; Estimate for 2023 Indicates Further Increase to $940 Billion
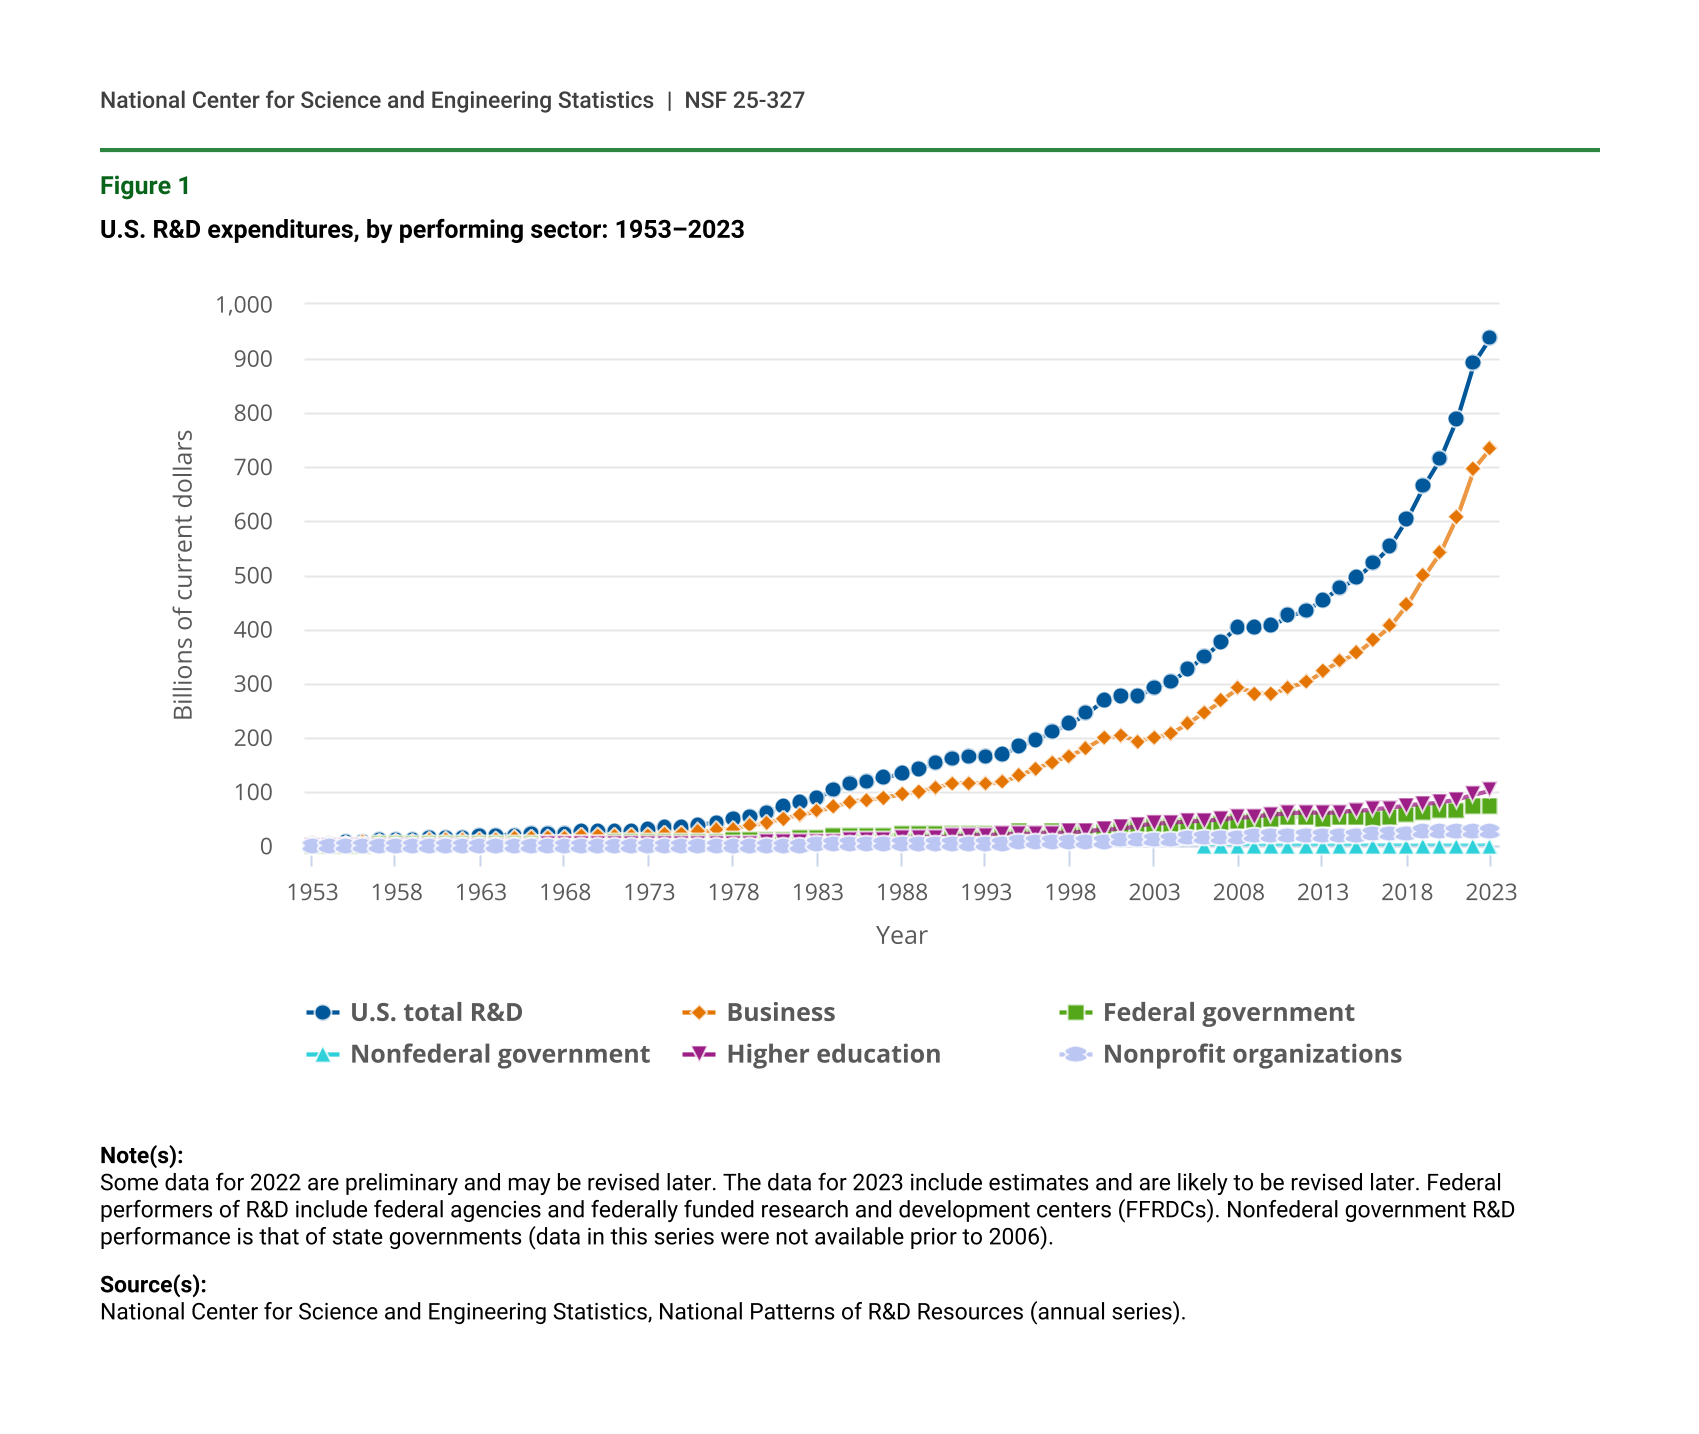
New data from the National Center for Science and Engineering Statistics (NCSES) within the U.S. National Science Foundation indicate that research and experimental development (R&D) performed in the United States totaled $892 billion in 2022 (figure 1). The estimated total for 2023, based on performer-reported expectations, is $940 billion. Of the 2022 domestic R&D performance, $292 billion was research (basic and applied research combined) and $600 billion was experimental development. Of the $892 billion total, the business sector funded $673 billion and the federal government funded $164 billion.
U.S. R&D expenditures, by performing sector: 1953–2023
| Year | U.S. total R&D | Business | Federal government | Nonfederal government | Higher education | Nonprofit organizations |
|---|---|---|---|---|---|---|
| 1953 | 5.2 | 3.6 | 1.1 | NA | 0.3 | 0.1 |
| 1954 | 5.6 | 4.1 | 1.1 | NA | 0.3 | 0.1 |
| 1955 | 6.2 | 4.4 | 1.3 | NA | 0.3 | 0.1 |
| 1956 | 8.5 | 6.3 | 1.7 | NA | 0.4 | 0.1 |
| 1957 | 9.9 | 7.3 | 2.0 | NA | 0.4 | 0.2 |
| 1958 | 10.9 | 8.1 | 2.2 | NA | 0.5 | 0.2 |
| 1959 | 12.5 | 9.2 | 2.5 | NA | 0.6 | 0.2 |
| 1960 | 13.7 | 10.0 | 2.7 | NA | 0.7 | 0.3 |
| 1961 | 14.6 | 10.4 | 3.1 | NA | 0.8 | 0.3 |
| 1962 | 15.6 | 11.0 | 3.2 | NA | 1.0 | 0.4 |
| 1963 | 17.5 | 12.2 | 3.7 | NA | 1.2 | 0.4 |
| 1964 | 19.1 | 13.0 | 4.3 | NA | 1.4 | 0.4 |
| 1965 | 20.3 | 13.8 | 4.4 | NA | 1.6 | 0.5 |
| 1966 | 22.1 | 15.2 | 4.5 | NA | 1.8 | 0.5 |
| 1967 | 23.3 | 16.0 | 4.8 | NA | 2.0 | 0.6 |
| 1968 | 24.7 | 17.0 | 4.9 | NA | 2.2 | 0.6 |
| 1969 | 26.0 | 17.8 | 5.2 | NA | 2.3 | 0.6 |
| 1970 | 26.3 | 17.6 | 5.6 | NA | 2.4 | 0.7 |
| 1971 | 27.0 | 17.8 | 5.8 | NA | 2.6 | 0.7 |
| 1972 | 28.7 | 19.0 | 6.2 | NA | 2.8 | 0.8 |
| 1973 | 31.0 | 20.7 | 6.4 | NA | 3.0 | 0.9 |
| 1974 | 33.4 | 22.2 | 6.9 | NA | 3.2 | 1.0 |
| 1975 | 35.7 | 23.5 | 7.6 | NA | 3.6 | 1.1 |
| 1976 | 39.4 | 26.1 | 8.3 | NA | 3.9 | 1.1 |
| 1977 | 43.3 | 28.9 | 8.9 | NA | 4.3 | 1.2 |
| 1978 | 48.7 | 32.2 | 10.1 | NA | 5.0 | 1.4 |
| 1979 | 55.4 | 37.1 | 11.0 | NA | 5.7 | 1.6 |
| 1980 | 63.2 | 43.2 | 11.9 | NA | 6.5 | 1.7 |
| 1981 | 72.3 | 50.4 | 13.0 | NA | 7.1 | 1.8 |
| 1982 | 80.7 | 57.2 | 14.1 | NA | 7.6 | 1.9 |
| 1983 | 89.9 | 63.7 | 15.8 | NA | 8.3 | 2.2 |
| 1984 | 102.2 | 73.1 | 17.5 | NA | 9.2 | 2.5 |
| 1985 | 114.7 | 82.4 | 19.2 | NA | 10.3 | 2.8 |
| 1986 | 120.2 | 85.9 | 19.9 | NA | 11.5 | 2.9 |
| 1987 | 126.4 | 90.2 | 20.4 | NA | 12.8 | 3.0 |
| 1988 | 133.9 | 94.9 | 21.6 | NA | 14.2 | 3.2 |
| 1989 | 141.9 | 99.9 | 22.7 | NA | 15.6 | 3.7 |
| 1990 | 152.0 | 107.4 | 23.5 | NA | 16.9 | 4.1 |
| 1991 | 160.9 | 114.7 | 23.3 | NA | 18.2 | 4.7 |
| 1992 | 165.4 | 116.8 | 24.2 | NA | 19.4 | 5.0 |
| 1993 | 165.7 | 115.4 | 24.5 | NA | 20.5 | 5.3 |
| 1994 | 169.2 | 117.4 | 24.6 | NA | 21.6 | 5.6 |
| 1995 | 183.6 | 129.8 | 25.4 | NA | 22.6 | 5.8 |
| 1996 | 197.3 | 142.4 | 25.0 | NA | 23.7 | 6.2 |
| 1997 | 211.9 | 155.4 | 25.2 | NA | 24.6 | 6.6 |
| 1998 | 225.8 | 167.1 | 25.8 | NA | 25.6 | 7.2 |
| 1999 | 244.5 | 182.1 | 26.8 | NA | 27.5 | 8.0 |
| 2000 | 267.9 | 200.0 | 28.5 | NA | 29.9 | 9.6 |
| 2001 | 278.5 | 202.0 | 32.8 | NA | 32.7 | 11.0 |
| 2002 | 277.9 | 193.9 | 35.5 | NA | 36.7 | 11.9 |
| 2003 | 291.4 | 200.7 | 37.2 | NA | 40.6 | 12.8 |
| 2004 | 302.7 | 208.3 | 37.7 | NA | 43.3 | 13.4 |
| 2005 | 325.3 | 226.2 | 39.6 | NA | 45.5 | 14.1 |
| 2006 | 350.9 | 247.7 | 41.6 | 0.3 | 47.4 | 14.0 |
| 2007 | 377.9 | 269.3 | 44.1 | 0.4 | 49.4 | 14.7 |
| 2008 | 404.8 | 290.7 | 45.6 | 0.5 | 52.1 | 15.9 |
| 2009 | 402.9 | 282.4 | 47.6 | 0.6 | 54.9 | 17.5 |
| 2010 | 406.6 | 279.0 | 50.8 | 0.7 | 58.1 | 18.0 |
| 2011 | 426.2 | 294.1 | 53.5 | 0.7 | 60.1 | 17.8 |
| 2012 | 433.7 | 302.3 | 52.1 | 0.7 | 60.9 | 17.8 |
| 2013 | 454.2 | 322.5 | 51.1 | 0.6 | 61.5 | 18.5 |
| 2014 | 475.9 | 340.7 | 52.7 | 0.6 | 62.3 | 19.6 |
| 2015 | 494.5 | 355.8 | 52.8 | 0.6 | 64.6 | 20.6 |
| 2016 | 521.7 | 379.5 | 51.2 | 0.6 | 67.8 | 22.6 |
| 2017 | 553.5 | 405.8 | 52.6 | 0.6 | 71.1 | 23.4 |
| 2018 | 603.8 | 445.6 | 58.4 | 0.6 | 74.9 | 24.4 |
| 2019 | 665.3 | 498.2 | 62.8 | 0.7 | 78.1 | 25.5 |
| 2020 | 716.5 | 543.2 | 65.1 | 0.7 | 80.8 | 26.7 |
| 2021 | 788.7 | 608.6 | 66.7 | 0.7 | 85.7 | 27.0 |
| 2022 | 891.8 | 697.3 | 71.5 | 0.7 | 94.3 | 28.1 |
| 2023 | 939.6 | 735.0 | 73.6 | 0.7 | 102.0 | 28.2 |
Note(s):
Some data for 2022 are preliminary and may be revised later. The data for 2023 include estimates and are likely to be revised later. Federal performers of R&D include federal agencies and federally funded research and development centers (FFRDCs). Nonfederal government R&D performance is that of state governments (data in this series were not available prior to 2006).
Source(s):
National Center for Science and Engineering Statistics, National Patterns of R&D Resources (annual series).
R&D can be broken down by type of R&D, R&D performer, and sources of R&D funding, all of which are of interest in part because knowledge generated by R&D can have not only direct benefits (new products and services) to those performing the R&D but also “spillover” benefits. R&D spillovers occur because “[i]deas generated by one inventor may lead other inventors to create other new ideas.” Researchers have documented that the type of R&D and source of funds impact the magnitude of these R&D spillovers.
The U.S. R&D system consists of the activities of a diverse group of R&D performers and sources of funding. Performers and sources include private businesses, the federal government, nonfederal governments such as state and local, higher education institutions, and other nonprofit organizations. Organizations can have multiple roles in the performance and funding of R&D. They may perform R&D funded by themselves, by others, or by both. They may also only fund R&D outside their organization or may fund both internal and external R&D. The data for this InfoBrief derive mainly from NCSES surveys of the annual R&D expenditures of these performers and funders.
The “Data Sources, Limitations, and Availability” section at the end of this InfoBrief summarizes the main data sources and methodology and provides further details on the data. Data cited in this report that do not appear in one of this InfoBrief’s tables or figures come from the National Patterns of R&D data tables.
Preliminary 2023 Estimates and Current Trends in U.S. R&D Totals and National R&D Intensity
U.S. Total R&D
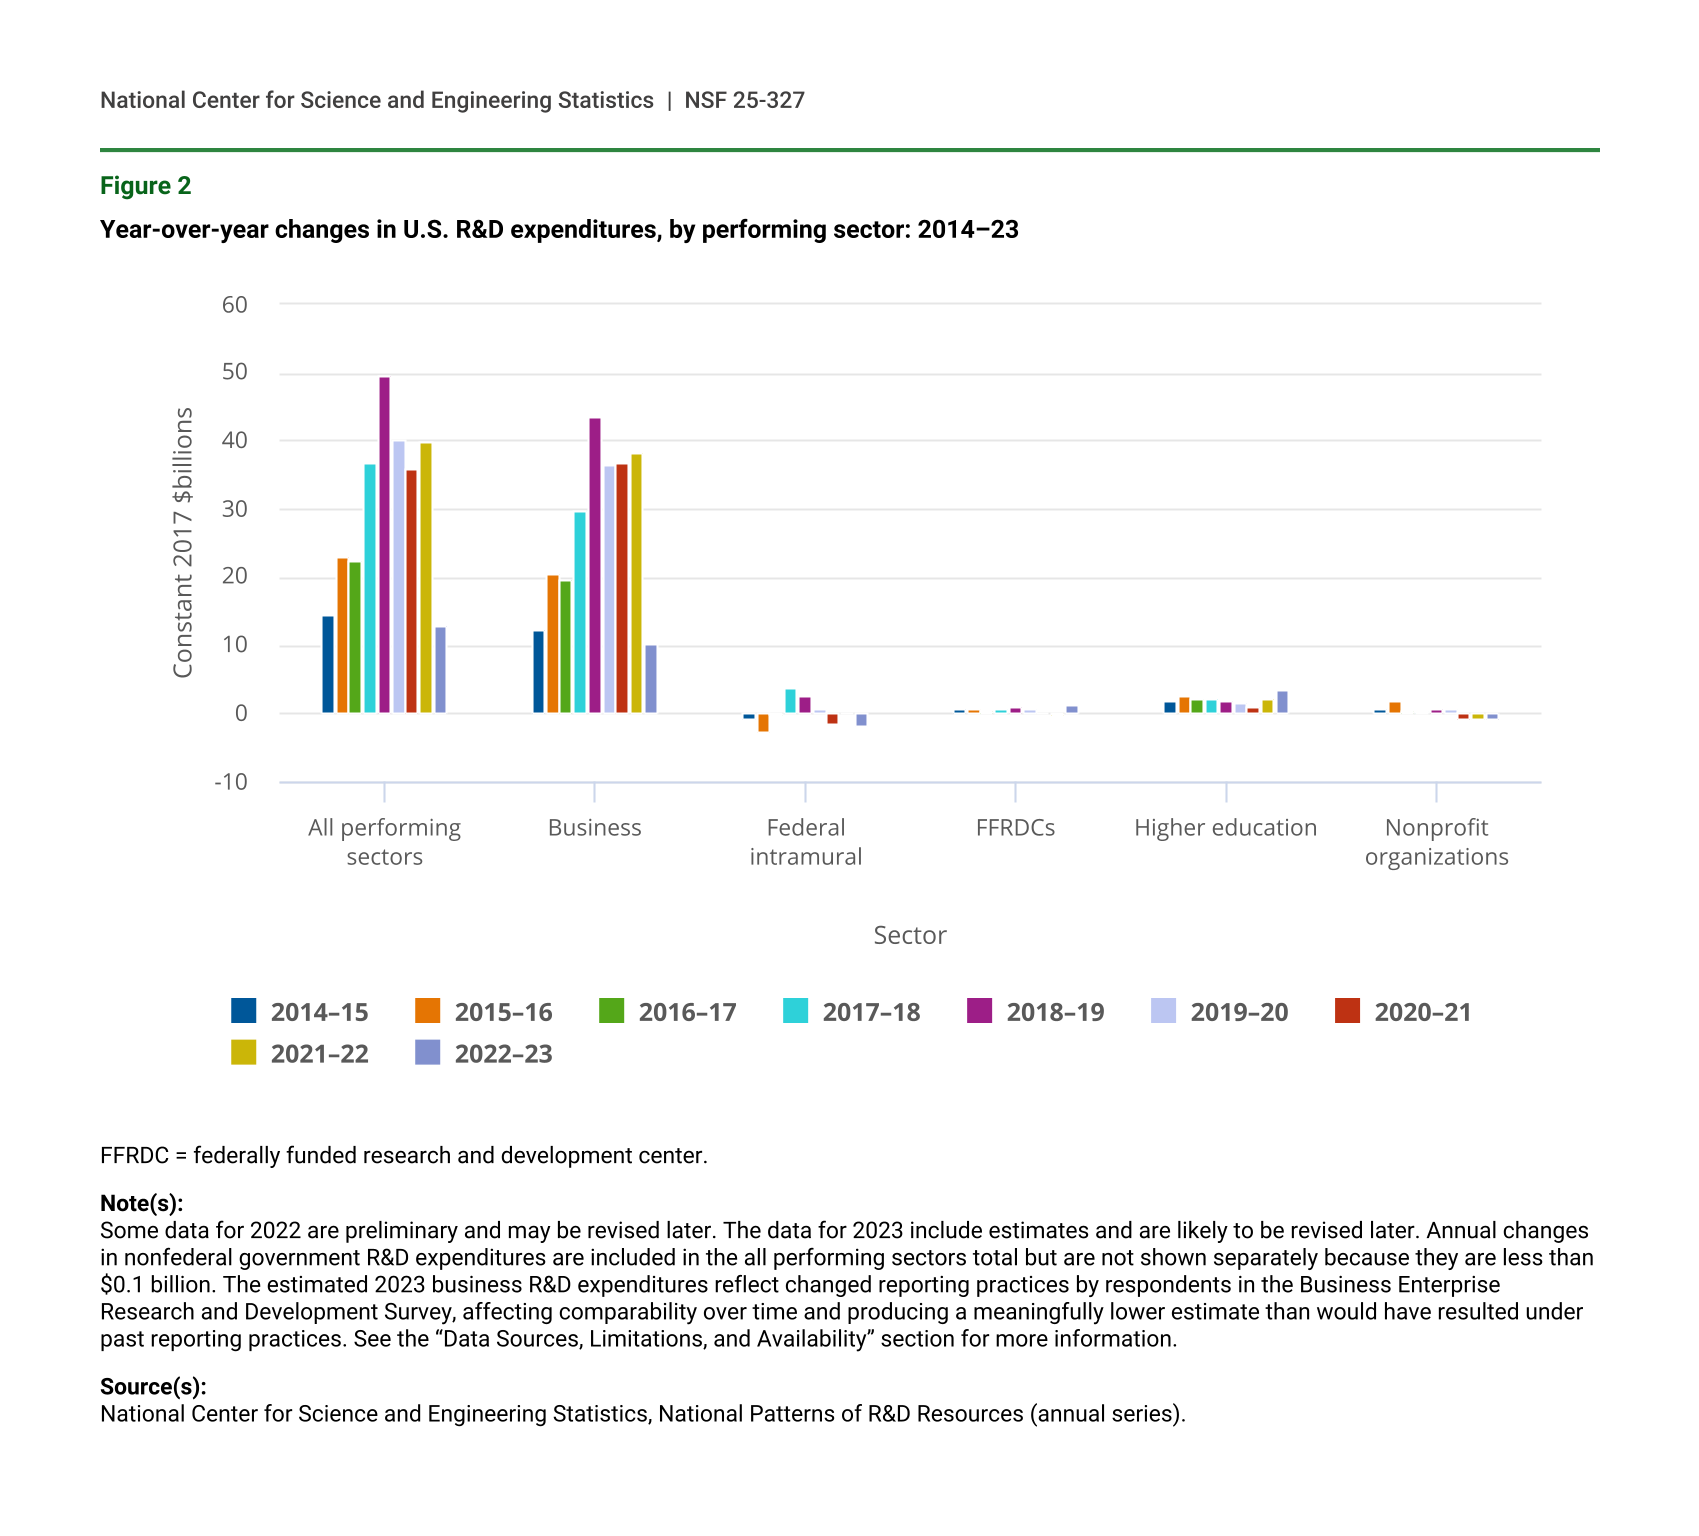
Adjusting for inflation (in constant 2017 dollars), U.S. total R&D expenditures are estimated to increase by $13 billion from 2022 to 2023, with the business sector accounting for most of this increase (figure 2). In constant dollar terms, business R&D performance is estimated to increase by $10 billion in 2023, considerably less than the increase of $38 billion in 2022. Every year some of the variation in R&D estimates is due to changes in individual survey respondent reporting practices. During the 2023 Business Enterprise Research and Development (BERD) Survey data collection some respondents revised their reporting practices and eliminated expenditures that did not meet the definition of R&D. Consequently, the estimated 2023 business R&D expenditures reported here are adjusted to this lower and more accurate R&D expenditure amount. This has resulted in a meaningful decrease in estimated 2023 U.S. R&D performance compared to what would have been estimated based on respondent reporting practices used in 2022 and earlier.
Year-over-year changes in U.S. R&D expenditures, by performing sector: 2014–23
| Sector | 2014–15 | 2015–16 | 2016–17 | 2017–18 | 2018–19 | 2019–20 | 2020–21 | 2021–22 | 2022–23 |
|---|---|---|---|---|---|---|---|---|---|
| All performing sectors | 14.5 | 22.9 | 22.5 | 36.8 | 49.5 | 40.2 | 35.9 | 39.7 | 12.8 |
| Business | 12.3 | 20.7 | 19.5 | 29.8 | 43.5 | 36.5 | 36.9 | 38.3 | 10.3 |
| Federal intramural | -0.9 | -2.8 | -0.1 | 3.7 | 2.4 | 0.8 | -1.5 | 0.2 | -1.8 |
| FFRDCs | 0.6 | 0.6 | 0.5 | 0.8 | 1.0 | 0.6 | 0.2 | -0.1 | 1.4 |
| Higher education | 1.8 | 2.6 | 2.1 | 2.1 | 1.9 | 1.5 | 1.1 | 2.1 | 3.6 |
| Nonprofit organizations | 0.8 | 1.8 | 0.5 | 0.4 | 0.7 | 0.8 | -0.8 | -0.8 | -0.7 |
FFRDC = federally funded research and development center.
Note(s):
Some data for 2022 are preliminary and may be revised later. The data for 2023 include estimates and are likely to be revised later. Annual changes in nonfederal government R&D expenditures are included in the all performing sectors total but are not shown separately because they are less than $0.1 billion. The estimated 2023 business R&D expenditures reflect changed reporting practices by respondents in the Business Enterprise Research and Development Survey, affecting comparability over time and producing a meaningfully lower estimate than would have resulted under past reporting practices. See the “Data Sources, Limitations, and Availability” section for more information.
Source(s):
National Center for Science and Engineering Statistics, National Patterns of R&D Resources (annual series).
Compared to the business sector, annual changes in inflation-adjusted R&D estimated for 2023 are minor for other R&D sectors, such as federal intramural performers ($2 billion decrease) and federally funded research and development centers (FFRDCs) ($1 billion increase). R&D performance in the higher education sector is estimated to increase $4 billion in 2023, building on incremental real increases in R&D expenditures over the last several years. For nonprofit organizations, the change in 2023 R&D performance is not statistically significant.
Over the last decade (2012–22), the average annual increase in U.S. total R&D expenditures was 7.5% (measured as compound average growth rate [CAGR]) in current dollars, or $46 billion (table 1). The recent 7.5% growth rate is higher than that observed over prior decades, such as 1992–2002 (5.3%) and 2002–2012 (4.6%). Annual growth in R&D expenditures increased in the late 2010s, with several consecutive years of increases of greater than $50 billion beginning in 2017–18. Since 2010, annual growth peaked at 13.1% in current dollars for 2021–22 but was substantially lower for that year (5.5%) after adjusting for inflation. In constant dollars, total R&D performance grew at an average of 5.0% from 2012 to 2022. For 2023, total R&D performance and business R&D performance are both estimated to increase 5.4% in current dollars or 1.7% in constant dollars over their 2022 levels. These smaller estimated increases for 2023 incorporate revised reporting practices adopted by business R&D performers in the BERD Survey, as discussed earlier in this text.
Annual change in U.S. R&D expenditures and gross domestic product, by performing sectors: 1992–2023
NA = not available.
FFRDC = federally funded research and development center.
a Some data for 2022 are preliminary and may be revised later.
b The R&D data for 2023 include estimates and are likely to be revised later.
c Survey data on state internal R&D performance were not available prior to 2006; data for 2008 were not collected.
Note(s):
The longer-term trend rates are calculated as compound annual growth rates.
Source(s):
National Center for Science and Engineering Statistics, National Patterns of R&D Resources (annual series).
R&D-to-GDP Ratio
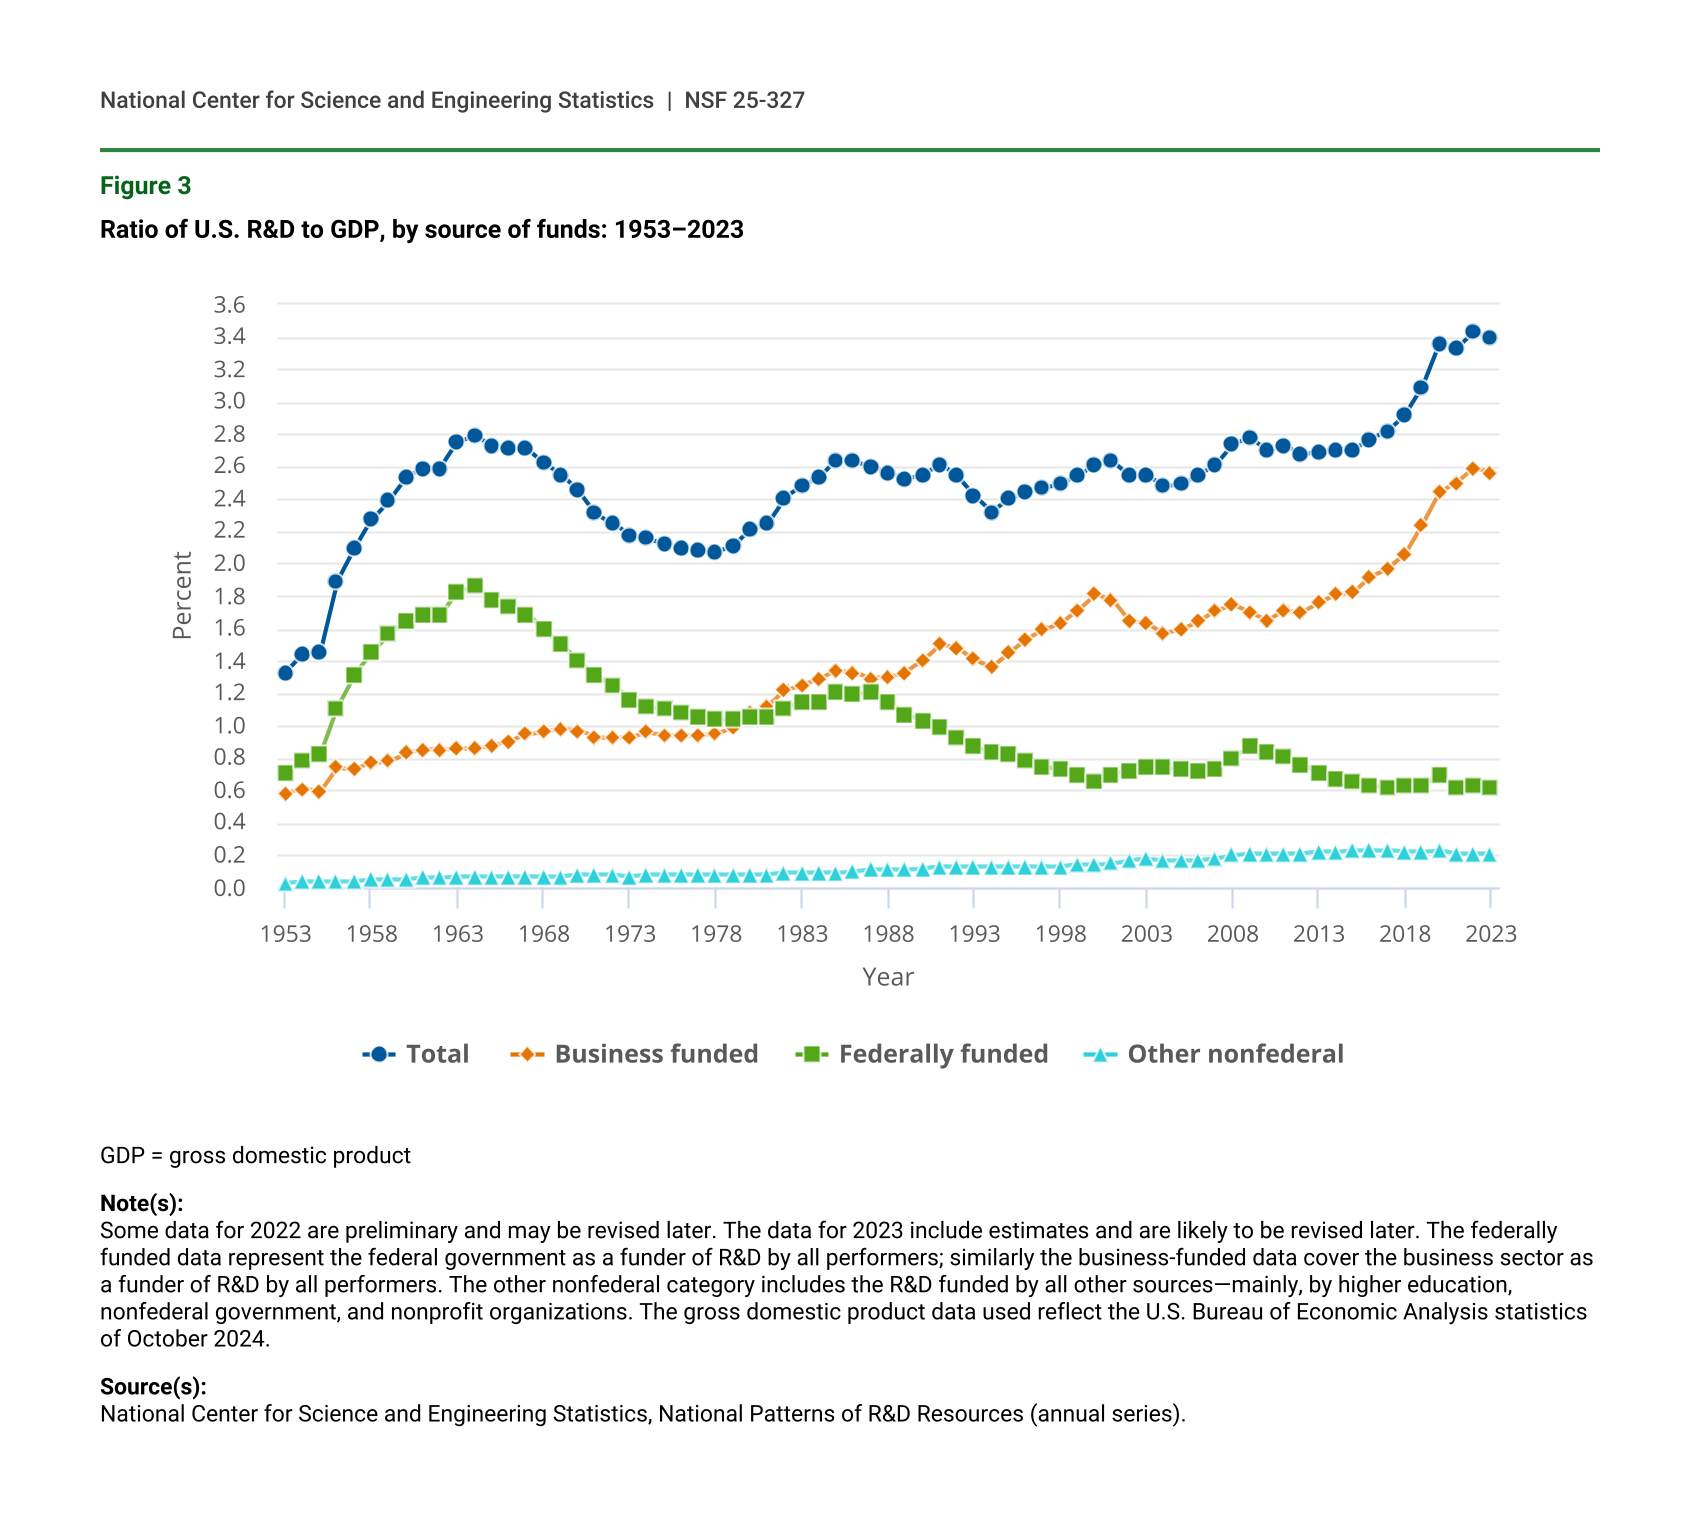
The ratio of total national R&D expenditures to gross domestic product (GDP) (i.e., R&D intensity) is widely used as an overall gauge of the relative priority of a nation’s R&D effort among multiple investment and consumption options. Numerous Organisation for Economic Co-operation and Development (OECD) and European Union (EU) nations, as well as the EU overall, have set R&D intensity targets at or above 3.0%. In this edition of the National Patterns series, the ratio of U.S. R&D to GDP was 3.43% in 2022 and is estimated to be 3.39% in 2023 (figure 3). Prior to 2019 when R&D intensity reached 3.09%, the highest U.S. ratios recorded were 2.79% in 1964, 2.78% in 2009, 2.77% again in 2016, 2.82% in 2017, and 2.92% in 2018. The U.S. 2022 R&D to GDP ratio exceeded the OECD average (2.73%). The U.S. ratio also exceeded that of other key R&D-performing nations, such as China (2.56%), France (2.18% [provisional]), and the United Kingdom (2.90% [provisional, 2021]). Israel (6.02% [estimated]) and South Korea (5.21% [provisional]) had higher ratios than the United States, whereas Taiwan (3.96%), Germany (3.13% [provisional]), and Japan (3.41%) had similar ratios to the United States.
Ratio of U.S. R&D to GDP, by source of funds: 1953–2023
| Year | Total | Business funded | Federally funded | Other nonfederal |
|---|---|---|---|---|
| 1953 | 1.33 | 0.58 | 0.71 | 0.03 |
| 1954 | 1.44 | 0.61 | 0.79 | 0.04 |
| 1955 | 1.45 | 0.59 | 0.82 | 0.04 |
| 1956 | 1.89 | 0.74 | 1.11 | 0.04 |
| 1957 | 2.09 | 0.73 | 1.31 | 0.04 |
| 1958 | 2.27 | 0.77 | 1.45 | 0.05 |
| 1959 | 2.39 | 0.78 | 1.57 | 0.05 |
| 1960 | 2.53 | 0.83 | 1.64 | 0.05 |
| 1961 | 2.59 | 0.85 | 1.69 | 0.06 |
| 1962 | 2.59 | 0.85 | 1.68 | 0.06 |
| 1963 | 2.75 | 0.86 | 1.83 | 0.07 |
| 1964 | 2.79 | 0.86 | 1.86 | 0.07 |
| 1965 | 2.73 | 0.88 | 1.78 | 0.07 |
| 1966 | 2.71 | 0.90 | 1.74 | 0.07 |
| 1967 | 2.71 | 0.95 | 1.69 | 0.07 |
| 1968 | 2.62 | 0.96 | 1.59 | 0.07 |
| 1969 | 2.55 | 0.98 | 1.50 | 0.07 |
| 1970 | 2.45 | 0.97 | 1.40 | 0.08 |
| 1971 | 2.31 | 0.93 | 1.31 | 0.08 |
| 1972 | 2.25 | 0.92 | 1.25 | 0.08 |
| 1973 | 2.17 | 0.93 | 1.16 | 0.07 |
| 1974 | 2.16 | 0.96 | 1.12 | 0.08 |
| 1975 | 2.12 | 0.94 | 1.10 | 0.08 |
| 1976 | 2.10 | 0.94 | 1.08 | 0.08 |
| 1977 | 2.08 | 0.94 | 1.06 | 0.08 |
| 1978 | 2.07 | 0.95 | 1.04 | 0.08 |
| 1979 | 2.11 | 0.99 | 1.04 | 0.08 |
| 1980 | 2.21 | 1.08 | 1.05 | 0.08 |
| 1981 | 2.25 | 1.12 | 1.05 | 0.08 |
| 1982 | 2.41 | 1.22 | 1.11 | 0.09 |
| 1983 | 2.48 | 1.25 | 1.14 | 0.09 |
| 1984 | 2.53 | 1.29 | 1.15 | 0.09 |
| 1985 | 2.64 | 1.34 | 1.21 | 0.09 |
| 1986 | 2.63 | 1.33 | 1.19 | 0.10 |
| 1987 | 2.60 | 1.29 | 1.21 | 0.11 |
| 1988 | 2.56 | 1.30 | 1.15 | 0.11 |
| 1989 | 2.52 | 1.33 | 1.07 | 0.11 |
| 1990 | 2.55 | 1.40 | 1.03 | 0.12 |
| 1991 | 2.61 | 1.50 | 0.99 | 0.13 |
| 1992 | 2.54 | 1.48 | 0.93 | 0.13 |
| 1993 | 2.42 | 1.41 | 0.88 | 0.13 |
| 1994 | 2.32 | 1.36 | 0.83 | 0.13 |
| 1995 | 2.40 | 1.45 | 0.82 | 0.13 |
| 1996 | 2.44 | 1.53 | 0.79 | 0.13 |
| 1997 | 2.47 | 1.59 | 0.75 | 0.13 |
| 1998 | 2.49 | 1.63 | 0.73 | 0.13 |
| 1999 | 2.54 | 1.71 | 0.69 | 0.14 |
| 2000 | 2.61 | 1.81 | 0.66 | 0.14 |
| 2001 | 2.63 | 1.78 | 0.70 | 0.15 |
| 2002 | 2.54 | 1.65 | 0.72 | 0.17 |
| 2003 | 2.54 | 1.63 | 0.74 | 0.18 |
| 2004 | 2.48 | 1.57 | 0.74 | 0.17 |
| 2005 | 2.49 | 1.59 | 0.73 | 0.17 |
| 2006 | 2.54 | 1.64 | 0.72 | 0.17 |
| 2007 | 2.61 | 1.71 | 0.73 | 0.18 |
| 2008 | 2.74 | 1.75 | 0.80 | 0.20 |
| 2009 | 2.78 | 1.70 | 0.87 | 0.21 |
| 2010 | 2.70 | 1.65 | 0.84 | 0.21 |
| 2011 | 2.73 | 1.71 | 0.81 | 0.21 |
| 2012 | 2.67 | 1.70 | 0.76 | 0.21 |
| 2013 | 2.69 | 1.76 | 0.71 | 0.22 |
| 2014 | 2.70 | 1.81 | 0.67 | 0.22 |
| 2015 | 2.70 | 1.82 | 0.65 | 0.23 |
| 2016 | 2.77 | 1.92 | 0.63 | 0.23 |
| 2017 | 2.82 | 1.97 | 0.62 | 0.23 |
| 2018 | 2.92 | 2.06 | 0.63 | 0.22 |
| 2019 | 3.09 | 2.24 | 0.63 | 0.22 |
| 2020 | 3.36 | 2.44 | 0.69 | 0.23 |
| 2021 | 3.33 | 2.50 | 0.62 | 0.21 |
| 2022 | 3.43 | 2.59 | 0.63 | 0.21 |
| 2023 | 3.39 | 2.56 | 0.62 | 0.21 |
GDP = gross domestic product
Note(s):
Some data for 2022 are preliminary and may be revised later. The data for 2023 include estimates and are likely to be revised later. The federally funded data represent the federal government as a funder of R&D by all performers; similarly the business-funded data cover the business sector as a funder of R&D by all performers. The other nonfederal category includes the R&D funded by all other sources—mainly, by higher education, nonfederal government, and nonprofit organizations. The gross domestic product data used reflect the U.S. Bureau of Economic Analysis statistics of October 2024.
Source(s):
National Center for Science and Engineering Statistics, National Patterns of R&D Resources (annual series).
The rising ratio of U.S. R&D to GDP is primarily attributable to increased business funding of R&D. Over the past decade (2012–22), business funding grew at a 9.3% rate in current dollars whereas federal funding grew at a 2.9% rate and GDP grew at a 4.8% rate. The higher education sector’s funding of R&D grew at 6.4% over the same period.
Federally funded R&D as a percentage of GDP peaked in the 1960s at 1.86% in 1964 and has since steadily declined. Since 2014, federal funding for R&D has remained at or below 0.70% of GDP, falling to 0.63% of GDP in 2022. By contrast, business R&D funding, which was below 1.00% of GDP through the 1960s, had reached 1.81% in 2014 and increased to 2.59% by 2022.
Performers of R&D
Business
The business sector is by far the largest performer of U.S. R&D. In 2022, domestically performed business R&D accounted for $697 billion, or 78% of the $892 billion national R&D total (table 2). The business sector’s predominance in national R&D performance has long been the case, with its annual share ranging between 69% and 78% since 2000.
U.S. R&D expenditures, by performing sector and source of funds: 2010–23
FFRDC = federally funded research and development center.
a Some data for 2022 are preliminary and may be revised later.
b The data for 2023 include estimates and are likely to be revised later.
c Federal intramural includes expenditures of federal intramural R&D as well as costs associated with administering extramural R&D.
Note(s):
Data are based on annual reports by performers, except for the nonprofit sector. Expenditure levels for higher education, federal government, and nonfederal government performers are calendar year approximations based on fiscal year data.
Source(s):
National Center for Science and Engineering Statistics, National Patterns of R&D Resources (annual series).
Higher Education
R&D performed in the United States by the higher education sector totaled $94 billion in 2022, or 11% of U.S. total R&D (table 2). In the period 2000–22, the higher education share of U.S. total R&D ranged between 11% and 14%.
Adjusted for inflation, growth in the higher education sector’s R&D performance averaged 2.0% annually during 2012–22, well behind U.S. total annual R&D growth (5.0%) over the same period. The annual percent change in higher education R&D has varied in recent years, with low growth or contraction in 2010–14 with a return to modest increases in 2015 in constant dollars. The estimate for 2023 indicates 4.5% growth from 2022 when measured in constant dollars (table 1). In terms of long-term trends, constant-dollar annual growth in higher education R&D performance has been lower during the most recent decade (2.0% for 2012–22) than it has in preceding decades (4.6% for 1992–2002 and 3.0% for 2002–12).
Federal Agencies and Federally Funded Research and Development Centers
The federal government performed $72 billion of the U.S. R&D total in 2022 (table 2). This amount included $45 billion (5% of the U.S. total) performed by the intramural R&D facilities of federal agencies and $27 billion (3%) performed by the 42 FFRDCs. The federal share of U.S. R&D performance ranged between 11% and 13% in 2001–11 and declined to 9% by 2019. Subsequently, the federal share is estimated to further decline to 8% in 2023. Measured in constant dollars, federal R&D performance is estimated to decrease in 2023 after a modest increase in 2022 (table 1).
State Government
State agency intramural R&D performance in 2022 totaled $719 million—a small share (about 0.1%) of the U.S. total (table 2). This includes all 50 states and the District of Columbia.
Nonprofit Organizations
R&D performed in the United States by nonprofit organizations (excluding higher education institutions and federal and nonfederal government) was $28 billion in 2022 (table 2). This was 3% of U.S. total R&D, a share that has changed little since the early 2000s.
R&D by Type of R&D
In 2022, basic research activities in all sectors accounted for $130 billion, or 15% of U.S. total R&D expenditures (table 3). Applied research was $162 billion, or 18% of the total. Most of the total of U.S. R&D expenditures was experimental development at $600 billion, or 67%. Over the past decade, the share of R&D classified as experimental development increased slightly (from 63% to 67%), whereas shares of basic research (17% to 15%) and applied research (20% to 18%) decreased. Adjusting for inflation, basic research expenditures increased by about $31 billion from 2012 to 2022, applied research increased by $44 billion, and experimental development grew by $215 billion.
U.S. R&D expenditures, by type of R&D and performing sector: Selected years: 1970–2023
NA = not available
FFRDC = federally funded research and development center.
a Some data for 2022 are preliminary and may later be revised.
b The data for 2023 include estimates and are likely to later be revised.
Note(s):
Data throughout the span of time reported here are consistently based on Organisation for Economic Co-operation and Development Frascati Manual definitions for basic research, applied research, and experimental development. Prior to 2010, however, some changes had been introduced in the questionnaires of the sectoral expenditure surveys to improve the accuracy of respondents' classification of their R&D by type. Accordingly, small percentage changes in the historical data may not be meaningful.
Source(s):
National Center for Science and Engineering Statistics, National Patterns of R&D Resources (annual series).
Type of R&D by Performer
The higher education sector accounted for just under half (46%) of basic research performance in 2022 (table 3). The business sector was the second largest basic research performer (33%). Business was the majority performer (64%) of the $162 billion of applied research in 2022; higher education was second at 16%. Federal intramural performers plus FFRDCs accounted for 15% of the applied research total. Business continued to dominate development performance, accounting for 92% of the U.S. total $600 billion of that category in 2022. From 2012 to 2022, the business sector increased its share of R&D performance across all three types of R&D, notably increasing its share of basic research performance, from 18% to 33%. The share of U.S. basic research performed by higher education institutions—historically, the nation’s largest basic research performer—declined from 54% in 2012 to 46% in 2022. In absolute terms, higher education basic research performance increased from $40 billion to $60 billion during this period. The increased relative role of the business sector as a performer of basic and applied research is remarkable given its historical focus on experimental development.
Type of R&D by Source of Funds
Federal funding accounted for 41% of the $130 billion of basic research in 2022 (table 4). Federal funds were less prominent for applied research (29% of $162 billion) and experimental development (11% of $600 billion). The business sector provided the greatest share of funding for applied research (62%) and the predominant share for experimental development (88%). Notably, it also accounted for a sizable share (35%) of funding for basic research.
U.S. R&D expenditures, by performing sector, source of funds, and type of R&D: 2022
* = amount < $0.5 million; ** = small to negligible amount, included as part of the funding provided by nonprofit organizations.
FFRDC = federally funded research and development center.
Note(s):
Some data for 2022 are preliminary and may be revised later.
Source(s):
National Center for Science and Engineering Statistics, National Patterns of R&D Resources (annual series).
Trends in Type of R&D by Source of Funds
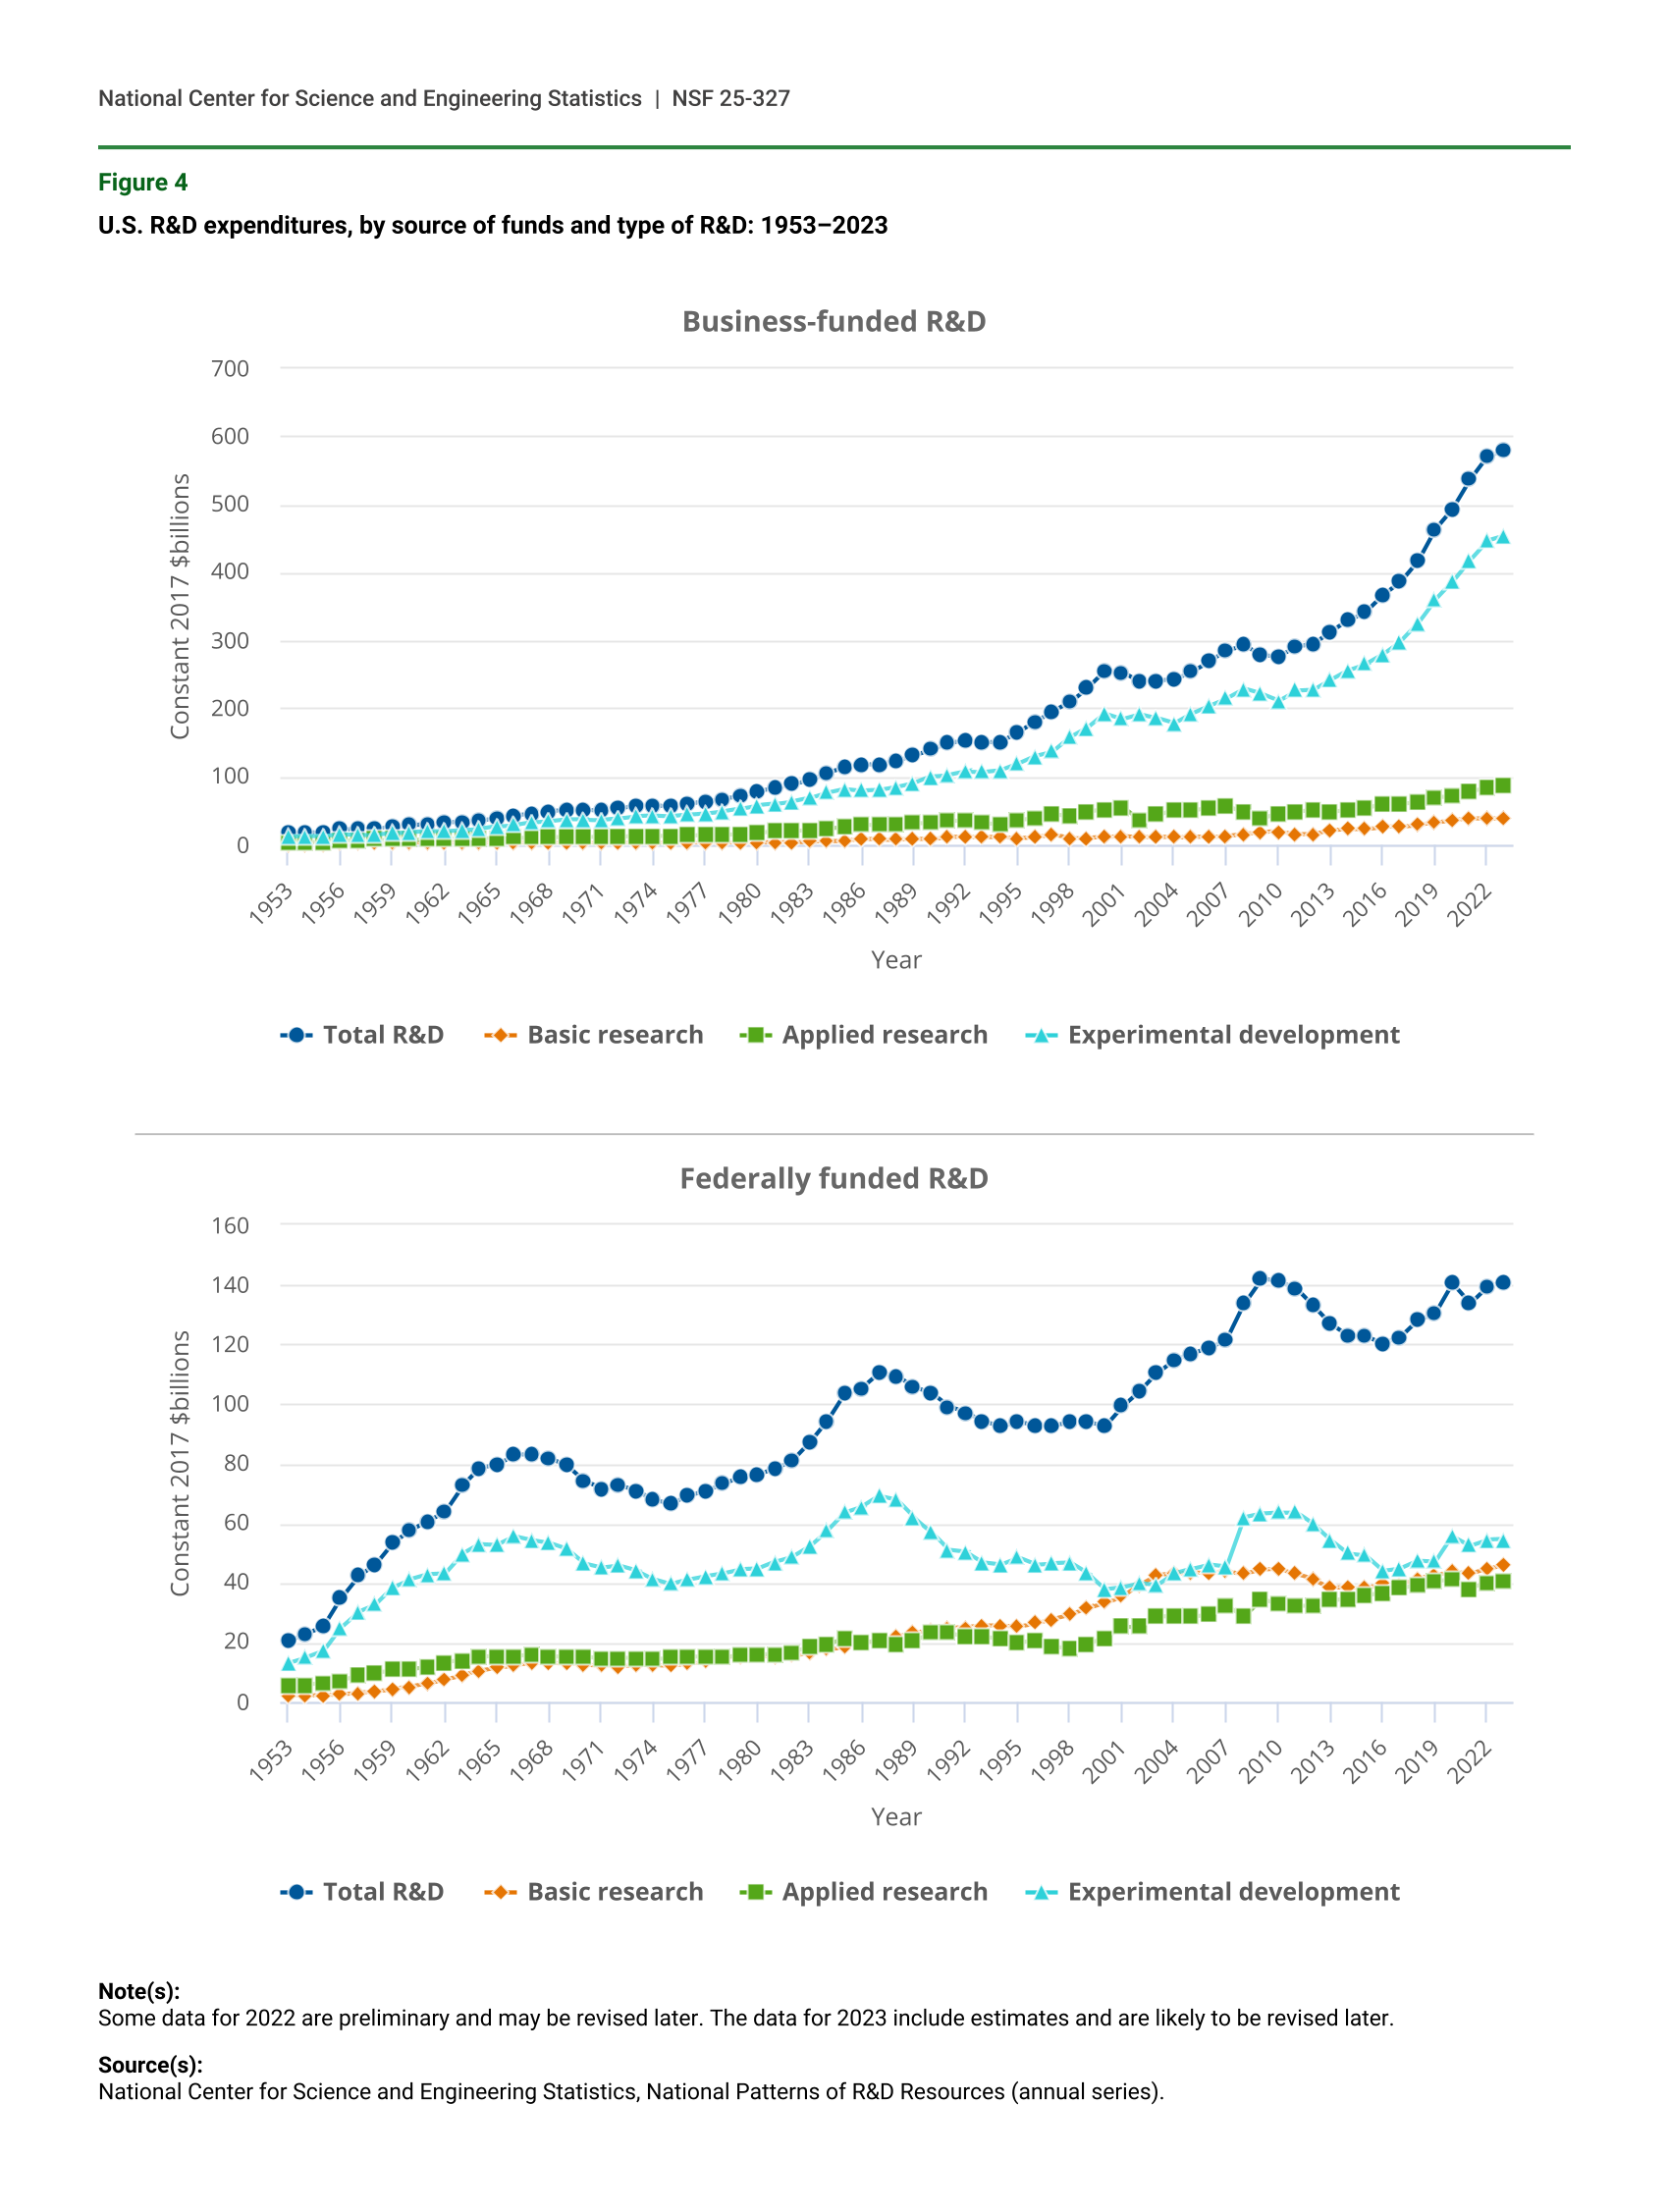
Social scientists have noted important differences in the nature, role, and impact of research (basic research and applied research combined) and experimental development. Additionally, the shifting in the relative roles of performers and funders by sector—particularly among business, government, and higher education—is of great interest. For example, recent findings have highlighted the significant R&D spillovers from government-funded research. Measured in constant 2017 dollars, 2022 business expenditures on R&D performed by domestic businesses, higher education institutions, governments, and nonprofit organizations totaled $570 billion, divided between $123 billion (22%) on research and $447 billion (78%) on experimental development (table 5, figure 4). In 2000, $62 billion (24%) of business R&D expenditures were on research and $193 billion (76%) of business expenditures were on experimental development. The federal government funded $139 billion in R&D in 2022 divided between $85 billion in research and $54 billion in experimental development (table 5, figure 4).
U.S. R&D expenditures, by type of R&D and source of funds: Selected years, 1970–2023
a Some data for 2022 are preliminary and may be revised later.
b The data for 2023 include estimates and are likely to be revised later.
Note(s):
Other nonfederal includes nonfederal government, higher education, and nonprofit organizations.
Source(s):
National Center for Science and Engineering Statistics, National Patterns of R&D Resources (annual series).
U.S. R&D expenditures, by source of funds and type of R&D: 1953–2023
| Year | Total R&D | Basic research | Applied research | Experimental development |
|---|---|---|---|---|
| 1953 | 16.71 | 1.15 | 3.39 | 12.17 |
| 1954 | 17.50 | 1.25 | 3.78 | 12.48 |
| 1955 | 18.27 | 1.39 | 4.22 | 12.66 |
| 1956 | 23.44 | 1.76 | 5.73 | 15.95 |
| 1957 | 23.53 | 1.81 | 6.90 | 14.82 |
| 1958 | 24.58 | 1.94 | 7.71 | 14.93 |
| 1959 | 26.59 | 1.90 | 7.89 | 16.80 |
| 1960 | 29.14 | 2.21 | 7.91 | 19.02 |
| 1961 | 30.38 | 2.31 | 7.63 | 20.44 |
| 1962 | 32.32 | 2.49 | 9.28 | 20.56 |
| 1963 | 34.03 | 2.65 | 9.25 | 22.13 |
| 1964 | 36.17 | 2.67 | 9.78 | 23.72 |
| 1965 | 39.51 | 2.78 | 9.98 | 26.75 |
| 1966 | 43.03 | 3.00 | 10.81 | 29.21 |
| 1967 | 46.46 | 2.82 | 10.78 | 32.86 |
| 1968 | 49.27 | 2.93 | 11.62 | 34.71 |
| 1969 | 52.20 | 2.82 | 12.10 | 37.29 |
| 1970 | 51.75 | 2.63 | 12.03 | 37.10 |
| 1971 | 51.02 | 2.60 | 11.75 | 36.68 |
| 1972 | 52.94 | 2.55 | 11.83 | 38.56 |
| 1973 | 56.97 | 2.60 | 12.40 | 41.97 |
| 1974 | 58.51 | 2.58 | 13.10 | 42.83 |
| 1975 | 56.92 | 2.53 | 12.66 | 41.73 |
| 1976 | 60.36 | 2.64 | 13.64 | 44.07 |
| 1977 | 63.05 | 2.77 | 14.16 | 46.13 |
| 1978 | 67.35 | 2.91 | 14.94 | 49.50 |
| 1979 | 72.27 | 3.07 | 16.05 | 53.15 |
| 1980 | 78.56 | 3.27 | 17.01 | 58.28 |
| 1981 | 83.41 | 3.71 | 19.79 | 59.91 |
| 1982 | 88.93 | 4.05 | 20.88 | 64.00 |
| 1983 | 95.19 | 4.51 | 22.08 | 68.59 |
| 1984 | 105.93 | 5.24 | 23.93 | 76.76 |
| 1985 | 114.04 | 5.73 | 25.95 | 82.35 |
| 1986 | 117.63 | 7.96 | 29.71 | 79.96 |
| 1987 | 117.77 | 8.06 | 29.19 | 80.52 |
| 1988 | 123.58 | 7.77 | 30.79 | 85.02 |
| 1989 | 131.14 | 8.21 | 32.28 | 90.65 |
| 1990 | 140.31 | 7.94 | 31.92 | 100.45 |
| 1991 | 150.55 | 11.67 | 35.79 | 103.08 |
| 1992 | 153.46 | 11.04 | 34.66 | 107.75 |
| 1993 | 150.40 | 11.12 | 32.01 | 107.28 |
| 1994 | 151.31 | 11.17 | 30.50 | 109.64 |
| 1995 | 165.63 | 10.03 | 36.48 | 119.12 |
| 1996 | 181.06 | 12.19 | 38.25 | 130.61 |
| 1997 | 196.43 | 14.96 | 43.99 | 137.48 |
| 1998 | 210.75 | 9.42 | 43.22 | 158.11 |
| 1999 | 231.39 | 10.45 | 48.64 | 172.31 |
| 2000 | 255.73 | 11.19 | 51.28 | 193.27 |
| 2001 | 253.37 | 12.64 | 55.49 | 185.25 |
| 2002 | 239.29 | 11.57 | 35.64 | 192.08 |
| 2003 | 241.76 | 11.71 | 43.78 | 186.27 |
| 2004 | 241.98 | 11.23 | 52.51 | 178.24 |
| 2005 | 254.76 | 12.05 | 50.14 | 192.57 |
| 2006 | 270.22 | 11.21 | 54.69 | 204.32 |
| 2007 | 285.83 | 12.98 | 57.47 | 215.39 |
| 2008 | 293.16 | 15.67 | 48.15 | 229.34 |
| 2009 | 278.48 | 18.25 | 38.71 | 221.53 |
| 2010 | 276.83 | 19.47 | 45.89 | 211.46 |
| 2011 | 291.24 | 16.29 | 47.86 | 227.08 |
| 2012 | 295.89 | 16.42 | 51.21 | 228.26 |
| 2013 | 313.59 | 22.21 | 48.66 | 242.72 |
| 2014 | 330.23 | 23.61 | 49.95 | 256.68 |
| 2015 | 342.43 | 23.40 | 53.14 | 265.89 |
| 2016 | 366.74 | 26.40 | 60.48 | 279.86 |
| 2017 | 386.53 | 26.95 | 60.77 | 298.82 |
| 2018 | 416.92 | 29.51 | 62.12 | 325.30 |
| 2019 | 463.75 | 32.76 | 70.54 | 360.45 |
| 2020 | 493.85 | 36.33 | 70.93 | 386.59 |
| 2021 | 536.39 | 38.69 | 79.24 | 418.46 |
| 2022 | 570.32 | 38.79 | 84.27 | 447.26 |
| 2023 | 579.98 | 39.42 | 85.79 | 454.77 |
| Year | Total R&D | Basic research | Applied research | Experimental development |
|---|---|---|---|---|
| 1953 | 20.69 | 1.97 | 5.62 | 13.10 |
| 1954 | 22.86 | 2.14 | 5.78 | 14.93 |
| 1955 | 25.41 | 2.30 | 6.07 | 17.03 |
| 1956 | 34.88 | 2.75 | 7.19 | 24.95 |
| 1957 | 42.27 | 3.06 | 8.84 | 30.37 |
| 1958 | 46.25 | 3.56 | 9.93 | 32.76 |
| 1959 | 53.42 | 4.35 | 10.66 | 38.40 |
| 1960 | 57.53 | 5.12 | 11.18 | 41.23 |
| 1961 | 60.56 | 6.21 | 11.56 | 42.79 |
| 1962 | 63.96 | 7.69 | 13.24 | 43.04 |
| 1963 | 72.63 | 9.02 | 14.00 | 49.62 |
| 1964 | 78.42 | 10.40 | 15.12 | 52.90 |
| 1965 | 79.60 | 11.46 | 15.40 | 52.74 |
| 1966 | 83.14 | 12.18 | 15.40 | 55.55 |
| 1967 | 83.06 | 13.00 | 15.76 | 54.30 |
| 1968 | 81.86 | 13.12 | 15.37 | 53.37 |
| 1969 | 79.41 | 12.81 | 15.25 | 51.35 |
| 1970 | 74.22 | 12.39 | 15.36 | 46.47 |
| 1971 | 71.70 | 12.06 | 14.57 | 45.07 |
| 1972 | 72.48 | 12.00 | 14.65 | 45.82 |
| 1973 | 71.06 | 12.20 | 14.69 | 44.17 |
| 1974 | 67.95 | 12.37 | 14.28 | 41.30 |
| 1975 | 66.67 | 12.29 | 14.84 | 39.54 |
| 1976 | 69.19 | 12.93 | 15.22 | 41.03 |
| 1977 | 70.85 | 13.59 | 15.03 | 42.22 |
| 1978 | 73.22 | 14.85 | 15.24 | 43.14 |
| 1979 | 75.40 | 15.39 | 15.52 | 44.49 |
| 1980 | 76.16 | 15.61 | 15.88 | 44.67 |
| 1981 | 78.29 | 15.29 | 16.02 | 46.97 |
| 1982 | 81.15 | 15.56 | 16.80 | 48.78 |
| 1983 | 87.17 | 16.52 | 18.38 | 52.28 |
| 1984 | 94.32 | 17.56 | 19.28 | 57.48 |
| 1985 | 103.57 | 18.51 | 21.50 | 63.56 |
| 1986 | 105.35 | 19.71 | 20.08 | 65.56 |
| 1987 | 110.31 | 20.87 | 20.38 | 69.05 |
| 1988 | 109.31 | 21.99 | 19.54 | 67.78 |
| 1989 | 105.77 | 23.43 | 20.56 | 61.79 |
| 1990 | 103.89 | 23.70 | 23.09 | 57.09 |
| 1991 | 99.14 | 24.93 | 23.29 | 50.92 |
| 1992 | 97.14 | 25.05 | 21.83 | 50.26 |
| 1993 | 94.29 | 25.55 | 21.93 | 46.82 |
| 1994 | 92.70 | 25.58 | 21.05 | 46.07 |
| 1995 | 94.07 | 25.38 | 20.23 | 48.46 |
| 1996 | 93.00 | 26.50 | 20.48 | 46.03 |
| 1997 | 92.82 | 27.77 | 18.53 | 46.52 |
| 1998 | 94.00 | 29.20 | 18.19 | 46.61 |
| 1999 | 93.96 | 31.45 | 19.50 | 43.01 |
| 2000 | 92.46 | 33.41 | 21.24 | 37.81 |
| 2001 | 99.24 | 35.40 | 25.26 | 38.58 |
| 2002 | 104.45 | 39.36 | 25.09 | 39.99 |
| 2003 | 110.55 | 42.65 | 28.70 | 39.20 |
| 2004 | 114.82 | 43.15 | 28.50 | 43.16 |
| 2005 | 116.99 | 43.60 | 28.66 | 44.72 |
| 2006 | 118.87 | 43.26 | 29.36 | 46.26 |
| 2007 | 121.75 | 43.96 | 32.18 | 45.60 |
| 2008 | 133.63 | 42.97 | 28.69 | 61.97 |
| 2009 | 142.02 | 44.33 | 34.54 | 63.15 |
| 2010 | 141.26 | 44.78 | 32.96 | 63.52 |
| 2011 | 138.84 | 42.95 | 32.18 | 63.72 |
| 2012 | 132.89 | 41.02 | 32.25 | 59.63 |
| 2013 | 126.76 | 38.28 | 34.08 | 54.39 |
| 2014 | 122.76 | 38.42 | 34.47 | 49.87 |
| 2015 | 122.83 | 38.27 | 35.41 | 49.15 |
| 2016 | 120.29 | 39.58 | 36.72 | 43.99 |
| 2017 | 122.44 | 39.28 | 38.25 | 44.91 |
| 2018 | 128.08 | 41.41 | 39.26 | 47.42 |
| 2019 | 130.46 | 42.78 | 40.48 | 47.20 |
| 2020 | 140.46 | 43.61 | 41.19 | 55.65 |
| 2021 | 133.66 | 43.01 | 38.11 | 52.54 |
| 2022 | 139.35 | 44.79 | 40.08 | 54.48 |
| 2023 | 140.95 | 45.80 | 40.63 | 54.52 |
Note(s):
Some data for 2022 are preliminary and may be revised later. The data for 2023 include estimates and are likely to be revised later.
Source(s):
National Center for Science and Engineering Statistics, National Patterns of R&D Resources (annual series).
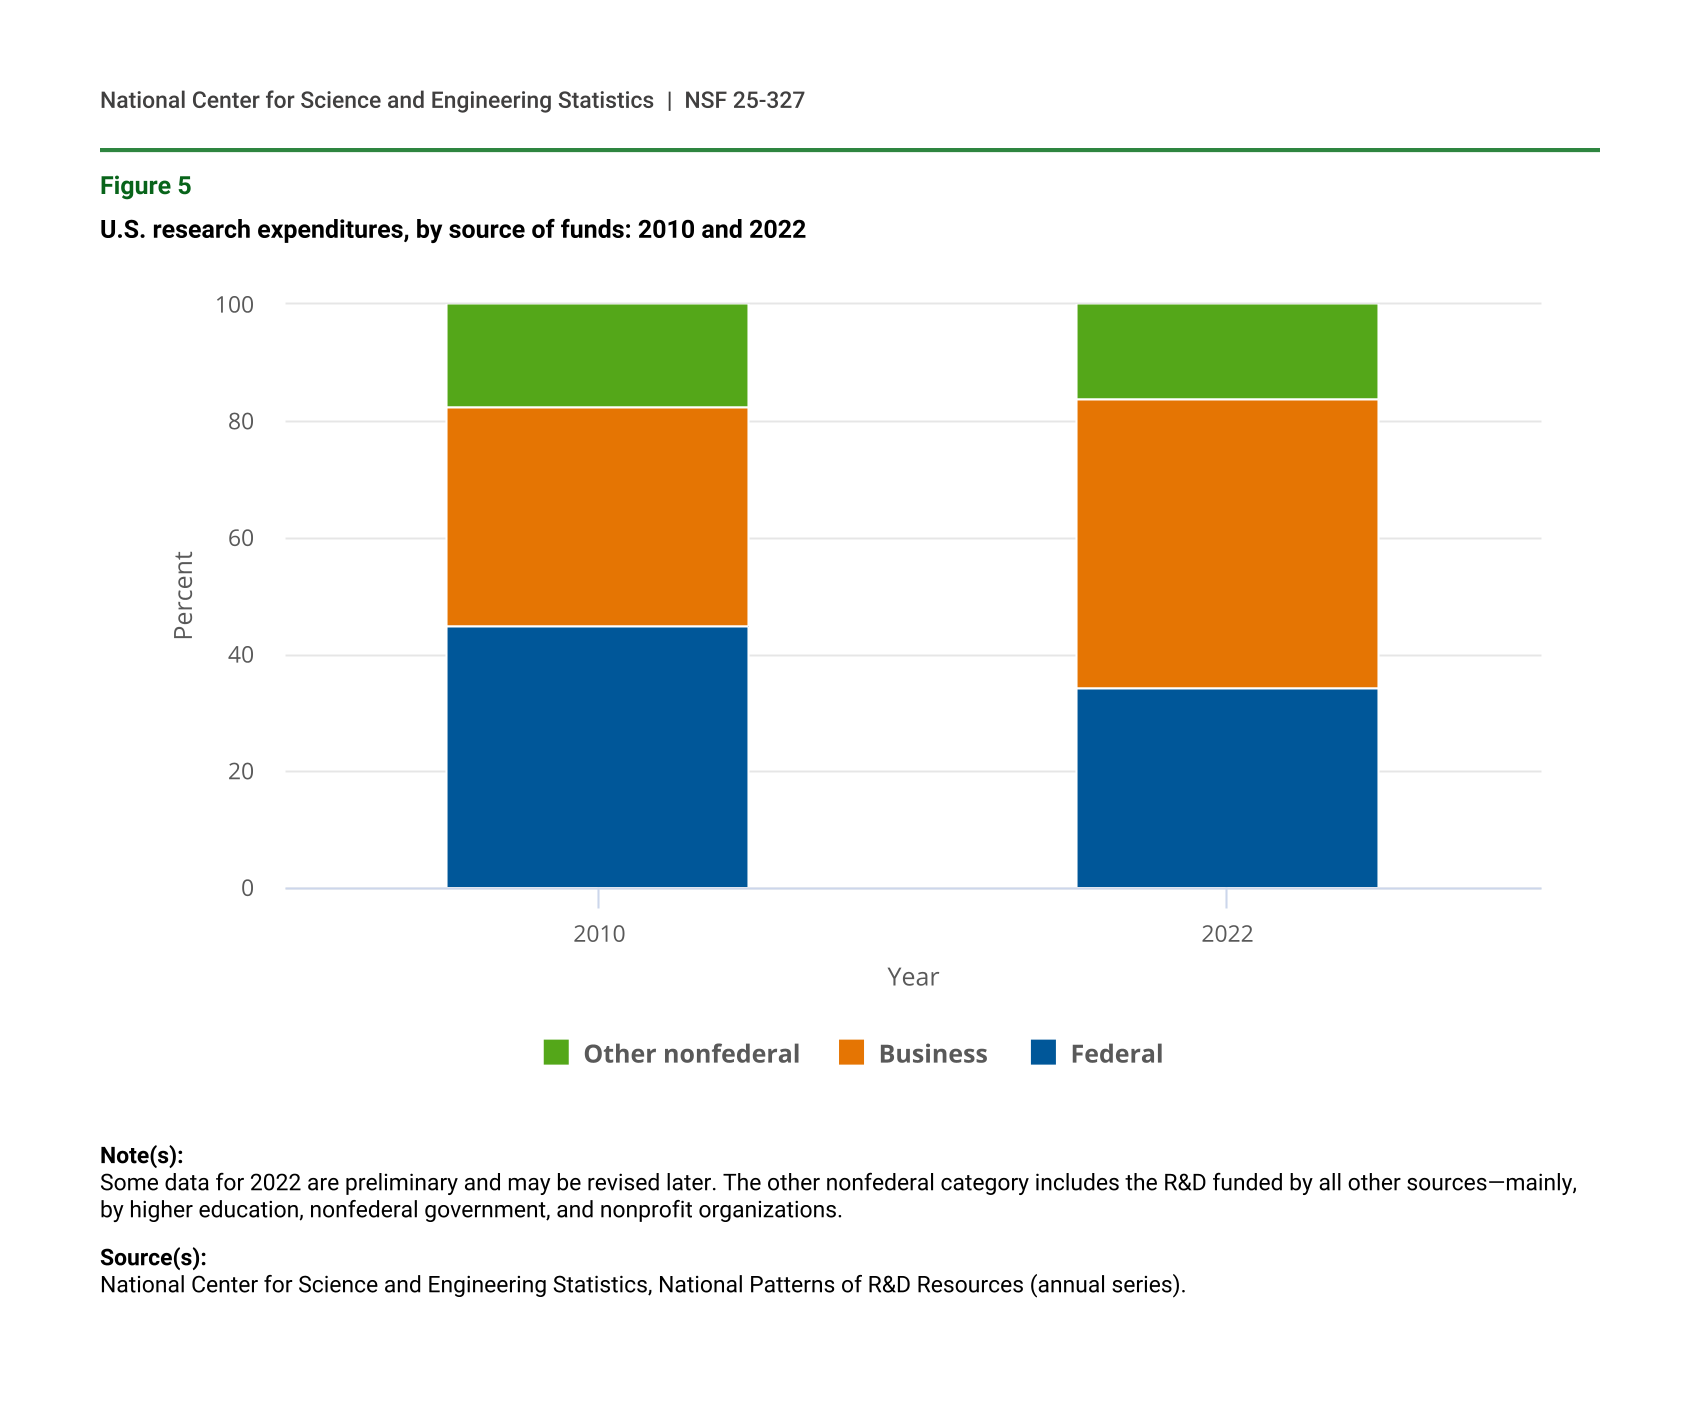
Business R&D expenditures funded 50% of total U.S. research (basic and applied research combined) in 2022, up from 38% in 2010 (figure 5, table 5). Over the same period, the federally funded share of U.S. total research declined from 45% in 2010 to 34% in 2022. Comparably, the federally funded share of basic research fell from 52% in 2010 to 41% in 2022.
U.S. research expenditures, by source of funds: 2010 and 2022
| Year | Federal | Business | Other nonfederal |
|---|---|---|---|
| 2010 | 44.9 | 37.7 | 17.4 |
| 2022 | 34.3 | 49.8 | 15.9 |
Note(s):
Some data for 2022 are preliminary and may be revised later. The other nonfederal category includes the R&D funded by all other sources—mainly, by higher education, nonfederal government, and nonprofit organizations.
Source(s):
National Center for Science and Engineering Statistics, National Patterns of R&D Resources (annual series).
Business Sector R&D Personnel
Within the business sector, large companies (250 or more employees) employed over 80% of domestic business sector R&D personnel (table 6). In 2022, the R&D employment headcount for microbusinesses (companies with fewer than 10 employees) that performed or funded R&D totaled 36,000 employees, or 2% of the total R&D employment among businesses. Companies with 25,000 or more employees accounted for over a quarter of R&D employment headcount (30%, or 636,000 of the total 2.1 million business sector R&D employees). The same pattern holds for R&D full-time equivalent (FTE) employment, with microbusinesses’ R&D FTE employment accounting for 1% of the business sector total, and businesses with 25,000 or more employees accounting for 31%. Conversely, both R&D employment intensity and R&D sales intensity are higher among smaller businesses that perform or fund R&D. R&D-active microbusinesses report a 62% R&D employment intensity and a 42% R&D sales intensity; the largest businesses (25,000 or more employees) report a 5% R&D employment intensity and 5% R&D sales intensity.
Domestic employment, R&D employment, and R&D sales intensity for companies that performed or funded business R&D in the United States, by selected industry and company size: 2022
NAICS = North American Industry Classification System.
Note(s):
Detail may not add to total because of rounding. Industry classification is based on the dominant business code for domestic R&D performance, where available. For companies that did not report business codes, the classification used for sampling was assigned. Statistics are representative of companies located in the United States that performed or funded R&D. Only selected (NAICS 42, 51, 5413, 5415, 5417) nonmanufacturing sectors are sampled for the 1–9 employee population in the Annual Business Survey. Based on prior survey results, businesses with 1–9 employees in other nonmanufacturing subsectors are not believed to perform substantial amounts of R&D.
Source(s):
National Center for Science and Engineering Statistics and Census Bureau, Business Enterprise Research and Development Survey, 2022; National Center for Science and Engineering Statistics and Census Bureau, 2023 Annual Business Survey: Data Year 2022.
Among businesses that perform or fund R&D, 53% of the R&D personnel, measured on either a headcount or FTE basis, are employed within nonmanufacturing industries. R&D employment intensity, though, was lower among nonmanufacturing industries (8%) than manufacturing industries (10%). Within nonmanufacturing industries, scientific research and development services (NAICS 5417) reported a notable R&D employment intensity (38%) and R&D sales intensity (30%). Within manufacturing industries, the semiconductor and other electronic components industry group (NAICS 3344) reported high R&D employment intensity (30%) and R&D sales intensity (24%).
Data Sources, Limitations, and Availability
The statistics on U.S. R&D presented in this report derive mainly from integrating the data on R&D expenditures and funding collected by NCSES’s annual national surveys of the organizations that perform and fund the vast majority of U.S. R&D. These surveys cover each of four sectors of the economy: higher education, government, business enterprise, and nonprofit organizations. In some cases, the primary data from these surveys are adjusted to enable consistent integration of the statistics across these separately conducted surveys. The 2023 business R&D data is based on respondents’ projected R&D costs reported on the 2022 BERD Survey, preliminary information from the 2023 BERD Survey, and trends for business R&D performance. Every survey year some of the variation in BERD estimates is due to changes in individual respondent reporting practices. During the 2023 BERD data collection some respondents revised their reporting practices and eliminated expenditures that did not meet the definition of R&D. This has resulted in a meaningful decrease in estimated U.S. R&D performance compared to the amount of 2023 R&D performance that would have been estimated based on respondent reporting practices used in 2022 and earlier. The estimated 2023 business R&D expenditures reported here are adjusted to this lower and more accurate R&D expenditure amount. This change has affected the comparability of these estimates to 2022 and earlier years. This 2023 estimate will be revised when actual R&D costs are collected in the subsequent survey year. In addition, preliminary or otherwise estimated values may be used where final data from one or more of the surveys are not yet available but can reasonably be estimated. Estimates in this InfoBrief are based on census and sample survey data that are subject to nonsampling error. Sample-survey–based estimates are also subject to sampling error. All comparative statements in this InfoBrief have undergone statistical testing and are significant at the 90% confidence level except statements reliant on modeled estimates.
The R&D surveys include NCSES’s annual surveys of business R&D (the BERD Survey for 2019–22, the preceding Business Research and Development Survey for 2017–18, the Business R&D and Innovation Survey for 2008–16, and the Survey of Industrial R&D for 2007 and earlier years). In addition, the business R&D totals include R&D expenditures reported by “micro” companies (defined as companies with fewer than 10 employees) through NCSES surveys fielded for 2016 and forward (the 2016 Business R&D and Innovation Survey—Microbusiness and the Annual Business Survey [ABS] since 2017). Other NCSES survey data sources are the Higher Education Research and Development Survey (for FYs 2010–22), the preceding Survey of R&D Expenditures at Universities and Colleges (FY 2009 and earlier years), the Survey of Federal Funds for Research and Development (FYs 2023–24 and earlier years), and the FFRDC Research and Development Survey (FY 2023 and earlier years). Amounts for the R&D performed by nonprofit organizations with funding from the nonprofit sector and from business sources are estimated based on data and parameters from the FYs 2020–22 Nonprofit Research Activities (NPRA) modules of the ABS, the 2016 NPRA Survey, and the 1996–97 Survey of R&D Funding and Performance by Nonprofit Organizations.
A full set of detailed statistical tables and methodology information for the National Patterns data are available at https://ncses.nsf.gov/data-collections/national-patterns/2022-2023. For further information and questions, contact NCSES.
NCSES has reviewed this product for unauthorized disclosure of confidential information and approved its release (NCSES-DRN25-009).
Notes
1Research and experimental development (R&D) comprises creative and systematic work undertaken in order to increase the stock of knowledge—including knowledge of humankind, culture, and society—and to devise new applications of available knowledge. Basic research is experimental or theoretical work undertaken primarily to acquire new knowledge of the underlying foundations of phenomena and observable facts, without any particular application or use in view. Applied research is original investigation undertaken in order to acquire new knowledge; directed primarily toward a specific, practical aim or objective. Experimental development is systematic work, drawing on knowledge gained from research and practical experience and producing additional knowledge, which is directed to producing new products or processes or to improving existing products or processes. See Organisation for Economic Co-operation and Development (OECD). 2015. Frascati Manual 2015: Guidelines for Collecting and Reporting Data on Research and Experimental Development. The Measurement of Scientific, Technological and Innovation Activities, OECD Publishing: Paris. Available at https://doi.org/10.1787/9789264239012-en.
2Estimated 2023 R&D performance is based in part on 2023 projected R&D reported on the 2022 Business Enterprise Research and Development (BERD) Survey, preliminary information from the 2023 BERD Survey, and trends for business R&D performance. Every survey year some of the variation in BERD estimates is due to changes in individual respondent reporting practices. During the 2023 BERD data collection some respondents revised their reporting practices and eliminated expenditures that did not meet the BERD definition of R&D. This has resulted in a meaningful decrease in estimated U.S. R&D performance compared to the amount of 2023 R&D performance that would have been estimated based on respondent reporting practices used in 2022 and earlier. The estimated 2023 business R&D expenditures reported here are adjusted to this lower and more accurate R&D expenditure amount. This change has affected the comparability of these estimates to 2022 and earlier years.
3Myers K. and Lanahan L. 2022. Estimating Spillovers from Publicly Funded R&D: Evidence from the U.S. Department of Energy. American Economic Review 112 (7): 2393–2423.
4Arora A, Belenzon S, and Sheer L. 2021. Knowledge Spillovers and Corporate Investment in Scientific Research. American Economic Review, 111 (3): 871–898.
Mezzanotti F and Simcoe T; National Bureau of Economic Research. 2023. Research and/or Development? Financial Frictions and Innovation Investment. Working Paper No. 31521.
Arora A, Belenzon S, Ferracuti E, and Nagar J; National Bureau of Economic Research. 2024. Revisiting the Private Value of Scientific Inventions. Working Paper No. 33056.
5Pierre Azoulay P, Graff Zivin J, Li D, and Sampat B. 2019. Public R&D Investments and Private-sector Patenting: Evidence from NIH Funding Rules. Review of Economic Studies 86, 117–152 https://doi.org/10.1093/restud/rdy034.
Myers K and Lanahan L. 2022. Estimating Spillovers from Publicly Funded R&D: Evidence from the U.S. Department of Energy. American Economic Review 112 (7): 2393–2423 https://www.aeaweb.org/articles?id=10.1257/aer.20210678.
Dyevre A. 2024. Public R&D and Productivity Growth, London School of Economics, unpublished manuscript. https://www.ecb.europa.eu/press/conferences/ecbforum/shared/pdf/2024/EFCB_2024_Dyevre_paper.en.pdf.
6See Organisation for Economic Co-operation and Development (OECD). 2015. Frascati Manual 2015: Guidelines for Collecting and Reporting Data on Research and Experimental Development. The Measurement of Scientific, Technological and Innovation Activities, OECD Publishing: Paris. Available at https://doi.org/10.1787/9789264239012-en and discussed above.
7This change has affected the comparability of 2023 estimates to those published for 2022 and earlier years, which are based on less accurate reporting practices.
8All growth rate calculations are reported using compound annual growth rates unless otherwise noted.
9Organisation for Economic Co-operation and Development (OECD), Ministry of Economic Affairs and Employment of Finland, and VTT Technical Research Centre of Finland. 2021. R&D Intensity as a Policy Target: Main Takeaways from 11 International Case Studies. Available at https://www.vttresearch.com/sites/default/files/2021-05/OECD-TIP-RD-intensity-case-studies-synthesis-report.pdf.
Rakic R et al. 2021. Fostering R&D Intensity in the European Union: Policy Experiences and Lessons Learned. Case study contribution to the OECD TIP project on R&D intensity. Available at https://research-and-innovation.ec.europa.eu/document/download/a94f8cf5-bb20-4f75-bbca-592d151ad6d1_en?filename=ec_rtd_oecd-tip-rd-case-study.pdf.
10Due to sample variability in the data for the business R&D component, the calculated R&D-to-GDP ratios for 1964, 2009, and 2017 are not significantly different from one another at a 90% confidence level. Additionally, non-U.S. R&D-to-GDP ratios are adjusted for net R&D capital accumulation.
11See Organisation for Economic Co-operation and Development, OECD Main Science and Technology Indicators Database, September 2023. Available at https://www.oecd.org/sti/msti.htm.
12The data on higher education R&D reported by National Patterns differ from the underlying survey data in several respects. First, National Patterns translates the Higher Education R&D (HERD) Survey’s primary data in academic fiscal years to calendar year equivalents. Second, National Patterns reports higher education R&D expenditures that are adjusted to remove the double-counting of pass-through funding included in HERD Survey source data. For further details on this topic, see “Technical Notes” at https://ncses.nsf.gov/data-collections/national-patterns/2022-2023#technical-notes.
13The most recent data on nonprofit organization R&D come from the FY 2022 Nonprofit Research Activities (NPRA) module of the Annual Business Survey and the 2016 NPRA Survey. Data for nonprofit organization R&D, 2017–19 are estimated based on the 2016 and 2020 data as revised in the 2022 survey. The availability of NPRA data allowed for improved measurement of nonprofit R&D performance over the 2017–22 period, resulting in minor changes to previously published estimates. For 1998–2015, data for nonprofit organization R&D funded by the federal government come from the NCSES annual Survey of Federal Funds for Research and Development; data for that funded by businesses and by the nonprofit sector itself are estimated, based on parameters from the 1996–97 Survey of Research and Development Funding and Performance by Nonprofit Organizations.
14See the full set of National Patterns data tables: table 3.
15Estimates of the type of R&D by source of funding are based on survey responses for federal funding by type of R&D and modeled using nonfederal funding sources of total R&D and the total nonfederally funded R&D by type. Because of this estimation procedure, comparisons of R&D type by funding source are not supported by statistical testing. National Patterns of R&D uses the general term “estimates” to describe survey estimates, modeled estimates, and projections. Results that combine these techniques are also called estimates because survey estimates are their major component.
16Arora A, Belenzon S, and Sheer L. 2021. Knowledge Spillovers and Corporate Investment in Scientific Research. American Economic Review, 111 (3): 871–898.
Mezzanotti F and Simcoe T; National Bureau of Economic Research. 2023. Research and/or Development? Financial Frictions and Innovation Investment. Working Paper No. 31521.
Arora A, Belenzon S, Ferracuti E, and Nagar J; National Bureau of Economic Research. 2024. Revisiting the Private Value of Scientific Inventions. Working Paper No. 33056.
17Pierre Azoulay P, Graff Zivin J, Li D, and Sampat B. 2019. Public R&D Investments and Private-sector Patenting: Evidence from NIH Funding Rules. Review of Economic Studies 86, 117–152.
Myers K and Lanahan L. 2022. Estimating Spillovers from Publicly Funded R&D: Evidence from the US Department of Energy. American Economic Review 112 (7): 2393–2423.
Dyevre A. 2024. Public R&D and Productivity Growth, London School of Economics, unpublished manuscript.
18For further details on the correspondence between sectors used to measure R&D and those used in the System of National Accounts, please see the Frascati Manual 2015: Guidelines for Collecting and Reporting Data on Research and Experimental Development (https://doi.org/10.1787/9789264239012-en).
19Estimates from the NCSES business and nonprofit organization R&D surveys mentioned are all derived from sample data and thereby contain sampling error. Consequently, estimates of total U.S. R&D also contain sampling error. For more information on this topic and other surveys used in the National Patterns tabulations, see the “Technical Notes” at https://ncses.nsf.gov/data-collections/national-patterns/2022-2023#technical-notes.
Suggested Citation
National Center for Science and Engineering Statistics (NCSES). 2025. U.S. R&D Totaled $892 Billion in 2022; Estimate for 2023 Indicates Further Increase to $940 Billion. NSF 25-327. Alexandria, VA: U.S. National Science Foundation. Available at https://ncses.nsf.gov/pubs/nsf25327/.
Contact Us
National Center for Science and Engineering Statistics
Directorate for Social, Behavioral and Economic Sciences
U.S. National Science Foundation
2415 Eisenhower Avenue, Suite W14200
Alexandria, VA 22314
Tel: (703) 292-8780
FIRS: (800) 877-8339
TDD: (800) 281-8749
E-mail: ncsesweb@nsf.gov
NSF 25-327
|February 27, 2025