 An official website of the United States government

The College-Graduate Workforce in the Transition to a Post-Pandemic Labor Market: Trends in Employment, Professional Engagement, and Work Arrangements
The number of college graduates living in the United States reached 71.7 million in 2023, of which 70.9 million had ever held a job, with 56.1 million employed and 14.9 million not employed. The number of employed college graduates increased by 4.3 million (8.3%) between 2021 and 2023, and the number of college graduates not working decreased by 1.3 million (7.9%). This growth in employment and decline in nonemployment coincided with the end of the COVID-19 pandemic and underlies a series of developments in the college-graduate labor market.
This InfoBrief presents a comparison of selected labor market outcomes between the 2021 and 2023 cycles of the National Survey of College Graduates (NSCG). In addition to collecting basic information on labor force status and earnings, the NSCG collects detailed information on reasons for not working, participation in professional activities, work arrangements, and measures of job satisfaction. The 2023 cycle of the NSCG continued collecting telework-related items that were included in the 2021 survey, allowing a comparison of telework incidence during and in the aftermath of the pandemic. Where possible, the comparisons extend prior to 2021 to allow the examination of whether current labor market experiences of college graduates resemble pre-pandemic conditions or whether different experiences were emerging at the end of the pandemic.
Labor Force Status
Table 1 presents labor force status information for the U.S.-residing college-educated population, disaggregated by broad occupation and racial-ethnic groups. Roughly 56.1 million, or 79.0% of the nation’s college graduates, were employed. Among the employed, 47.4 million (84.5%) worked full time (i.e., worked 35 or more hours per week). The remaining 15.5%, or 8.7 million workers, worked on a part-time basis. Among broad occupations, the proportion working full time varied. In 2023, 77.7% of individuals employed in science and engineering (S&E) occupations worked full time, compared with 67.5% of individuals in S&E-related occupations and 64.1% of individuals in non-S&E occupations. Among racial-ethnic groups, Hispanic individuals had among the highest proportion working full time at 72.2%, whereas White individuals had among the lowest proportion working full-time at 64.7%.
Labor force status of college graduates, by broad occupation, race, and ethnicity: 2023
S = suppressed for reliability; coefficient of variation exceeds publication standards of 50%.
AIAN = American Indian or Alaska Native; NHPI = Native Hawaiian or Other Pacific Islander; S&E = science and engineering.
a Hispanic or Latino may be any race; race categories exclude Hispanic origin.
b Approximately 753,000 college graduates who never worked are excluded from this table.
c Respondents were asked to select from a list of possible reasons to explain their part-time or not employed status and could select multiple reasons.
Note(s):
Numbers are rounded to the nearest 1,000. Detail may not add to total because of rounding. Full-time employment is at least 35 hours per week; part-time employment is less than 35 hours per week. Not in the labor force are those who are not currently employed, who have not recently been laid off, and who are not actively searching for work. Unemployed are those who are currently not employed and who have actively searched for work in the past 4 weeks or were recently laid off from a job.
Source(s):
National Center for Science and Engineering Statistics, National Survey of College Graduates.
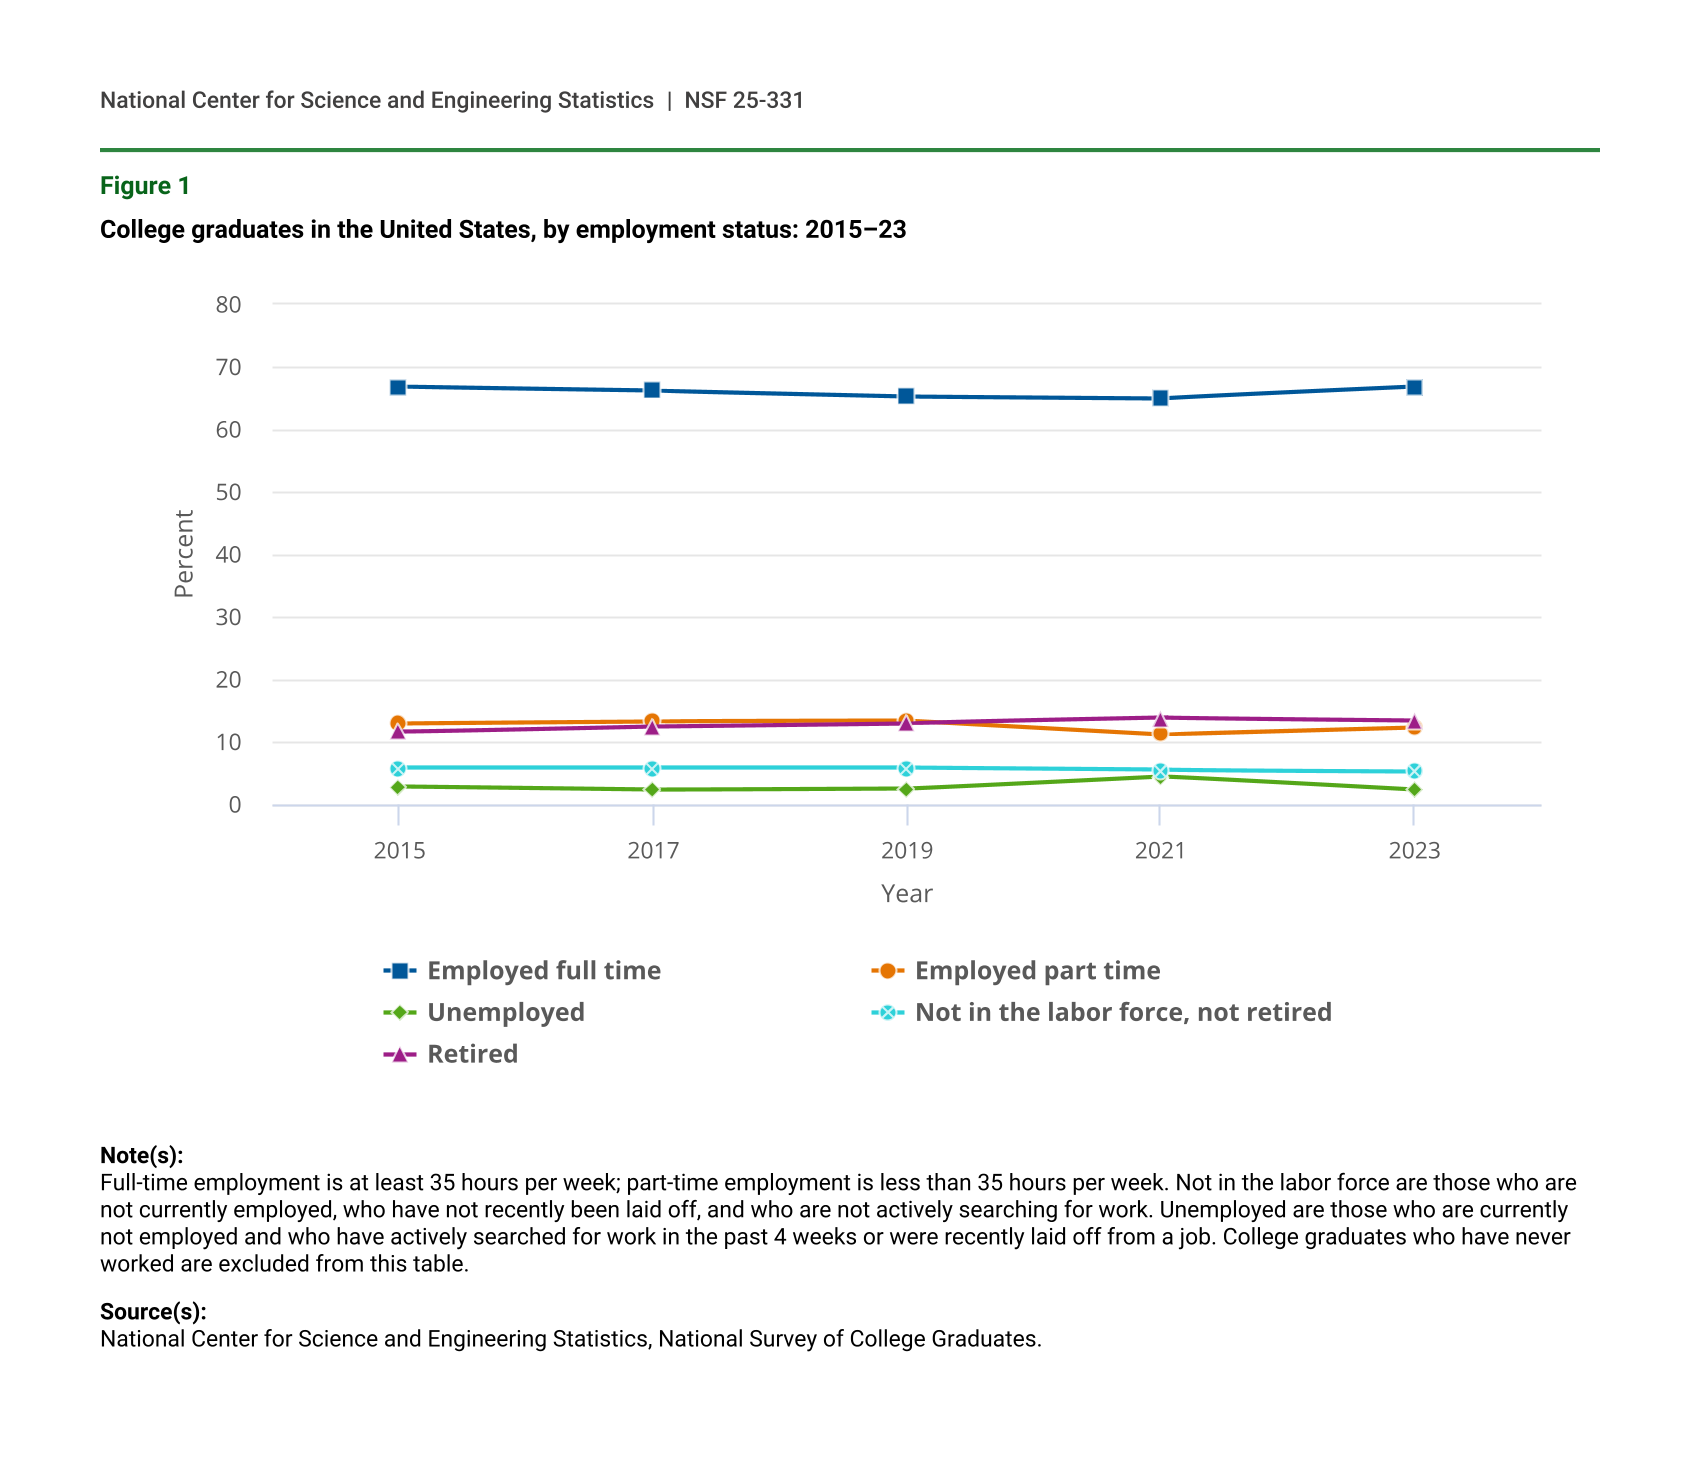
Figure 1 places these numbers in perspective by reporting trends in labor force statuses for the U.S.-residing college-educated population from 2015 to 2023. The share of this population employed full time had trended downward from 2015 to 2021, but it then saw a 1.8 percentage point increase from 2021 to 2023. Overall, there was no significant difference in the share of the population working full time in 2015 and 2023 (both at 66.8%). The share working part time experienced an increase from 2021 to 2023, from 11.2% to 12.3%. However, the part-time share remained lower than it was pre-pandemic (i.e., it was 1.0 percentage point lower in 2023 than it was in 2017). Accompanying these increases in labor market activity was a decline in unemployment, from 4.5% in 2021 to 2.3% in 2023—roughly a halving. This 2.3% unemployment rate in 2023 was not significantly different from the unemployment rate in 2017, serving as an indication that unemployment for the nation’s college-educated population has recovered to pre-pandemic levels. In addition, although the share of retirees trended upward from 2015 to 2021, there was no significant difference from 2021 to 2023. The retired share remained slightly elevated in 2023 relative to pre-pandemic levels: a possible consequence of population aging.
College graduates in the United States, by employment status: 2015–23
| Year | Employed full time | Employed part time | Unemployed | Not in the labor force, not retired | Retired |
|---|---|---|---|---|---|
| 2015 | 66.8 | 13.0 | 2.8 | 5.8 | 11.6 |
| 2017 | 66.2 | 13.3 | 2.3 | 5.8 | 12.5 |
| 2019 | 65.3 | 13.4 | 2.5 | 5.8 | 13.0 |
| 2021 | 65.0 | 11.2 | 4.5 | 5.5 | 13.8 |
| 2023 | 66.8 | 12.3 | 2.3 | 5.3 | 13.4 |
Note(s):
Full-time employment is at least 35 hours per week; part-time employment is less than 35 hours per week. Not in the labor force are those who are not currently employed, who have not recently been laid off, and who are not actively searching for work. Unemployed are those who are currently not employed and who have actively searched for work in the past 4 weeks or were recently laid off from a job. College graduates who have never worked are excluded from this table.
Source(s):
National Center for Science and Engineering Statistics, National Survey of College Graduates.
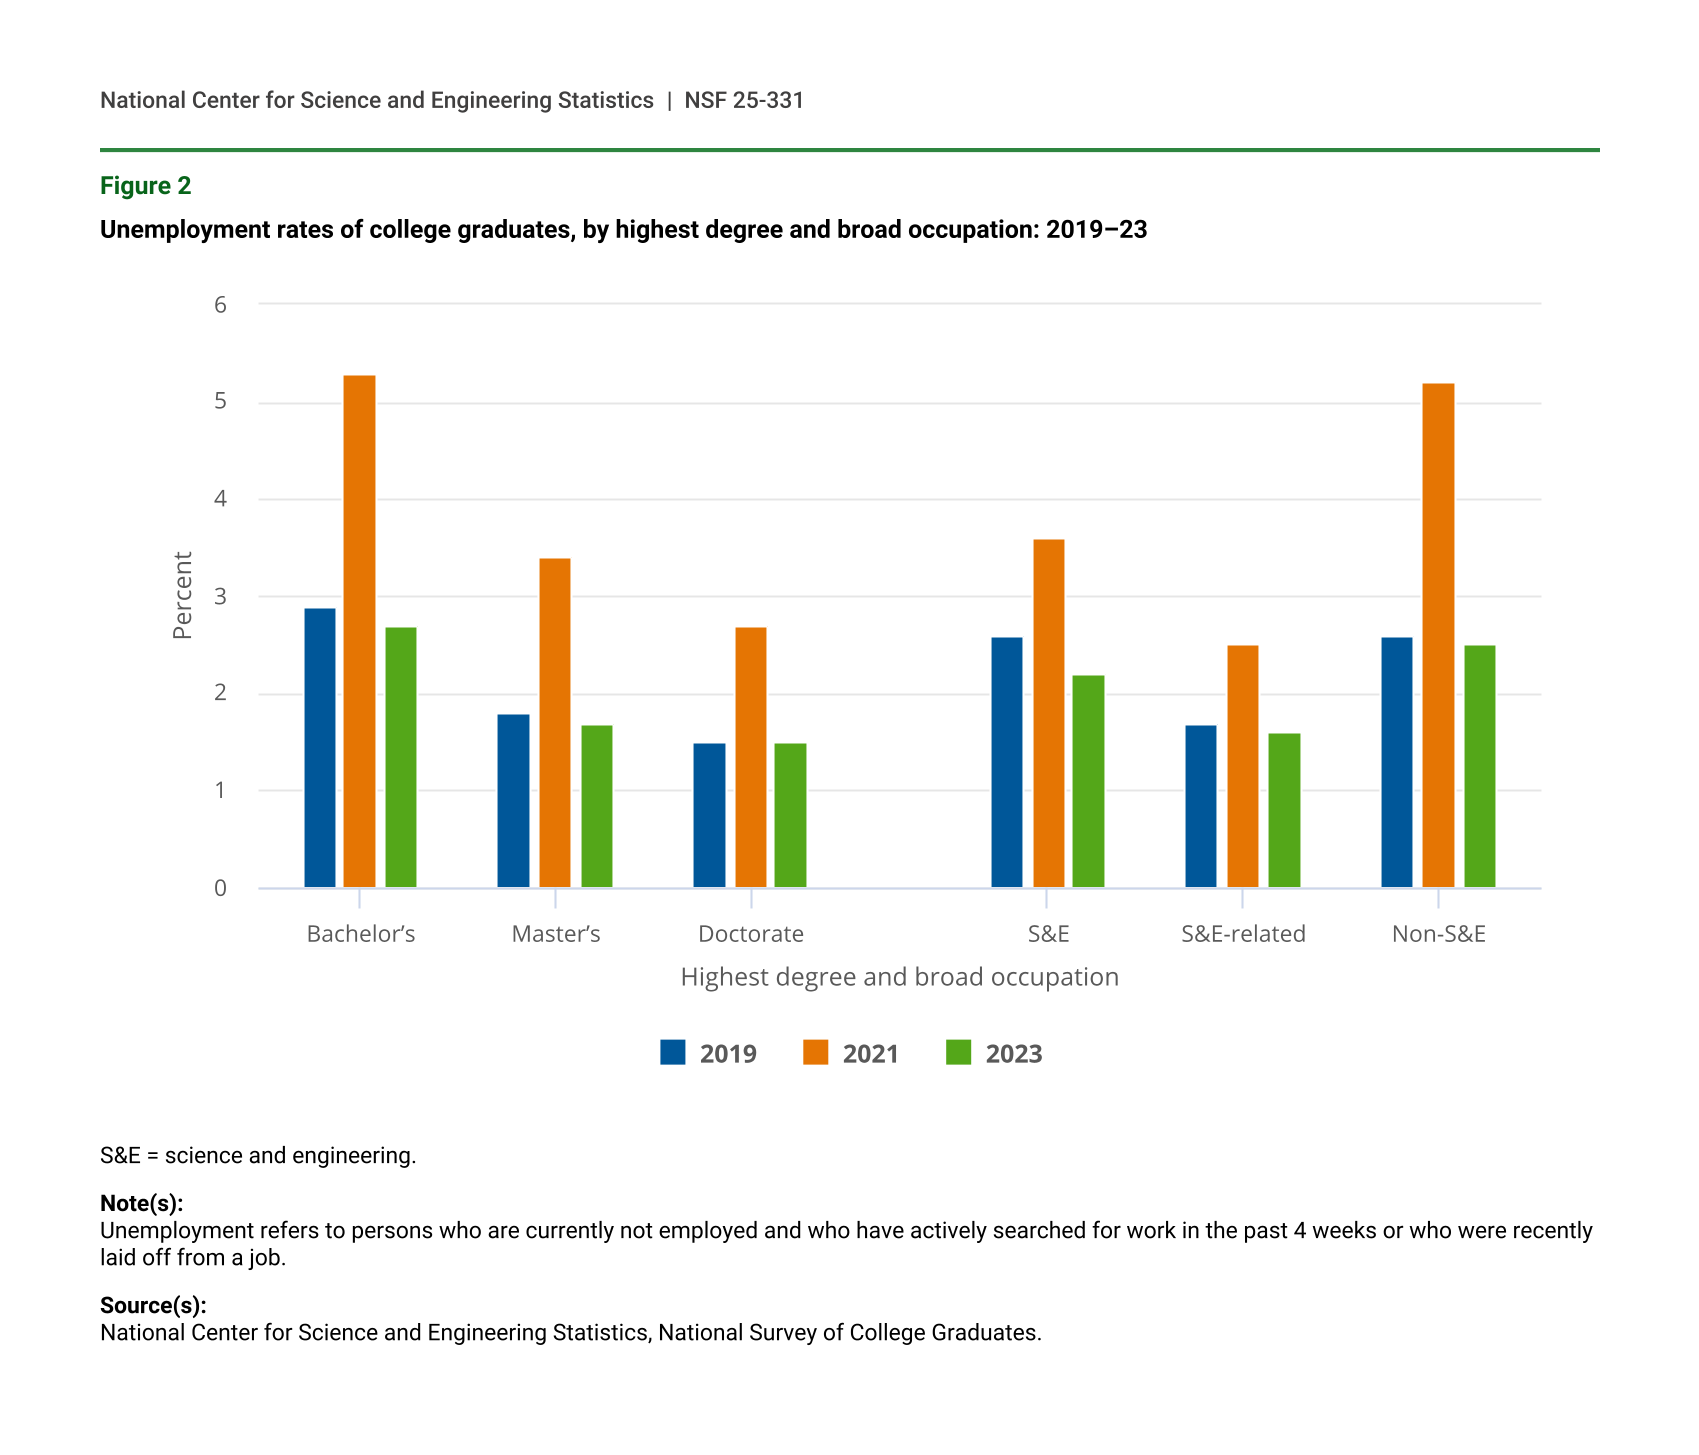
Figure 2 focuses on 2019–23 changes in unemployment, reporting these numbers across degree levels and broad occupations. Those with a bachelor’s degree and no further degree experienced a 2.6 percentage point decline in unemployment between 2021 and 2023, and non-S&E workers experienced a 2.7 percentage point decline. On the other hand, doctorate holders experienced a 1.1 percentage point decline in unemployment, and S&E-related workers experienced a 0.9 percentage point decline. All groups, however, had a lower or statistically unchanged unemployment rate in 2023 as compared with 2019.
Unemployment rates of college graduates, by highest degree and broad occupation: 2019–23
| Highest degree and broad occupation | 2019 | 2021 | 2023 |
|---|---|---|---|
| Bachelor’s | 2.9 | 5.3 | 2.7 |
| Master’s | 1.8 | 3.4 | 1.7 |
| Doctorate | 1.5 | 2.7 | 1.5 |
| S&E | 2.6 | 3.6 | 2.2 |
| S&E-related | 1.7 | 2.5 | 1.6 |
| Non-S&E | 2.6 | 5.2 | 2.5 |
S&E = science and engineering.
Note(s):
Unemployment refers to persons who are currently not employed and who have actively searched for work in the past 4 weeks or who were recently laid off from a job.
Source(s):
National Center for Science and Engineering Statistics, National Survey of College Graduates.
In addition to employment status, table 1 reports the incidence of telecommute and remote work arrangements among those employed during the reference week of 1 February 2023. In this InfoBrief, the term telework is used to represent the set of telecommute and remote work arrangements. Approximately 48.0% of employed college graduates teleworked to some extent, with 61.5% of those individuals (or 29.5% of all workers) teleworking consistently at least 3 days per week. A larger percentage of full-time workers than part-time workers engaged in some form of telework (49.5% versus 39.6%). Among broad occupations, 72.4% of S&E workers teleworked, higher than the percentage of S&E-related workers and non-S&E workers (31.3% and 47.3%, respectively). Among racial-ethnic groups, Asian individuals had the highest telework rate at 56.3%, whereas White individuals had among the lowest telework rates at 46.4%.
Professional Engagement
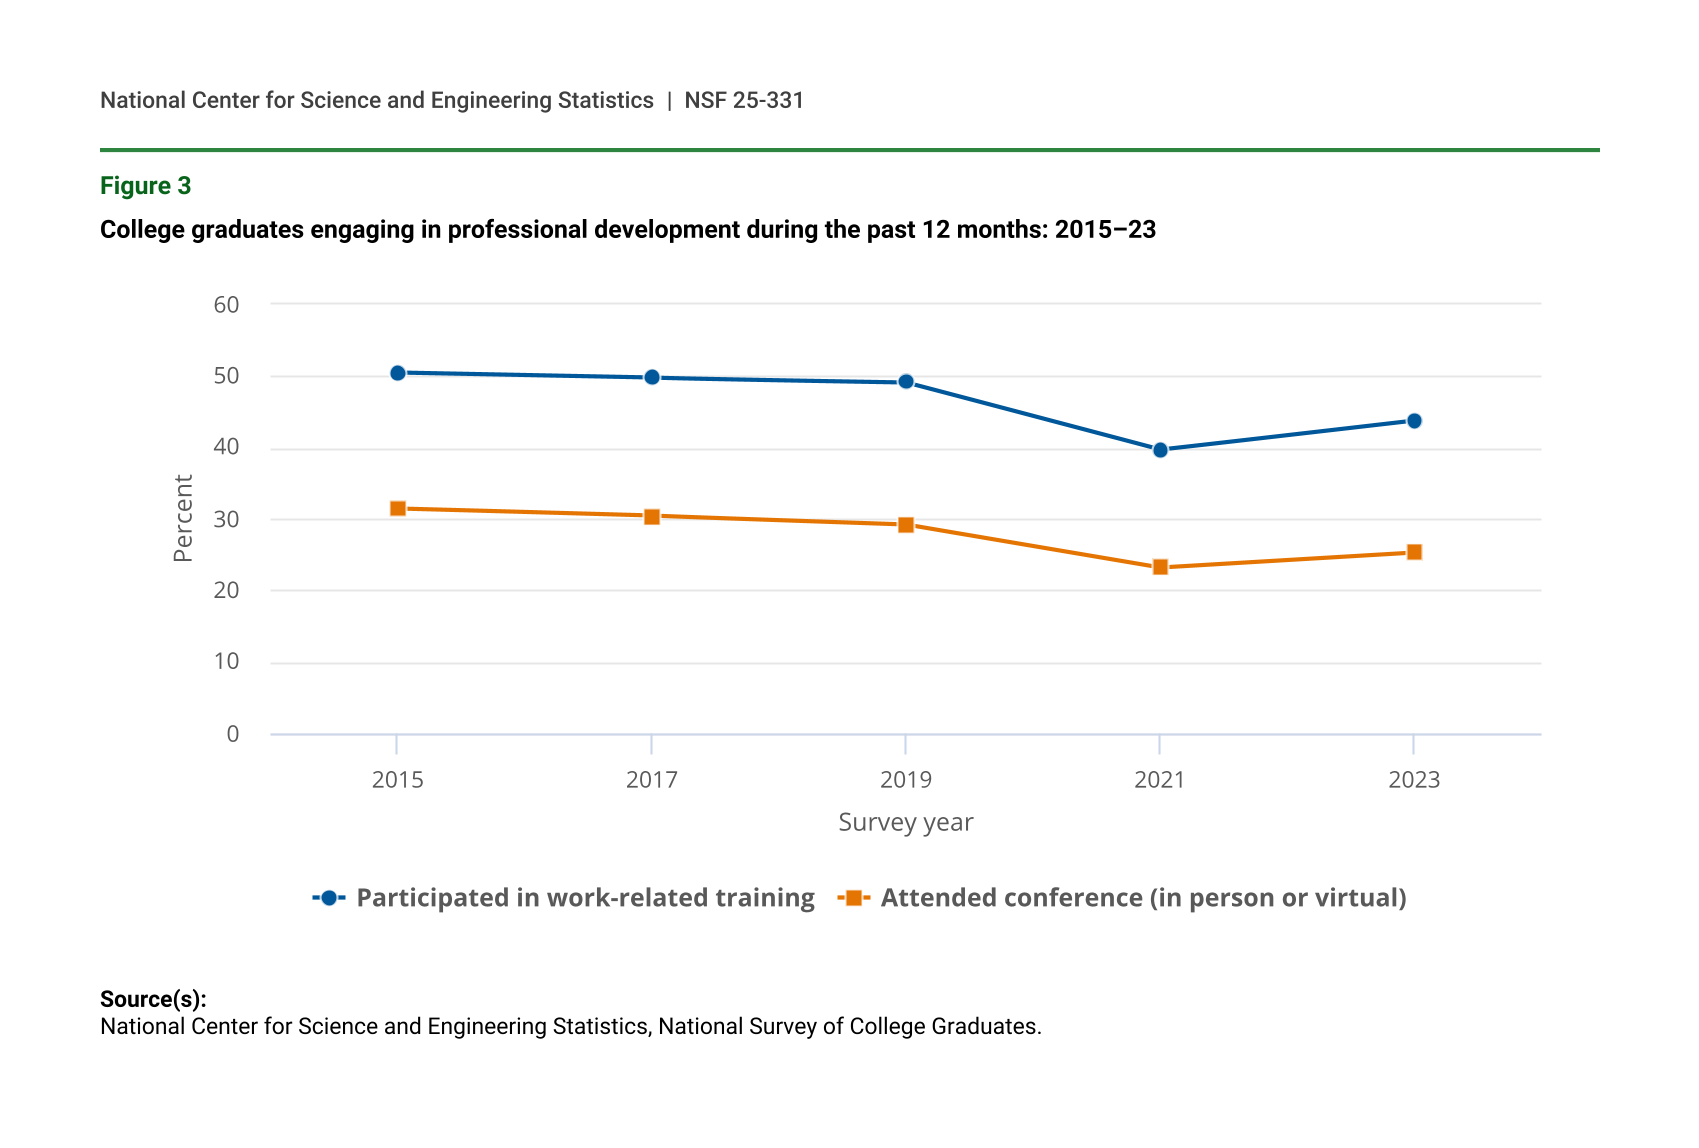
For those employed during the reference week, the NSCG elicits measures of professional engagement, such as participating in work-related training or attending conferences during the prior 12 months (figure 3). In 2021, there was a decline in professional engagement among the nation’s college-educated population during the pandemic. Information from 2023 allows an assessment of the recovery in these professional engagement measures near the end of the pandemic. Participation in work-related training increased by 4.1 percentage points between 2021 and 2023, whereas conference attendance increased by 2.1 percentage points. However, these measures remain below pre-pandemic levels. For example, in 2023, 25.3% of workers attended a conference during the prior 12 months, whereas in 2019, the corresponding value was 29.2%—3.9 percentage-points, or 15.6%, higher. It remains to be seen whether this is indicative of a prolonged recovery in professional engagement or the emergence of a “new normal” that features less professional engagement.
College graduates engaging in professional development during the past 12 months: 2015–23
| Survey year | Participated in work-related training | Attended conference (in person or virtual) |
|---|---|---|
| 2015 | 50.4 | 31.4 |
| 2017 | 49.7 | 30.4 |
| 2019 | 49.1 | 29.2 |
| 2021 | 39.7 | 23.2 |
| 2023 | 43.8 | 25.3 |
Source(s):
National Center for Science and Engineering Statistics, National Survey of College Graduates.
Telework
In 2021, there were noted provisions allowing or requiring employees to telecommute or to work remotely, along with other temporary leave benefits, during the pandemic, especially in S&E occupations. This section explores whether these telework arrangements reversed in 2023 or were still a feature of college-graduate jobs.
As reported in table 2, the share of all workers who were allowed or required to telework declined from approximately 67.3% in 2021 to 53.2% in 2023. This 14.1 percentage point (or 20.9%) decline is attributable to increases both in the share of employees for whom teleworking did not make sense for their job (a 5.8 percentage point increase, from 22.5% to 28.3%) and in the share of employees not allowed or required to telework (an 8.3 percentage point increase, from 10.3% to 18.5%). Declines in the availability of telework were striking in the education sector, where the share of workers who were allowed or required to telework decreased by 63.7%.
Employed college graduates, by employment sector, employer size, primary work activity, job satisfaction, and telecommute or remote work status: 2021 and 2023
a Management and administration includes respondents who reported the following work activities: accounting, finance, or contracts; human resources; quality or productivity management; sales and marketing; or managing and supervising.
b Research and development includes basic research, applied research, or development.
c Other work activities includes production, operations, maintenance, professional services, and other activities not broken out separately.
Note(s):
Numbers are rounded to the nearest 1,000. Detail may not add to total because of rounding. Education includes 4-year colleges and universities, medical schools, university-affiliated research institutes, 2-year colleges, pre-college institutions, and other educational institutions. Government includes federal (civilian), military, state, and local employers.
Source(s):
National Center for Science and Engineering Statistics, National Survey of College Graduates.
In both 2021 and 2023, the availability of telework aligned with positive job satisfaction. For example, in 2021, 71.0% of workers who reported being “very satisfied” with their job were allowed or required to telework. On the other hand, among workers who reported being “very dissatisfied” with their job, only 48.1% were allowed or required to telework. Similarly, in 2023, 57.9% of workers who reported being “very satisfied” with their job were allowed or required to telework, while the corresponding value for workers “very dissatisfied” with their job was 39.9%. However, these comparisons mask some nuance. In 2023, a response option was added to the telework question that allowed respondents to distinguish between being “required” to telework and being “allowed” to telework (and if allowed, whether they did). Among workers who reported being “very satisfied” with their job, only 6.1% of them reported being required to telework. On the other hand, 10.4% of workers who were “very dissatisfied” with their jobs reported being required to telework.
It therefore appears that having the option to telework, without being required to do so, aligns with positive job satisfaction in the post-pandemic labor market. That said, being required to telework was a rare arrangement in 2023 in that only 6.0% of all workers were required to telework. In addition, 88.9% of workers who were given the option and allowed to telework did so to some degree.
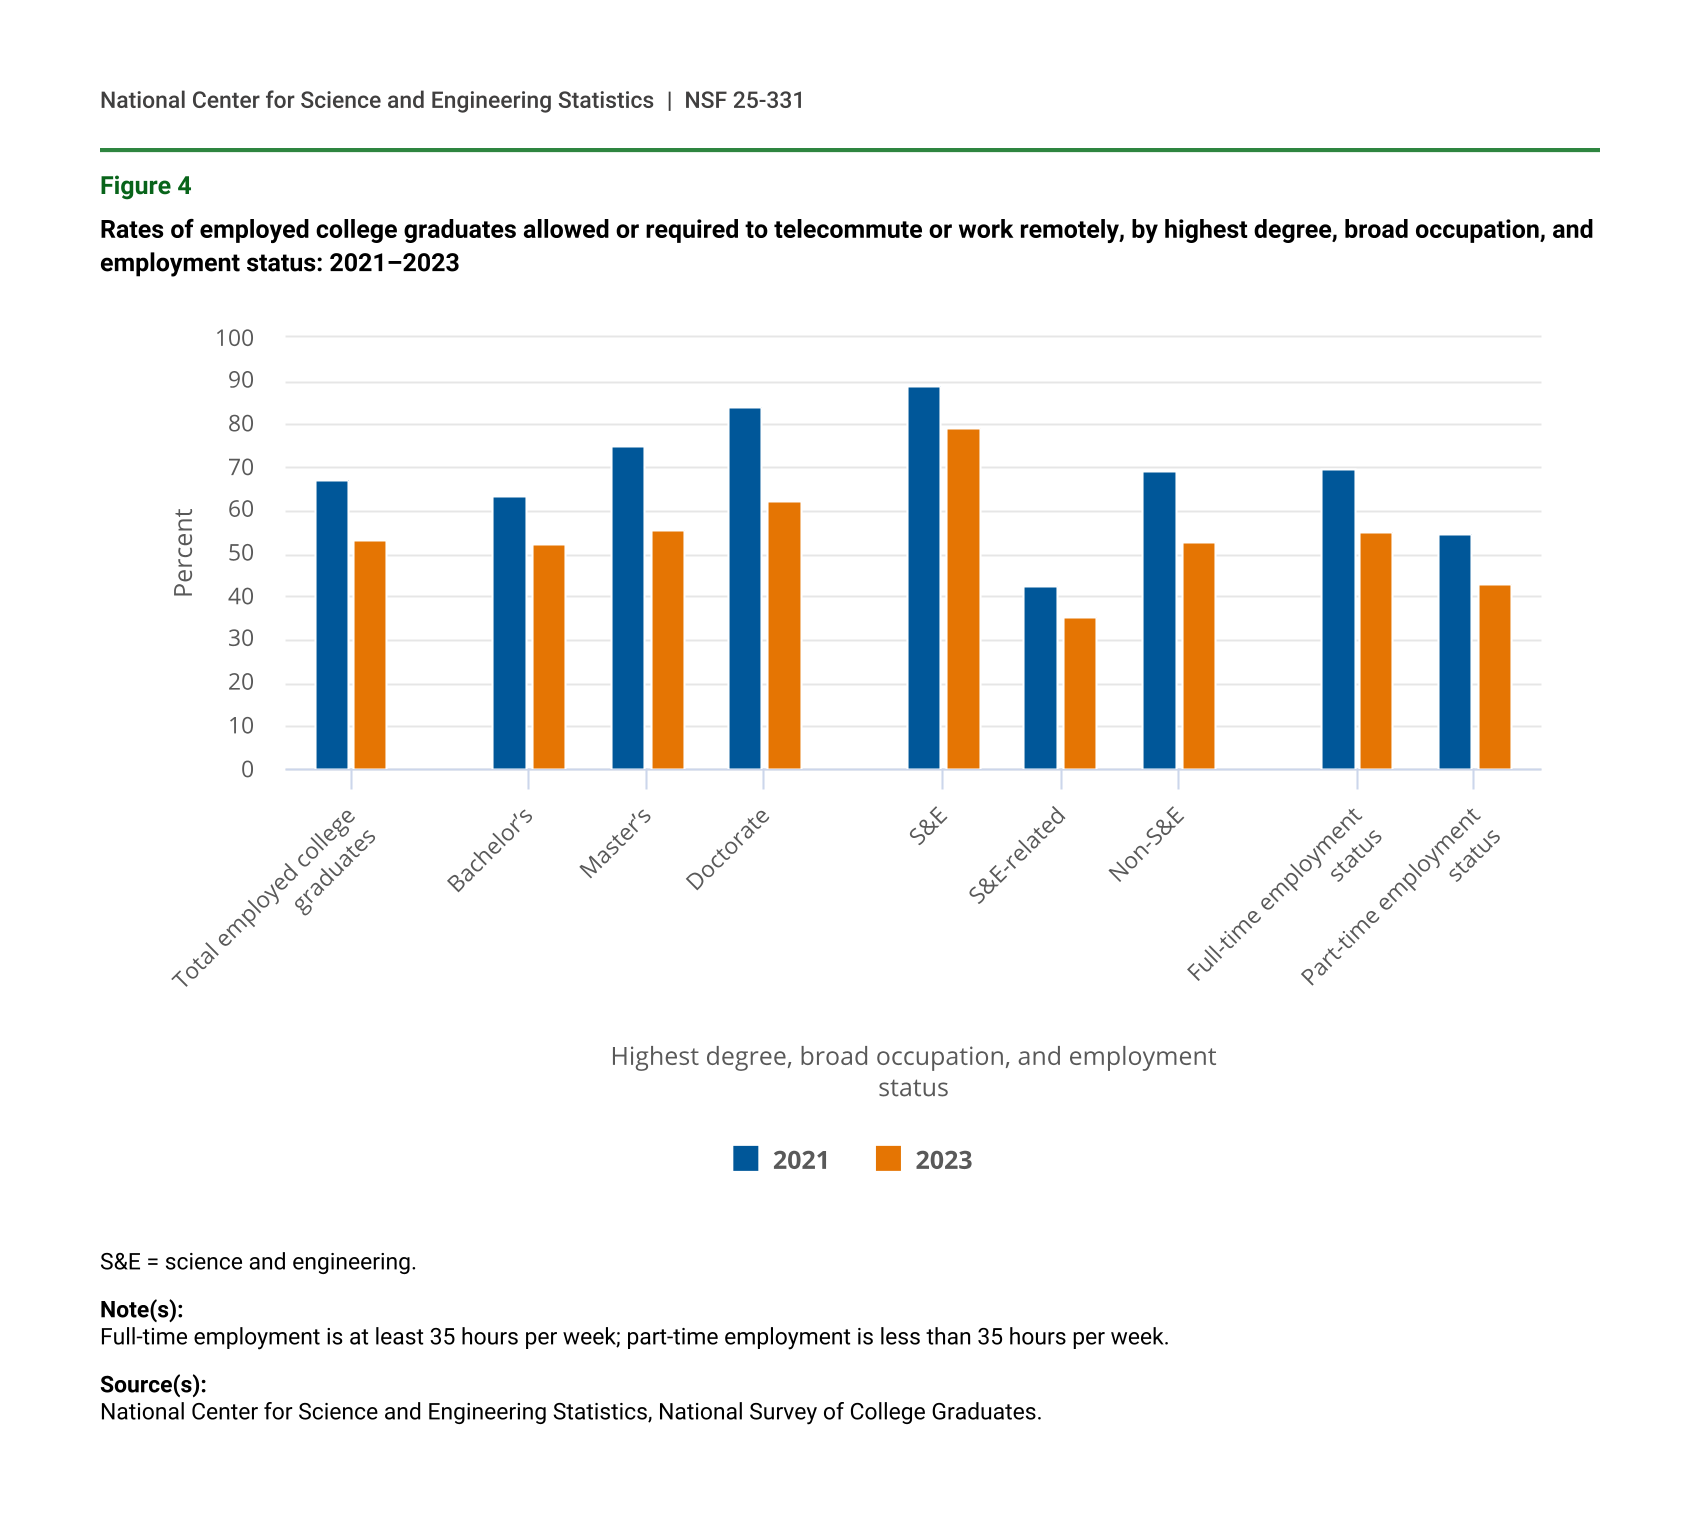
Figure 4 illustrates further time trends in telework arrangements by education and employment characteristics. The findings align with those in table 2 in revealing a decline in the incidence of telework between 2021 and 2023, regardless of degree level, broad occupation, or full-time worker status. Since the NSCG first asked about telework arrangements in 2021, it is not possible to measure whether the 2021–23 decline in telework incidence represents a return to pre-pandemic levels or whether the labor market is stabilizing around increased telework provisions.
Rates of employed college graduates allowed or required to telecommute or work remotely, by highest degree, broad occupation, and employment status: 2021–2023
| Highest degree, broad occupation, and employment status | 2021 | 2023 |
|---|---|---|
| Total employed college graduates | 67.3 | 53.2 |
| Bachelor’s | 63.5 | 52.1 |
| Master’s | 74.8 | 55.4 |
| Doctorate | 84.1 | 62.2 |
| S&E | 89.1 | 79.3 |
| S&E-related | 42.7 | 35.3 |
| Non-S&E | 69.1 | 52.5 |
| Full-time employment status | 69.4 | 55.1 |
| Part-time employment status | 54.8 | 42.9 |
S&E = science and engineering.
Note(s):
Full-time employment is at least 35 hours per week; part-time employment is less than 35 hours per week.
Source(s):
National Center for Science and Engineering Statistics, National Survey of College Graduates.
Finally, table 3 provides information about telework arrangements by detailed occupation. Occupations with a historic in-person requirement such as precollege teachers, health-related occupations, and chemists (excluding biochemists) were among the detailed occupations with the highest proportion of individuals reporting that telework “did not make sense for my job” at 54.4%, 51.0%, and 40.4%, respectively. There was also some heterogeneity across detailed occupations in workers’ choices to telework conditional on being allowed. For example, precollege teachers had low rates of telework, with only 65.1% reporting teleworking when given the option, compared with 88.9% of all employed college graduates. Overall, these findings highlight variation across detailed occupations in telework experiences.
Employed college graduates, by detailed occupation and telecommute or remote work status: 2023
S = suppressed for reliability; coefficient of variation exceeds publication standards of 50%.
S&E = science and engineering.
Note(s):
Numbers are rounded to the nearest 1,000. Detail may not add to total because of rounding.
Source(s):
National Center for Science and Engineering Statistics, National Survey of College Graduates, 2023.
Definitions and Classifications
Universe of analysis: All NSCG respondents who reported ever having worked for pay or profit.
Full-time employed: Those who were employed during the week of 1 February of the survey reference year and working at least 35 hours in a typical week on their principal job.
Part-time employed: Those who were employed during the week of 1 February of the survey reference year and working less than 35 hours in a typical week on their principal job.
Not in labor force: Those who were not employed during the week of 1 February of the survey reference year, not recently laid off, and not actively searching for work.
Unemployed: Those who were not employed during the week of 1 February of the survey reference year and who had actively searched for work in the preceding 4 weeks or were recently laid off from a job.
Not working (nonemployed): Those indicating they did not work for pay or during the week of 1 February of the survey reference year. These individuals are either unemployed or are not in the labor force.
S&E occupations: Biological, agricultural, and environmental life scientists; computer and mathematical scientists; physical scientists; social scientists; engineers; and post-secondary teachers in these fields.
S&E-related occupations: Health-related occupations, S&E managers, S&E precollege teachers, S&E technicians and technologists, architects, actuaries, and postsecondary teachers in these fields.
Non-S&E occupations: Occupations that are neither S&E occupations nor S&E-related occupations.
Data Sources and Limitations
Data presented here are from the 2023 NSCG, sponsored by the National Center for Science and Engineering Statistics (NCSES) within the U.S. National Science Foundation. The NSCG surveyed approximately 161,000 individuals representing the college-educated population residing in the United States and younger than 76 during the week of 1 February 2023 with at least one degree (bachelor’s degree or higher) earned (in the United States or abroad) before 1 January 2022. The resulting data contain approximately 94,500 completed responses. For further survey information, please visit the NSCG website (https://ncses.nsf.gov/surveys/national-survey-college-graduates).
The estimates in this InfoBrief are based on responses from a sample of the population and may differ from actual values because of sampling variability or other factors. As a result, apparent differences between the estimates for two or more groups may not be statistically significant. All comparative statements in this InfoBrief have undergone statistical testing and are significant at the 90% confidence level unless otherwise noted. The variances of estimates in this report were calculated using the successive difference replication method. Standard errors for all estimates in the tables and figures of this InfoBrief are available upon request.
Data presented in this InfoBrief are now available for custom tabulations through the NCSES data tools available at https://ncses.nsf.gov/explore-data. The NSCG public use data files are available for download from https://ncses.nsf.gov/explore-data/microdata/national-survey-college-graduates. Data from the NSCG are also included in NCSES reports, such as Science and Engineering Indicators and Women, Minorities, and Persons with Disabilities in STEM.
NCSES has reviewed this product for unauthorized disclosure of confidential information and approved its release (NCSES-DRN24-091).
Notes
1The National Survey of College Graduates target population includes U.S.-residing individuals with a bachelor’s degree or higher who are younger than 76 years old. In 2023, approximately 753,000 college graduates have never worked for pay or profit and are excluded from these labor market analyses.
2In April 2023, the president signed H.J. Res. 7 into law which terminated the national emergency related to the COVID-19 pandemic. In May 2023, the World Health Organization declared the end of the pandemic phase of COVID-19. This report summarizes the employment characteristics of the nation’s college-educated population as of February 2023 and provides a unique picture of the U.S. labor force conditions at the end of the pandemic.
3For those individuals not employed in 2023, the occupation included in table 1 reflects the last occupation held prior to February 2023.
4Since one of the racial-ethnic groups considered is Hispanic individuals of any race, references to racial-ethnic groups should be interpreted as including only non-Hispanic individuals unless stated otherwise. Similarly, since one of the racial-ethnic groups considered is individuals who are not Hispanic and are more than one race, references to racial-ethnic groups should be interpreted as including individuals of only one race group unless stated otherwise.
5The full-time employment rate among Hispanic individuals was not statistically significantly different from the corresponding rate for Asian individuals (72.1%) or Black individuals (70.0%). The full-time employment rate for White individuals was not statistically significantly different from the corresponding rate for individuals who were American Indian or Alaska Native, Native Hawaiian or Other Pacific Islander, or more than one race (67.9%).
6The telework rate for White individuals was not statistically significantly different from the corresponding rate among Black individuals (47.5%) and individuals who were American Indian or Alaska Native, Native Hawaiian or Other Pacific Islander, or more than one race (50.2%).
7In contrast, the 2021 telework question allowed respondents to distinguish whether their access to telework was or was not a direct result of the pandemic, but it did not contain separate response options for being required versus allowed to telework.
8Various sources report that telework increased during the pandemic, some of which are summarized in the Government Accountability Office report GAO-23-105999, Telework: Growth Supported Economic Activity During the Pandemic, but Future Impacts Are Uncertain. This report uses the American Community Survey and the American Time Use Survey (ATUS) data to document that “the percentage of workers who worked from home (teleworked) rose sharply between 2019 and 2021.” According to the ATUS, “workers were still more likely to work at home in 2023 than in 2019, before the COVID-19 pandemic.”
9Rates at which telework “did not make sense for my job” were not statistically significantly different between precollege teachers and health-related occupations, and these rates were both statistically significantly larger than the rate at which telework “did not make sense for my job” among chemists (except biochemists). The rate at which telework “did not make sense for my job” among chemists (except biochemists) was not statistically significantly different to the corresponding rates for agricultural food scientists, postsecondary teachers—life and related sciences, postsecondary teachers—physical and related sciences, and other non-S&E occupations.
Suggested Citation
National Center for Science and Engineering Statistics (NCSES). 2025. The College-Graduate Workforce in the Transition to a Post-Pandemic Labor Market: Trends in Employment, Professional Engagement, and Work Arrangements. NSF 25-331. Alexandria, VA: U.S. National Science Foundation. Available at https://ncses.nsf.gov/pubs/nsf25331.
Contact Us
National Center for Science and Engineering Statistics
Directorate for Social, Behavioral and Economic Sciences
U.S. National Science Foundation
2415 Eisenhower Avenue, Suite W14200
Alexandria, VA 22314
Tel: (703) 292-8780
FIRS: (800) 877-8339
TDD: (800) 281-8749
E-mail: ncsesweb@nsf.gov
NSF 25-331
|September 23, 2025