 An official website of the United States government
Relationship Between Product Innovation and Business Owner Demographics Varies by Industry
Of the 4.9 million for-profit U.S. businesses with at least one employee in 2020, 9.0% introduced a product innovation during 2018–20. Innovation rates vary by industry and by the demographic characteristics of business owners, such as sex, minority status, and place of birth (table 1). Differences in innovation rates may be explained in part by varying rates of business ownership by industry based on owner demographics. This InfoBrief explores relationships between the incidence of product innovation, business owner demographics, and industry. In the analysis that follows, companies are classified according to owner demographics if persons with that demographic characteristic own more than a 50% stake in the company. For example, a female-owned company is one where females own over 50% of the company.
Detail may not add to total because of rounding. Unclassifiable businesses are those where no individual owns more than 10%, such as many publicly traded corporations. Minority status is defined here as any racial or ethnic combination other than White, not Hispanic. Statistics are representative of companies located in the United States. Ownership demographics and company counts are from reference year 2020. Innovation rates are based on reference year 2020 response regarding innovation over the 2018–20 period. Companies are classified according to owner demographics if persons with that demographic characteristic own more than a 50% stake in the company.
National Center for Science and Engineering Statistics and Census Bureau, 2021 Annual Business Survey: Data Year 2020.
Data are from the Annual Business Survey (ABS), which asks businesses about innovation activities, the demographic characteristics of business owners, and other topics. A product innovation is a new or improved good or service that differs significantly from the business’s previous goods or services and that has been introduced on the market. Product innovations may be completely new to the market or merely new to the business.
Table 1 shows the estimated count of employer companies in 2020 along with the associated rate of product innovation for businesses classified according to different owner demographics. The “unclassifiable” categories in this table represent businesses where no individual owns more than 10% of the company, such as many publicly traded corporations. About 10% of companies did not provide enough information to classify them based on the place of birth of their owners. These companies are tabulated in the “did not answer” category.
Table 2 through table 7 present the product innovation rates and company counts by sector and the demographic characteristics examined in this InfoBrief. The remaining analysis in this InfoBrief focuses on comparisons between companies that could be classified based on owner demographics and omits companies that were unclassifiable or, for the place of birth analysis, did not provide an answer.
r = relative standard error > 50%.
NAICS = 2017 North American Industry Classification System.
Industry classification based on dominant establishment payroll. Statistics are representative of companies located in the United States. Companies are classified according to owner demographics if persons with that demographic characteristic own more than a 50% stake in the company.
National Center for Science and Engineering Statistics and Census Bureau, 2021 Annual Business Survey: Data Year 2020.
r = relative standard error > 50%.
NAICS = 2017 North American Industry Classification System.
Detail may not add to total because of rounding. Industry classification based on dominant establishment payroll. Statistics are representative of companies located in the United States. Companies are classified according to owner demographics if persons with that demographic characteristic own more than a 50% stake in the company.
National Center for Science and Engineering Statistics and Census Bureau, 2021 Annual Business Survey: Data Year 2020.
r = relative standard error > 50%.
NAICS = 2017 North American Industry Classification System.
Detail may not add to total because of rounding. Industry classification based on dominant establishment payroll. Statistics are representative of companies located in the United States. Companies classified as “minority” are those companies classified as any race and ethnicity combination other than White, not Hispanic. Companies are classified according to owner demographics if persons with that demographic characteristic own more than a 50% stake in the company.
National Center for Science and Engineering Statistics and Census Bureau, 2021 Annual Business Survey: Data Year 2020.
i = > 50% of the estimate is a combination of imputation and reweighting to account for nonresponse; r = relative standard error > 50%.
NAICS = 2017 North American Industry Classification System.
Detail may not add to total because of rounding. Industry classification based on dominant establishment payroll. Statistics are representative of companies located in the United States. Companies classified as “minority” are those companies classified as any race and ethnicity combination other than non-Hispanic and White. Companies are classified according to owner demographics if persons with that demographic characteristic own more than a 50% stake in the company.
National Center for Science and Engineering Statistics and Census Bureau, 2021 Annual Business Survey: Data Year 2020.
r = relative standard error > 50%.
NAICS = 2017 North American Industry Classification System.
Detail may not add to total because of rounding. Industry classification based on dominant establishment payroll. Statistics are representative of companies located in the United States. Companies are classified according to owner demographics if persons with that demographic characteristic own more than a 50% stake in the company.
National Center for Science and Engineering Statistics and Census Bureau, 2021 Annual Business Survey: Data Year 2020.
i = > 50% of the estimate is a combination of imputation and reweighting to account for nonresponse; r = relative standard error > 50%.
NAICS = 2017 North American Industry Classification System.
Detail may not add to total because of rounding. Industry classification based on dominant establishment payroll. Statistics are representative of companies located in the United States. Companies are classified according to owner demographics if persons with that demographic characteristic own more than a 50% stake in the company.
National Center for Science and Engineering Statistics and Census Bureau, 2021 Annual Business Survey: Data Year 2020.
Sex of owner
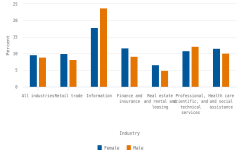
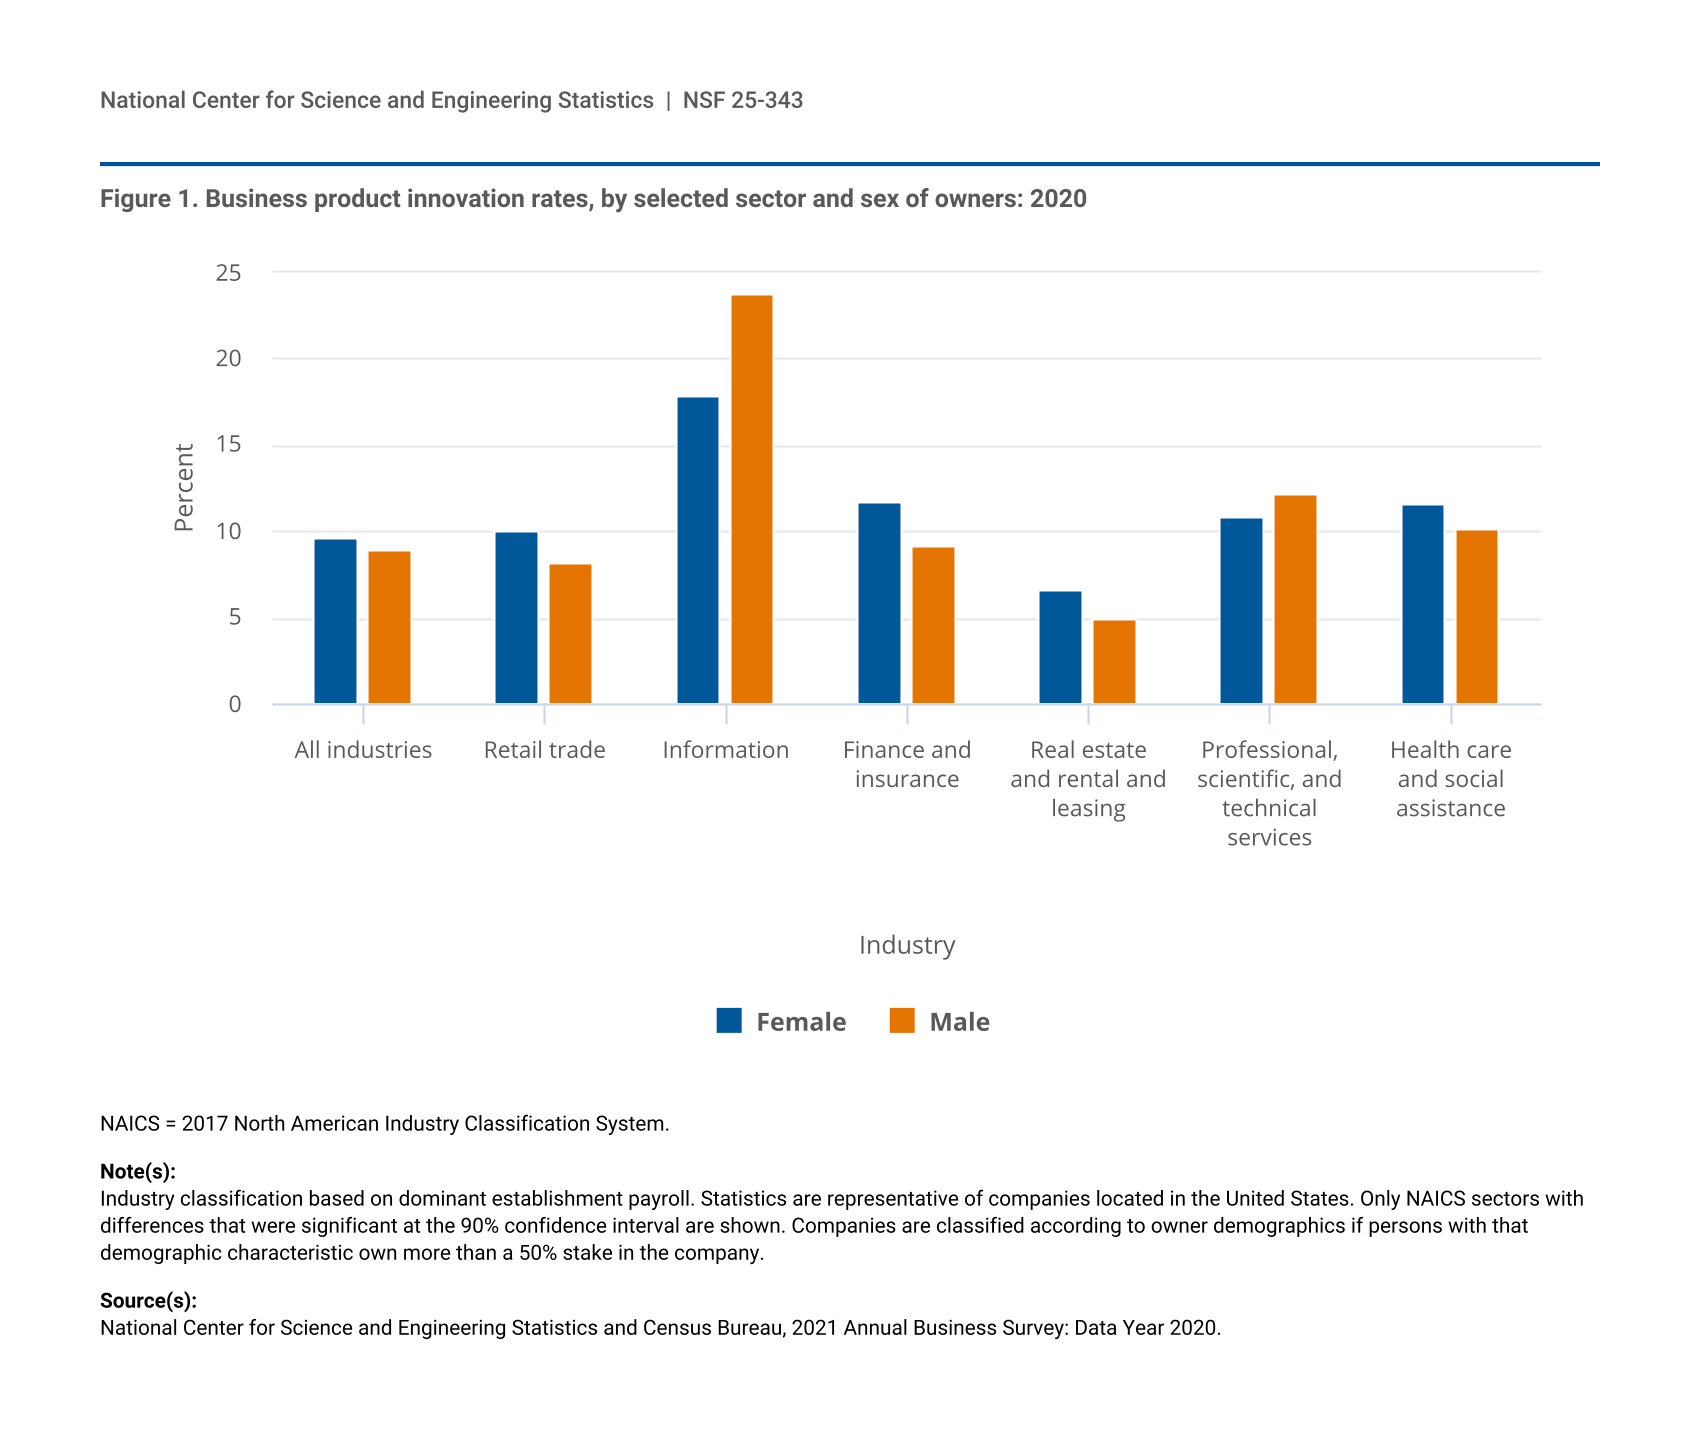
Most businesses in the United States were male majority-owned. There were 2.9 male majority-owned businesses in 2020 for every female majority-owned business. Overall, female majority-owned companies had a higher incidence of product innovation than did male majority-owned companies (9.7% vs. 8.9%) (table 1). However, this was not the case in all industries. Figure 1 shows the incidence of product innovation for female and male majority-owned companies by select North American Industry Classification System (NAICS) sectors. Female majority-owned businesses in the retail trade (NAICS 44–45) and health care and social assistance (NAICS 62) sectors had higher rates of product innovation than did male majority-owned businesses. These are also sectors where the ratio of female-to-male-owned businesses is higher than average (table 3). Two sectors where male majority-owned businesses reported higher product innovation rates were information (NAICS 51) and professional, scientific, and technical services (NAICS 54). In several sectors (such as manufacturing), no statistically significant difference was found in the incidence of product innovation for female or male majority-owned businesses. These sectors are omitted from figure 1. When the analysis controlled for NAICS sector, female majority-owned businesses were 3% more likely than male majority-owned businesses to report product innovation.
| Industry | Female | Male |
|---|---|---|
| All industries | 9.7 | 8.9 |
| Retail trade | 10.0 | 8.2 |
| Information | 17.9 | 23.8 |
| Finance and insurance | 11.7 | 9.2 |
| Real estate and rental and leasing | 6.7 | 5.0 |
| Professional, scientific, and technical services | 10.9 | 12.2 |
| Health care and social assistance | 11.6 | 10.1 |
NAICS = 2017 North American Industry Classification System.
Industry classification based on dominant establishment payroll. Statistics are representative of companies located in the United States. Only NAICS sectors with differences that were significant at the 90% confidence interval are shown. Companies are classified according to owner demographics if persons with that demographic characteristic own more than a 50% stake in the company.
National Center for Science and Engineering Statistics and Census Bureau, 2021 Annual Business Survey: Data Year 2020.
Minority status
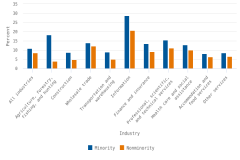
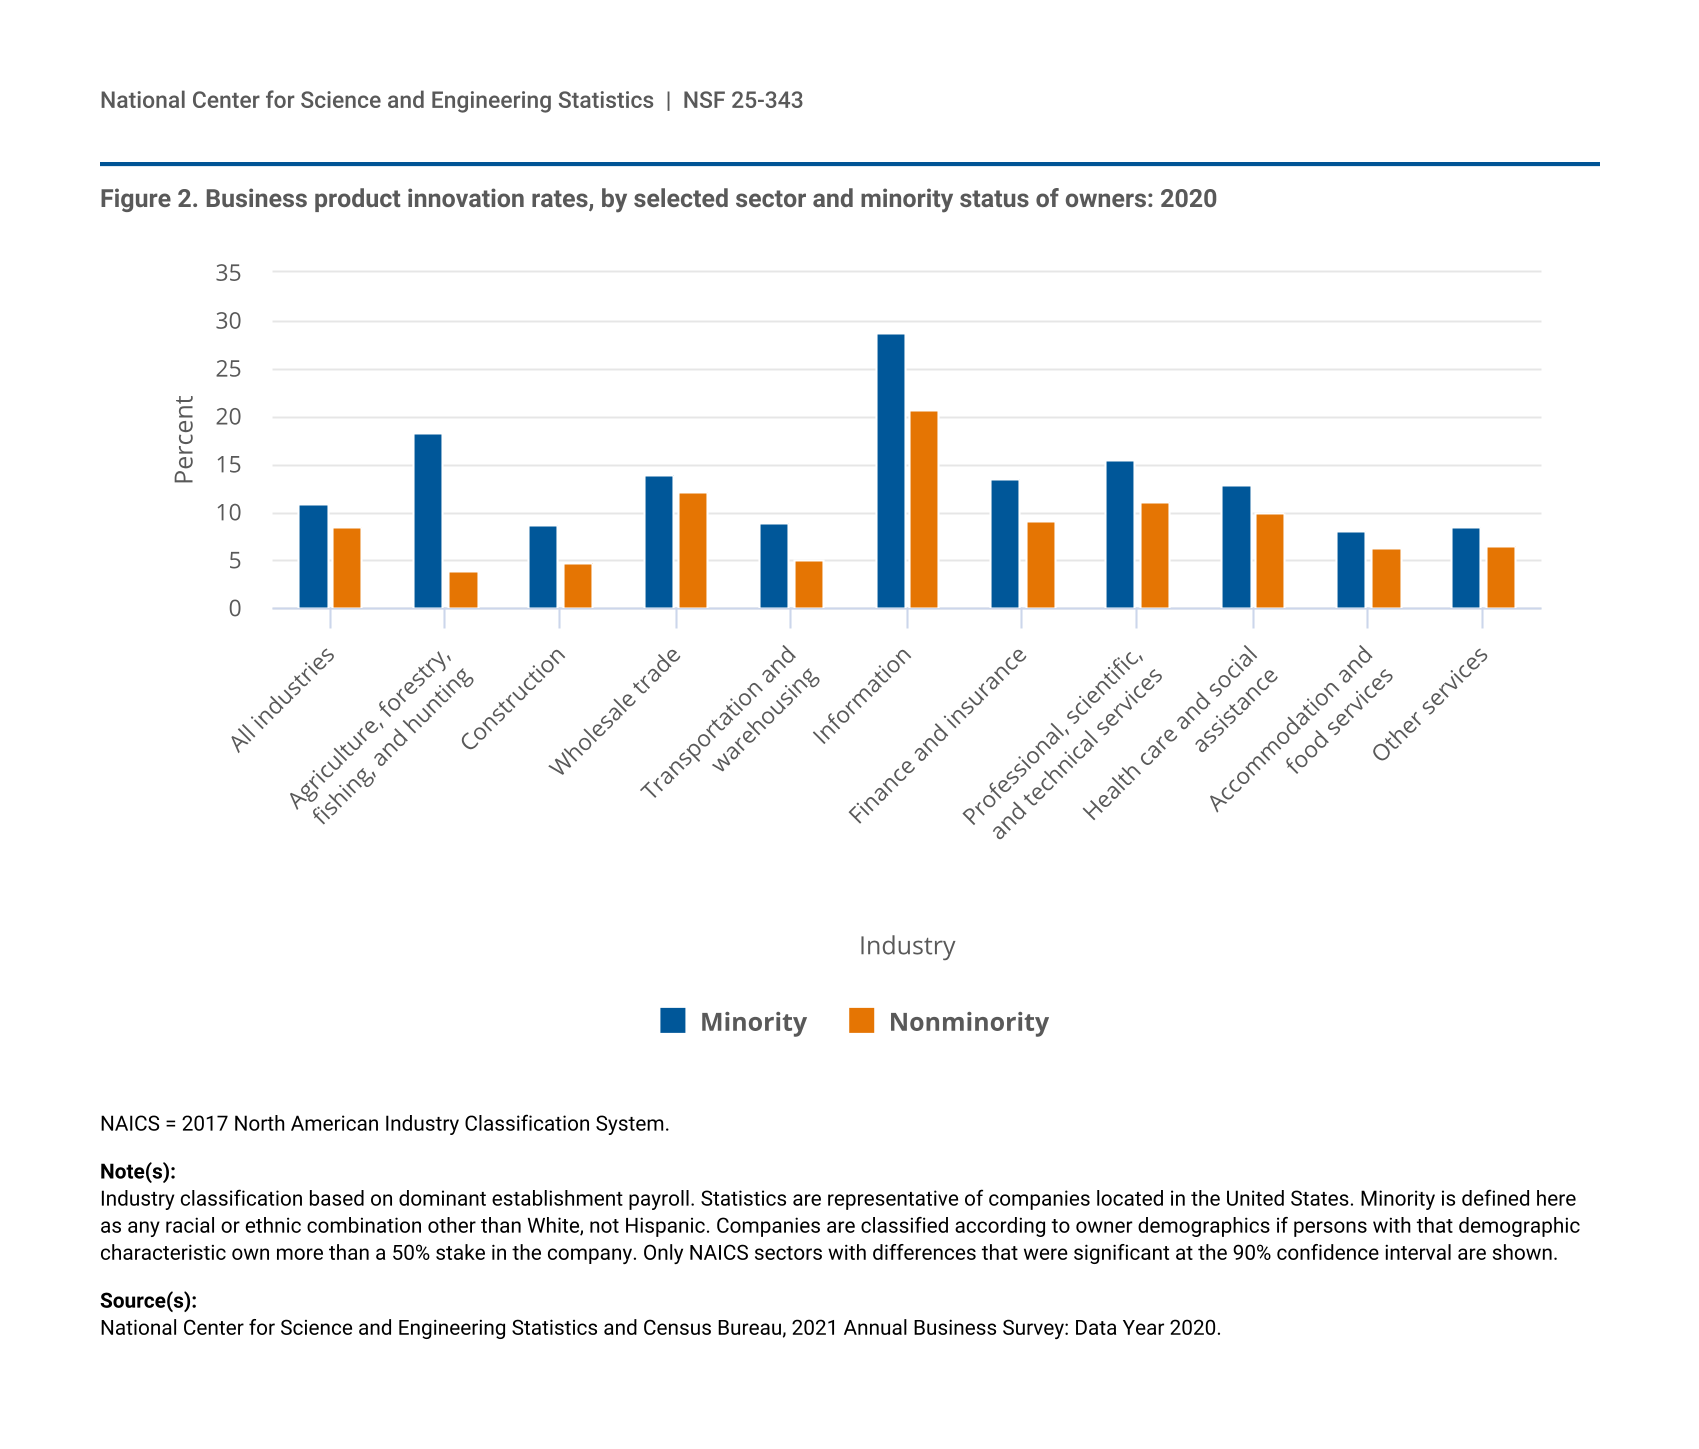
Minority-owned businesses—that is, businesses where persons from racial or ethnic minority groups (any racial or ethnic combination other than White, not Hispanic) own over 50% of the business—accounted for almost one-fifth of all for-profit companies with employees in 2020. In 2020, minority-owned businesses had a higher incidence of reported product innovation (10.8%), compared with nonminority-owned businesses (8.5%) overall (figure 2). This difference persists across most sectors. The difference in innovation rates between minority- and nonminority-owned businesses was particularly large for the agriculture, forestry, fishing, and hunting sector (NAICS 11)—a sector where minority-owned businesses account for only 5% of all employer companies. The difference in innovation rates between minority- and nonminority-owned businesses was 1.7 percentage points in the accommodation and food services sector (NAICS 72), the sector in which minority-owned businesses are the most represented (accounting for 38% of all businesses). After the analysis controlled for NAICS sector, minority-owned businesses were 35% more likely than nonminority-owned businesses to report product innovation in 2020.
| Industry | Minority | Nonminority |
|---|---|---|
| All industries | 10.8 | 8.5 |
| Agriculture, forestry, fishing, and hunting | 18.3 | 4.0 |
| Construction | 8.6 | 4.7 |
| Wholesale trade | 13.9 | 12.2 |
| Transportation and warehousing | 8.9 | 5.1 |
| Information | 28.8 | 20.7 |
| Finance and insurance | 13.5 | 9.2 |
| Professional, scientific, and technical services | 15.4 | 11.0 |
| Health care and social assistance | 12.8 | 10.0 |
| Accommodation and food services | 8.1 | 6.4 |
| Other services | 8.5 | 6.6 |
NAICS = 2017 North American Industry Classification System.
Industry classification based on dominant establishment payroll. Statistics are representative of companies located in the United States. Minority is defined here as any racial or ethnic combination other than White, not Hispanic. Companies are classified according to owner demographics if persons with that demographic characteristic own more than a 50% stake in the company. Only NAICS sectors with differences that were significant at the 90% confidence interval are shown.
National Center for Science and Engineering Statistics and Census Bureau, 2021 Annual Business Survey: Data Year 2020.
Place of birth
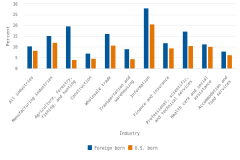
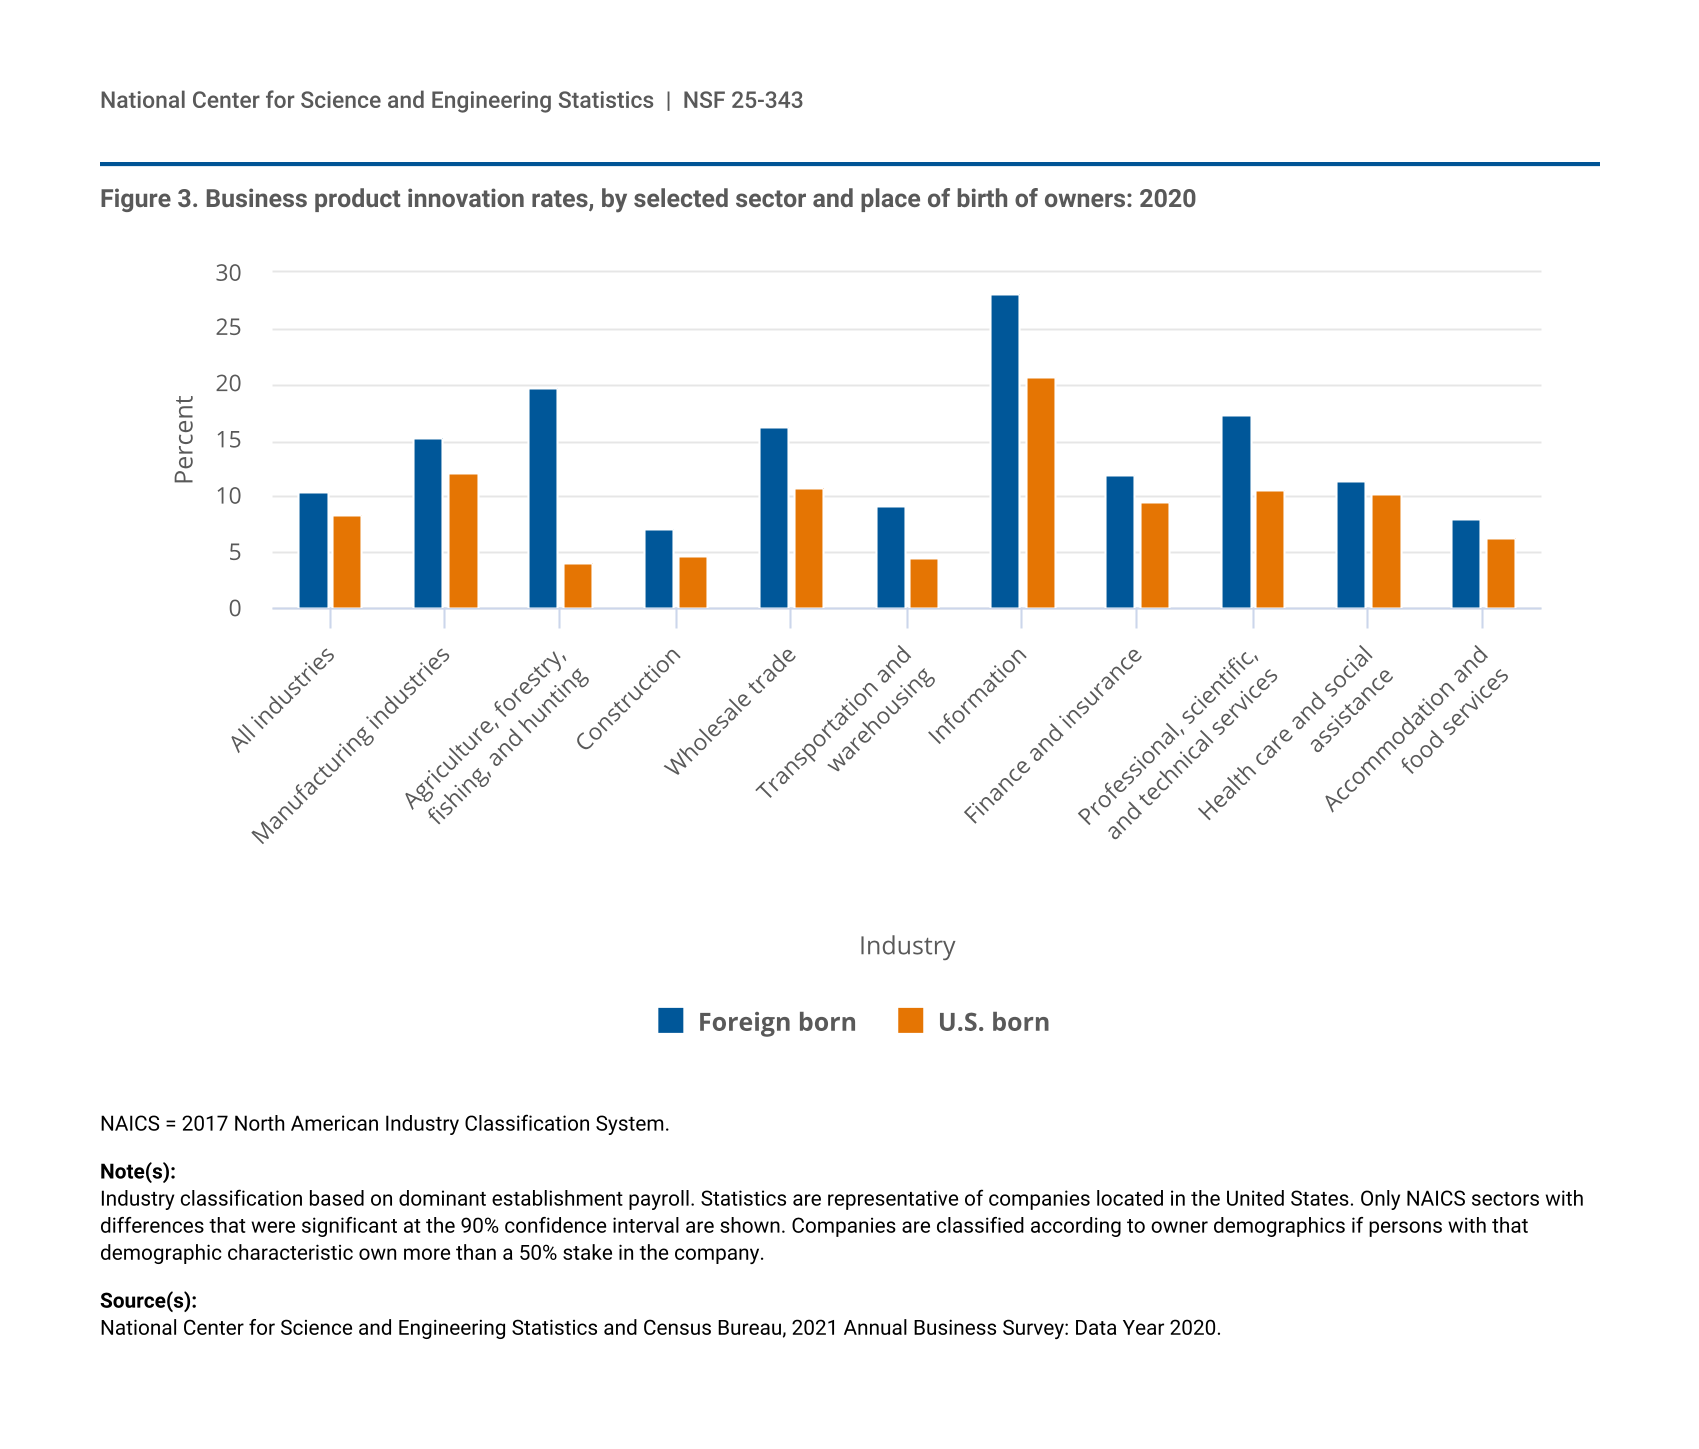
In 2020, at least 71% of U.S. businesses with employees were majority-owned by persons born in the United States, and at least 17% were majority-owned by persons born outside the United States. Figure 3 shows that the differences in product innovation rates for these two groups is similar to those shown in figure 2 for minority- and nonminority-owned businesses. For the manufacturing sector (NAICS 31–33), companies with foreign-born majority owners had product innovation rates 3 percentage points higher than those with U.S.-born majority owners. Across all industries, the product innovation rate for businesses with foreign-born majority owners was 10.5%, compared with 8.4% for businesses with U.S.-born majority owners. Companies that did not provide enough information to classify them by the place of birth of their owners also reported product innovation at a higher rate (9.9%) than businesses with U.S.-born majority owners. When the analysis controlled for NAICS sector, businesses with foreign-born majority owners were 32% more likely to report product innovation than businesses with U.S.-born majority owners.
| Industry | Foreign born | U.S. born |
|---|---|---|
| All industries | 10.5 | 8.4 |
| Manufacturing industries | 15.2 | 12.2 |
| Agriculture, forestry, fishing, and hunting | 19.7 | 4.1 |
| Construction | 7.1 | 4.7 |
| Wholesale trade | 16.3 | 10.8 |
| Transportation and warehousing | 9.2 | 4.5 |
| Information | 28.2 | 20.6 |
| Finance and insurance | 11.9 | 9.5 |
| Professional, scientific, and technical services | 17.3 | 10.6 |
| Health care and social assistance | 11.4 | 10.3 |
| Accommodation and food services | 8.1 | 6.3 |
NAICS = 2017 North American Industry Classification System.
Industry classification based on dominant establishment payroll. Statistics are representative of companies located in the United States. Only NAICS sectors with differences that were significant at the 90% confidence interval are shown. Companies are classified according to owner demographics if persons with that demographic characteristic own more than a 50% stake in the company.
National Center for Science and Engineering Statistics and Census Bureau, 2021 Annual Business Survey: Data Year 2020.
Conclusion and Next steps
Summary statistics alone cannot explain why differences in product innovation rates exist for businesses with different owner demographics or why they vary from sector to sector. Many factors may contribute to a firm’s product innovation, including owner characteristics (e.g., age, sex, and education), firm characteristics (e.g., age, size, industry, workforce, location, and capitalization), and exogenous factors (e.g., tax policy, intellectual property policy, and innovations from competitors). For example, a related InfoBrief notes an inverse relationship between product innovation rates and the age of business owners. This relationship may explain some of the differences explored here in innovation rates for businesses with owners of different sexes or minority status, because female business owners tend to be slightly younger than male business owners and because minority business owners are much younger than nonminority business owners. These different groups of business owners likely also differ in terms of education. Further research is necessary to understand how different factors contribute to product innovation and how these factors may interact with each other.
Data Source, Limitations, and Availability
The ABS is a sample survey, designed to collect a wide range of data on business R&D, intellectual property, company and owner characteristics, and innovation activities in the United States. The ABS was developed and is cosponsored by the National Center for Science and Engineering Statistics (NCSES) within the National Science Foundation and by the Census Bureau. The statistics from the survey are based on a sample, and as such, they are subject to both sampling and nonsampling errors (see the Technical Notes in the data tables report Annual Business Survey: 2021 (Data Year 2020).
For the 2021 ABS, a total of 300,000 employer companies were sampled to represent the population of 4.9 million employer companies. The unit response rate was 68.8%.
Statistics presented here from the ABS differ from statistics produced by the Census Bureau on the demographics of business owners; statistics shown here represent only for-profit businesses, whereas the Census statistics represent all businesses regardless of tax status.
The full set of data tables on innovation, R&D, and company demographics from this survey are available in the report Annual Business Survey: 2021 (Data Year 2020). Individual data tables and tables with relative standard errors and imputation rates from the 2021 survey are available from NCSES on request. The most recent data and methodology are also available at the survey’s homepage (https://ncses.nsf.gov/surveys/annual-business-survey).
The estimates in this InfoBrief are based on responses from a sample of the population and may differ from actual values because of sampling variability or other factors. As a result, apparent differences between the estimates for two or more groups may not be statistically significant. All comparative statements in this InfoBrief have undergone statistical testing and are significant at the 90% confidence level unless otherwise noted. The ABS used the extended delete-a-group jackknife variance estimator.
Restricted microdata from the ABS are available at any of the 33 secure Federal Statistical Research Data Centers (FSRDCs) administered by the Census Bureau. To learn more about the FSRDCs and how to apply, please visit the Census page on research with restricted-use data. Assistance from an FSRDC administrator will greatly reduce the need for future revisions to applications. For general questions, including appropriate FSRDC administrator contact information, please reach out to the Census Bureau at ced.fsrdc.info@census.gov.
NCSES has reviewed this product for unauthorized disclosure of confidential information and approved its release (NCSES-DRN25-034).
Notes
1 The most recent methodology and tabulated data for the Annual Business Survey are available at https://ncses.nsf.gov/surveys/annual-business-survey.
2 ABS questions are based on internationally recognized definitions and guidelines for measuring innovation. Organisation for Economic Co-operation and Development (OECD) and Statistical Office of the European Communities (Eurostat). 2018. Oslo Manual: Guidelines for Collecting and Interpreting Innovation Data, 4th ed., Paris.
3 Differences between companies grouped by owner characteristics and adjusted for industry effects were assessed by using logistic regressions on weighted ABS microdata. Regression models were specified as logit PRODINNOV = β1*FIRM_OWNER_CHARACTERISTIC + β2*SECTOR.
4 A formal nonresponse study has not been conducted, but it is possible that businesses that did not respond to the place of birth questions are more likely than businesses that did respond to have foreign-born owners.
5 National Center for Science and Engineering Statistics (NCSES). 2025. Relationships Between Business Owner Age, Education, and Experience and Product Innovation. NSF 25-342. Alexandria, VA: U.S. National Science Foundation. Available at https://ncses.nsf.gov/pubs/nsf25342.
6 Owners were 55 years or older for 49.3% of female-owned businesses and 51.9% of male-owned businesses (https://data.census.gov/table?q=ab2000*&n=00&tid=ABSCBO2020.AB2000CSCBO&nkd=OWNER_ETH~001,OWNER_RACE~00,OWNER_VET~001,QDESC~O09). Owners were 55 years or older for 37.6% of minority-owned businesses and 54.3% of nonminority-owned businesses (https://data.census.gov/table?q=ab2000*&n=00&tid=ABSCBO2020.AB2000CSCBO&nkd=OWNER_ETH~001,OWNER_RACE~00:90:92,OWNER_SEX~001,OWNER_VET~001,QDESC~O09).
7 Restricted microdata from the ABS are available at any of the 33 secure Federal Statistical Research Data Centers (FSRDCs) administered by the Census Bureau. To learn more about the FSRDCs and how to apply, please visit the Census page on research with restricted-use data (https://www.census.gov/topics/research/guidance/restricted-use-microdata.html). Assistance from an FSRDC administrator will greatly reduce the need for future revisions to applications. For general questions, including appropriate FSRDC administrator contact information, please reach out to the Census Bureau at ced.fsrdc.info@census.gov.
8 See https://www.census.gov/library/stories/2023/01/who-owns-americas-businesses.html.
Suggested Citation
National Center for Science and Engineering Statistics (NCSES). 2025. Relationship between Product Innovation and Business Owner Demographics Varies by Industry. NSF 25-343. Alexandria, VA: U.S. National Science Foundation. Available at https://ncses.nsf.gov/pubs/nsf25343.
Contact Us
National Center for Science and Engineering Statistics
Directorate for Social, Behavioral and Economic Sciences
U.S. National Science Foundation
2415 Eisenhower Avenue, Suite W14200
Alexandria, VA 22314
Tel: (703) 292-8780
FIRS: (800) 877-8339
TDD: (800) 281-8749
E-mail: ncsesweb@nsf.gov