 An official website of the United States government
Relationships Between Business Owner Age, Education, and Experience and Product Innovation
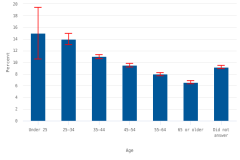
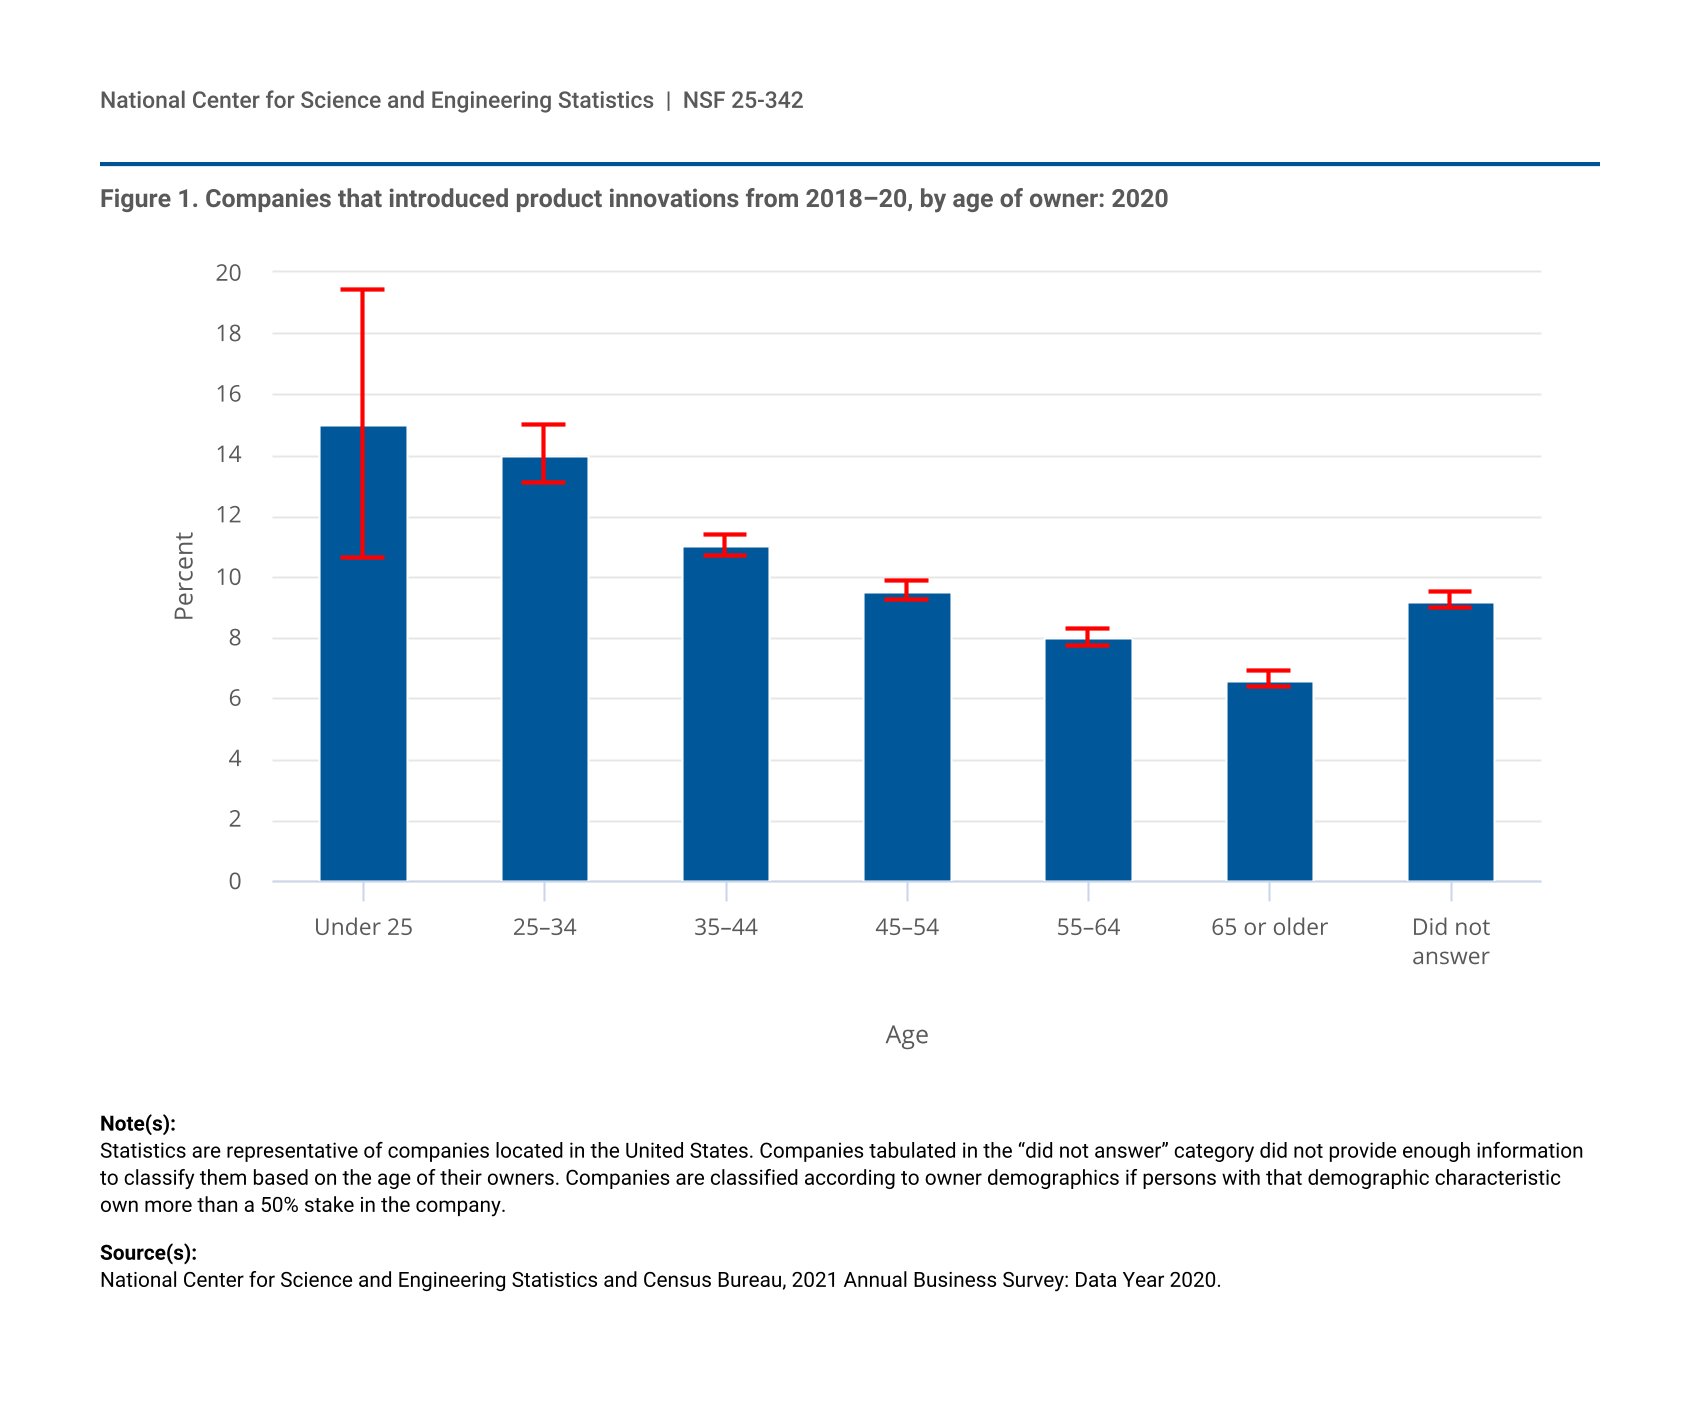
U.S. businesses with younger owners reported product innovation at higher rates than did businesses with older owners in 2020, according to data from the Annual Business Survey (ABS). The estimated share of businesses that introduced a product innovation during 2018–20 was 15.0% for businesses majority-owned by persons under 25 years of age, compared with 6.6% for businesses majority-owned by persons 65 years or older (figure 1). In the analysis that follows, companies are classified according to owner demographics if persons with that demographic characteristic (e.g., age or education) own more than a 50% stake in the company.
| Age | Product innovation rate | Margin of error |
|---|---|---|
| Under 25 | 15.0 | 4.44 |
| 25–34 | 14.0 | 0.96 |
| 35–44 | 11.0 | 0.36 |
| 45–54 | 9.5 | 0.30 |
| 55–64 | 8.0 | 0.27 |
| 65 or older | 6.6 | 0.26 |
| Did not answer | 9.2 | 0.27 |
Statistics are representative of companies located in the United States. Companies tabulated in the “did not answer” category did not provide enough information to classify them based on the age of their owners. Companies are classified according to owner demographics if persons with that demographic characteristic own more than a 50% stake in the company.
National Center for Science and Engineering Statistics and Census Bureau, 2021 Annual Business Survey: Data Year 2020.
The ABS, which is cosponsored by the National Center for Science and Engineering Statistics within the National Science Foundation and by the Census Bureau, asks businesses annually about innovation activities, the demographic characteristics of business owners, and other topics. A product innovation is a new or improved good or service introduced by a company. Product innovations may be completely new to the market or merely new to the business. This InfoBrief discusses the relationship between the incidence of product innovation and the age, education, and experience of business owners.
The companies tabulated in the “did not answer” category in figure 1 did not provide enough information to classify them based on the age of their owners or had no single age category with majority ownership (as in the case of a company with two or four equal owners who are each in different age categories). These companies represent about 19% of the estimated 4.9 million for-profit businesses with employees in 2020. Similarly, 22% of companies could not be classified based on owner education, and 17% of companies could not be classified based on owner experience. The remaining analyses in this InfoBrief focus on comparisons between companies that can be classified based on owner demographics.
Age of Owner
Figure 1 shows the estimated rates of product innovation along with 90% confidence intervals for businesses with majority owners in different age ranges. Product innovation rates were significantly different between the youngest cohort (under 25 years) and each of the three oldest cohorts (45–54, 55–64, and 65 years or older). However, due to sampling variability, the innovation rate for businesses owned by the youngest cohort did not differ significantly from that of the next two older cohorts (25–34 and 35–44 years). The product innovation rates for each cohort other than the youngest are statistically different from each other at the 90% confidence level.
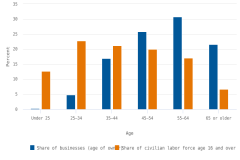
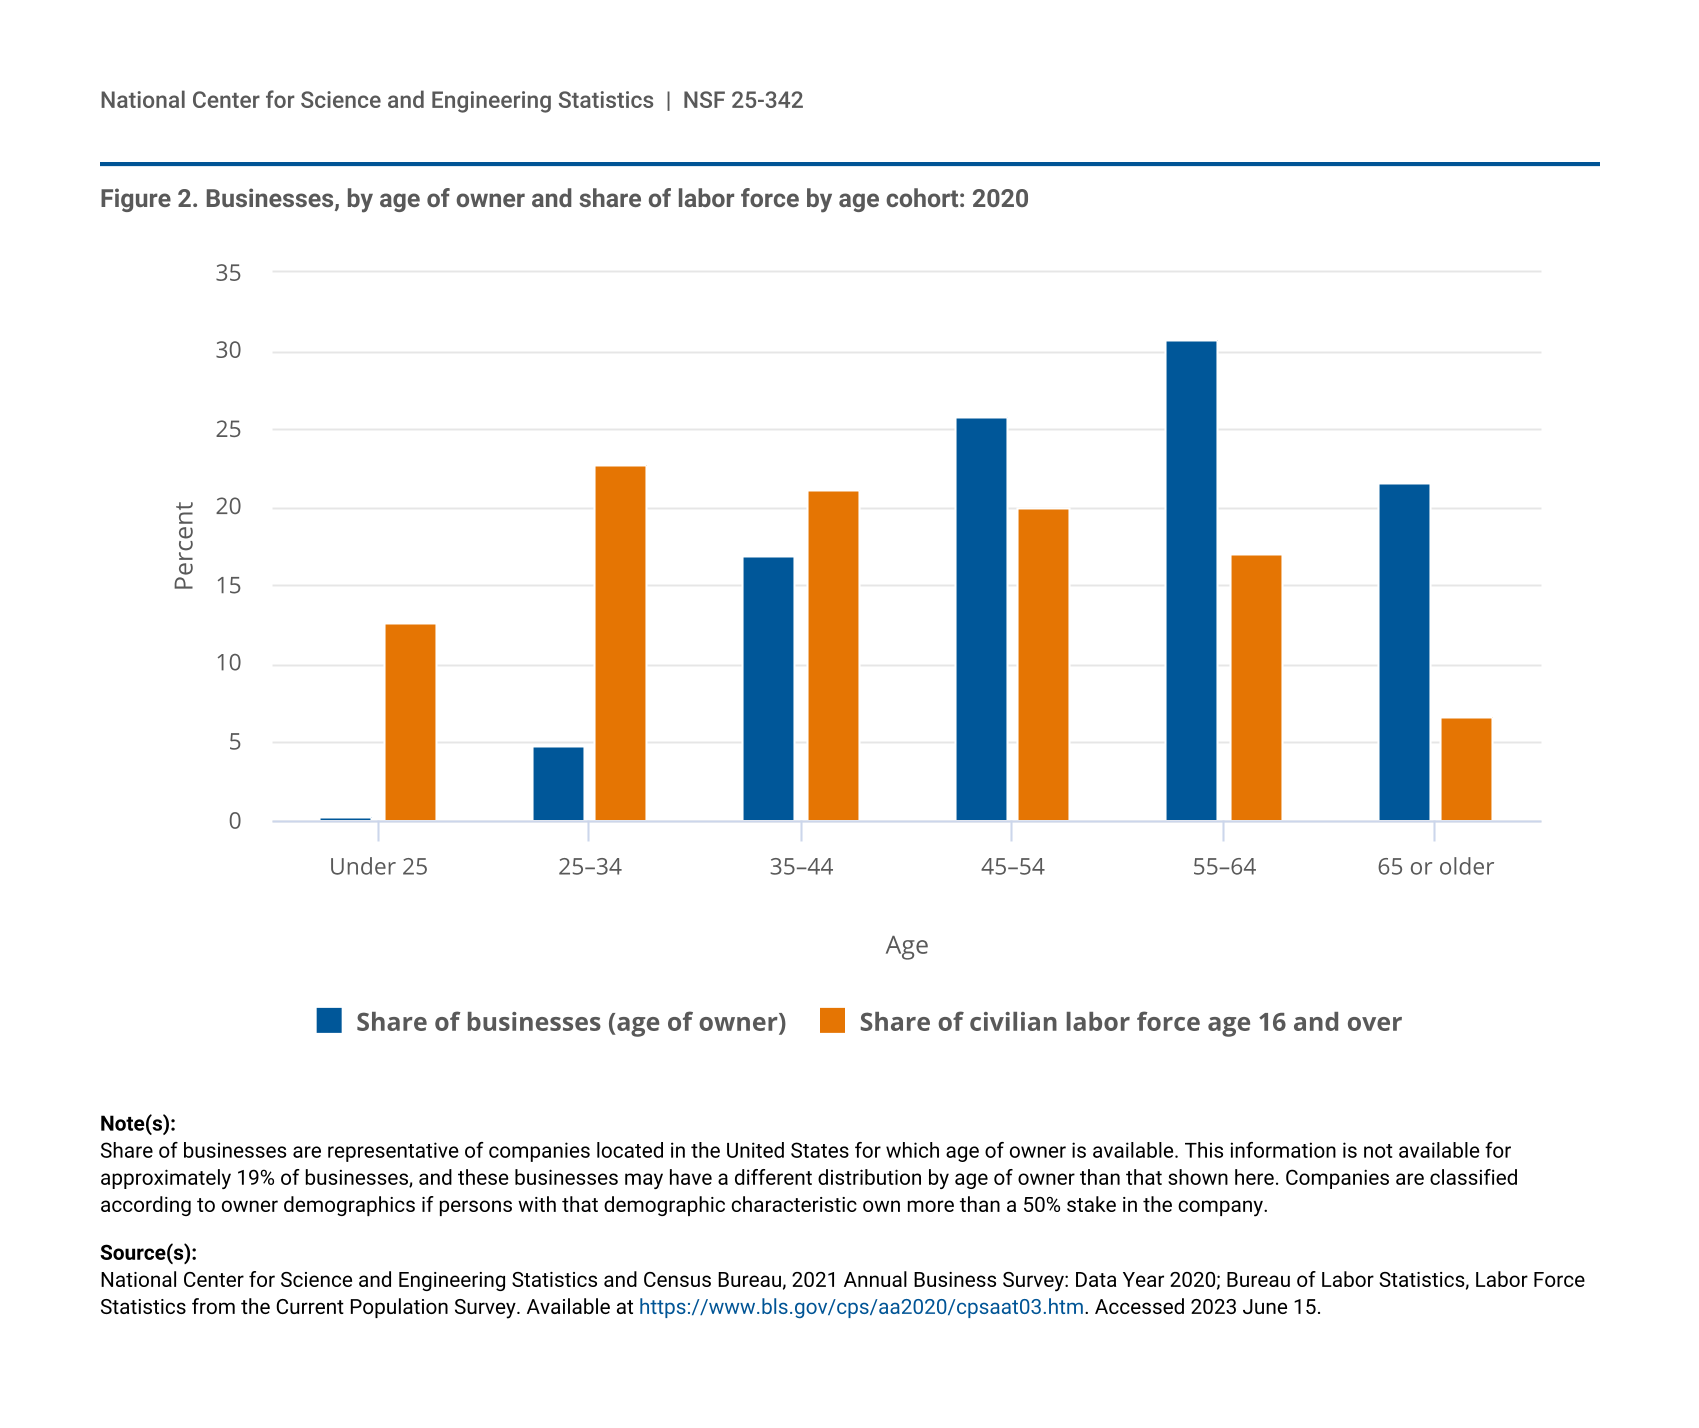
Although businesses with owners under 35 years have the highest reported rates of product innovation, these businesses only account for 5% of the 3.9 million businesses that the ABS can classify by age of owner. According to the Bureau of Labor Statistics, people under 35 years account for a much larger share (35%) of the U.S. civilian labor force in 2020 than of business owners (figure 2). Conversely, persons ages 55 or older account for less than a quarter of the labor force but are owners of over half of U.S. businesses.
| Age | Share of businesses (age of owner) | Share of civilian labor force age 16 and over |
|---|---|---|
| Under 25 | 0.2 | 12.6 |
| 25–34 | 4.8 | 22.7 |
| 35–44 | 16.9 | 21.1 |
| 45–54 | 25.8 | 20.0 |
| 55–64 | 30.7 | 17.0 |
| 65 or older | 21.6 | 6.6 |
Share of businesses are representative of companies located in the United States for which age of owner is available. This information is not available for approximately 19% of businesses, and these businesses may have a different distribution by age of owner than that shown here. Companies are classified according to owner demographics if persons with that demographic characteristic own more than a 50% stake in the company.
National Center for Science and Engineering Statistics and Census Bureau, 2021 Annual Business Survey: Data Year 2020; Bureau of Labor Statistics, Labor Force Statistics from the Current Population Survey. Available at https://www.bls.gov/cps/aa2020/cpsaat03.htm. Accessed 2023 June 15.
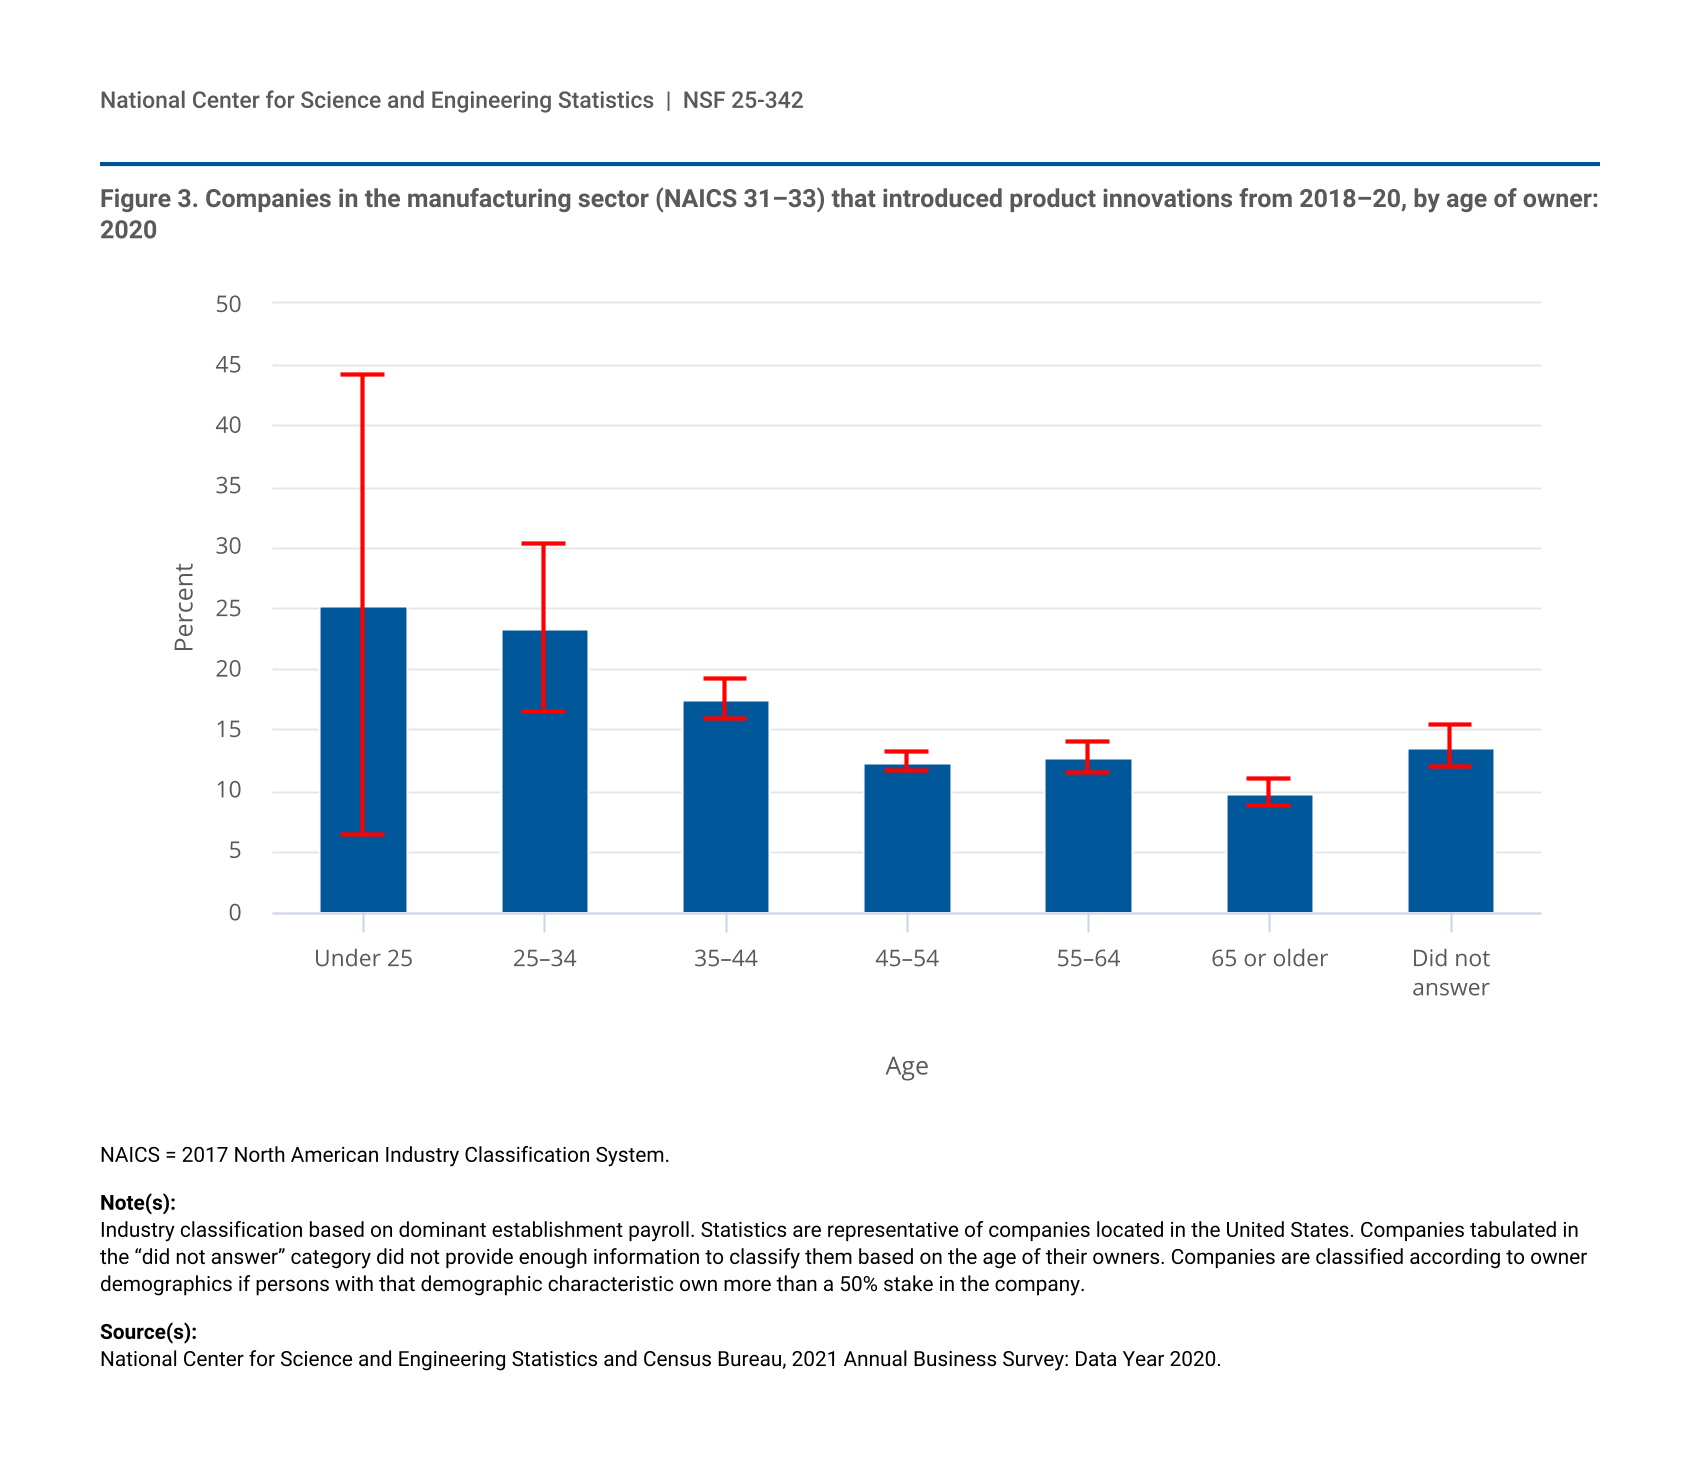
The pattern of lower product innovation rates for companies with older owners is evident across many North American Industrial Classification (NAICS) sectors. However, due to limitations of the survey sample, many of the differences in the estimated product innovation rates are not statistically significant.
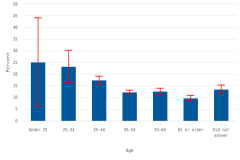
Figure 3 shows the product innovation rates for companies classified in the manufacturing sector (NAICS 31–33). For this sector, companies owned by persons in the 25–34 and 35–44 cohorts have significantly higher rates of product innovation than the older cohorts. However, the 90% confidence intervals for these two youngest cohorts overlap, indicating the estimated product innovation rates for companies owned by the 25–34 cohort are not significantly different from the 35–44 cohort.
| Age | Product innovation rate | Margin of error |
|---|---|---|
| Under 25 | 25.1 | 18.93 |
| 25–34 | 23.3 | 6.94 |
| 35–44 | 17.5 | 1.64 |
| 45–54 | 12.4 | 0.76 |
| 55–64 | 12.7 | 1.26 |
| 65 or older | 9.8 | 1.13 |
| Did not answer | 13.6 | 1.77 |
NAICS = 2017 North American Industry Classification System.
Industry classification based on dominant establishment payroll. Statistics are representative of companies located in the United States. Companies tabulated in the “did not answer” category did not provide enough information to classify them based on the age of their owners. Companies are classified according to owner demographics if persons with that demographic characteristic own more than a 50% stake in the company.
National Center for Science and Engineering Statistics and Census Bureau, 2021 Annual Business Survey: Data Year 2020.
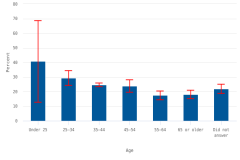
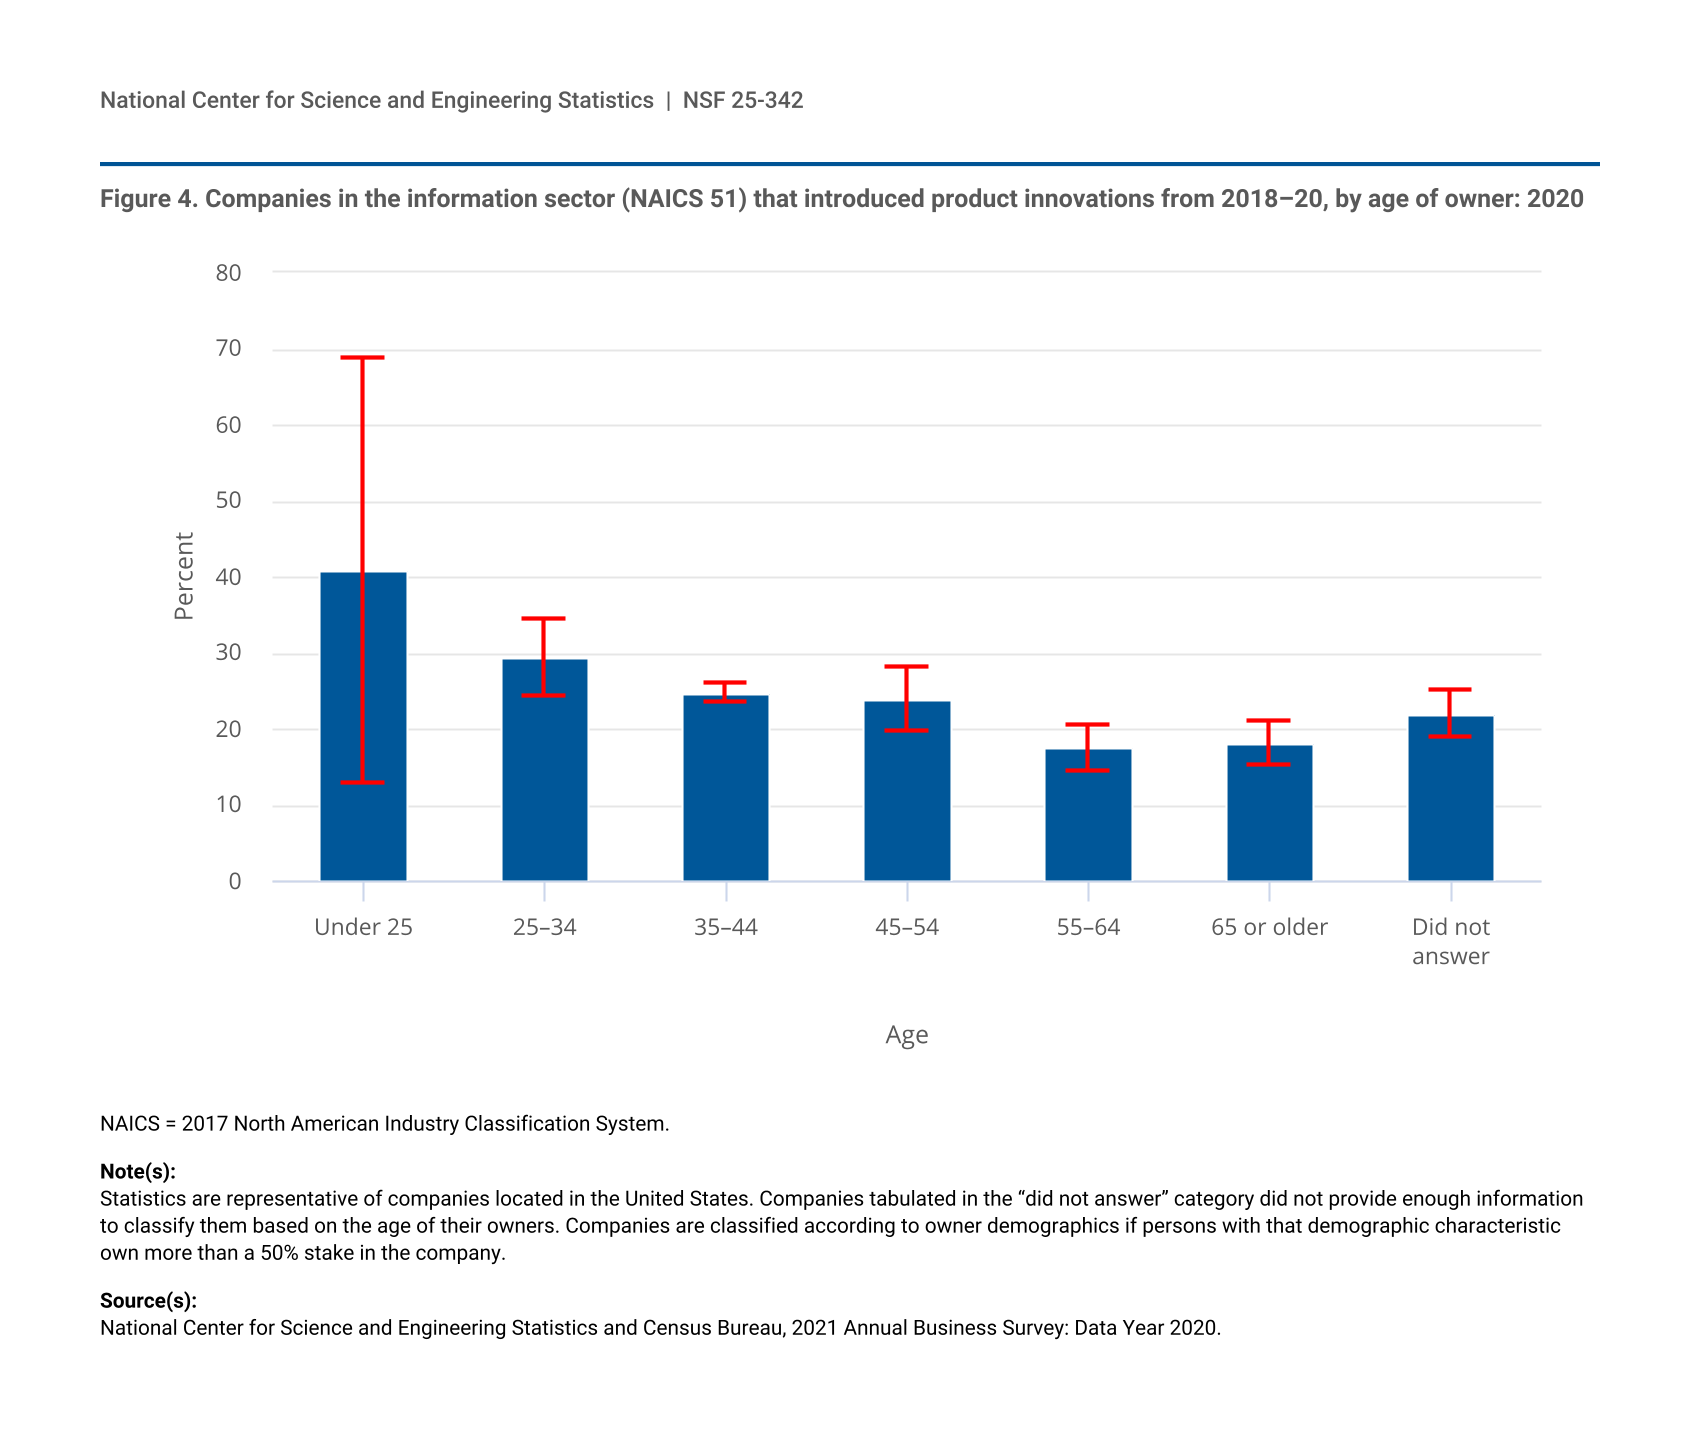
In contrast, in the information sector (NAICS 51), although product innovation rates for businesses owned by persons in the 25–34 and 35–44 cohorts are significantly higher than the rates for the 55–64 and the 65 years or older groups, the 45–54 cohort is not statistically different from any of the older or younger groups (figure 4).
| Age | Product innovation rate | Margin of error |
|---|---|---|
| Under 25 | 40.7 | 27.99 |
| 25–34 | 29.3 | 5.02 |
| 35–44 | 24.7 | 1.30 |
| 45–54 | 23.9 | 4.19 |
| 55–64 | 17.4 | 3.02 |
| 65 or older | 18.1 | 2.79 |
| Did not answer | 21.9 | 3.06 |
NAICS = 2017 North American Industry Classification System.
Statistics are representative of companies located in the United States. Companies tabulated in the “did not answer” category did not provide enough information to classify them based on the age of their owners. Companies are classified according to owner demographics if persons with that demographic characteristic own more than a 50% stake in the company.
National Center for Science and Engineering Statistics and Census Bureau, 2021 Annual Business Survey: Data Year 2020.
This pattern, higher rates of product innovation rates for younger owners in some sectors, may explain some of the observed differences in innovation rates for businesses with owners of different sexes and racial or ethnic minority status, because female business owners tend to be slightly younger than male business owners on average and minority business owners are much younger than nonminority business owners.
Prior Business Ownership
The ABS asks companies to report on the prior business ownership of its owners. Of the companies for which this information is available, 61% were owned by persons who had started a prior business and 36% were owned by those who had not. For most sectors, no significant difference in the rate of product innovation was found based on prior business ownership. The only two exceptions are the administrative and support and waste management and remediation services sector (NAICS 56) and the accommodation and food services sector (NAICS 72), in which businesses owned by persons who had owned prior businesses had lower rates of product innovation than did businesses owned by persons with no prior business ownership.
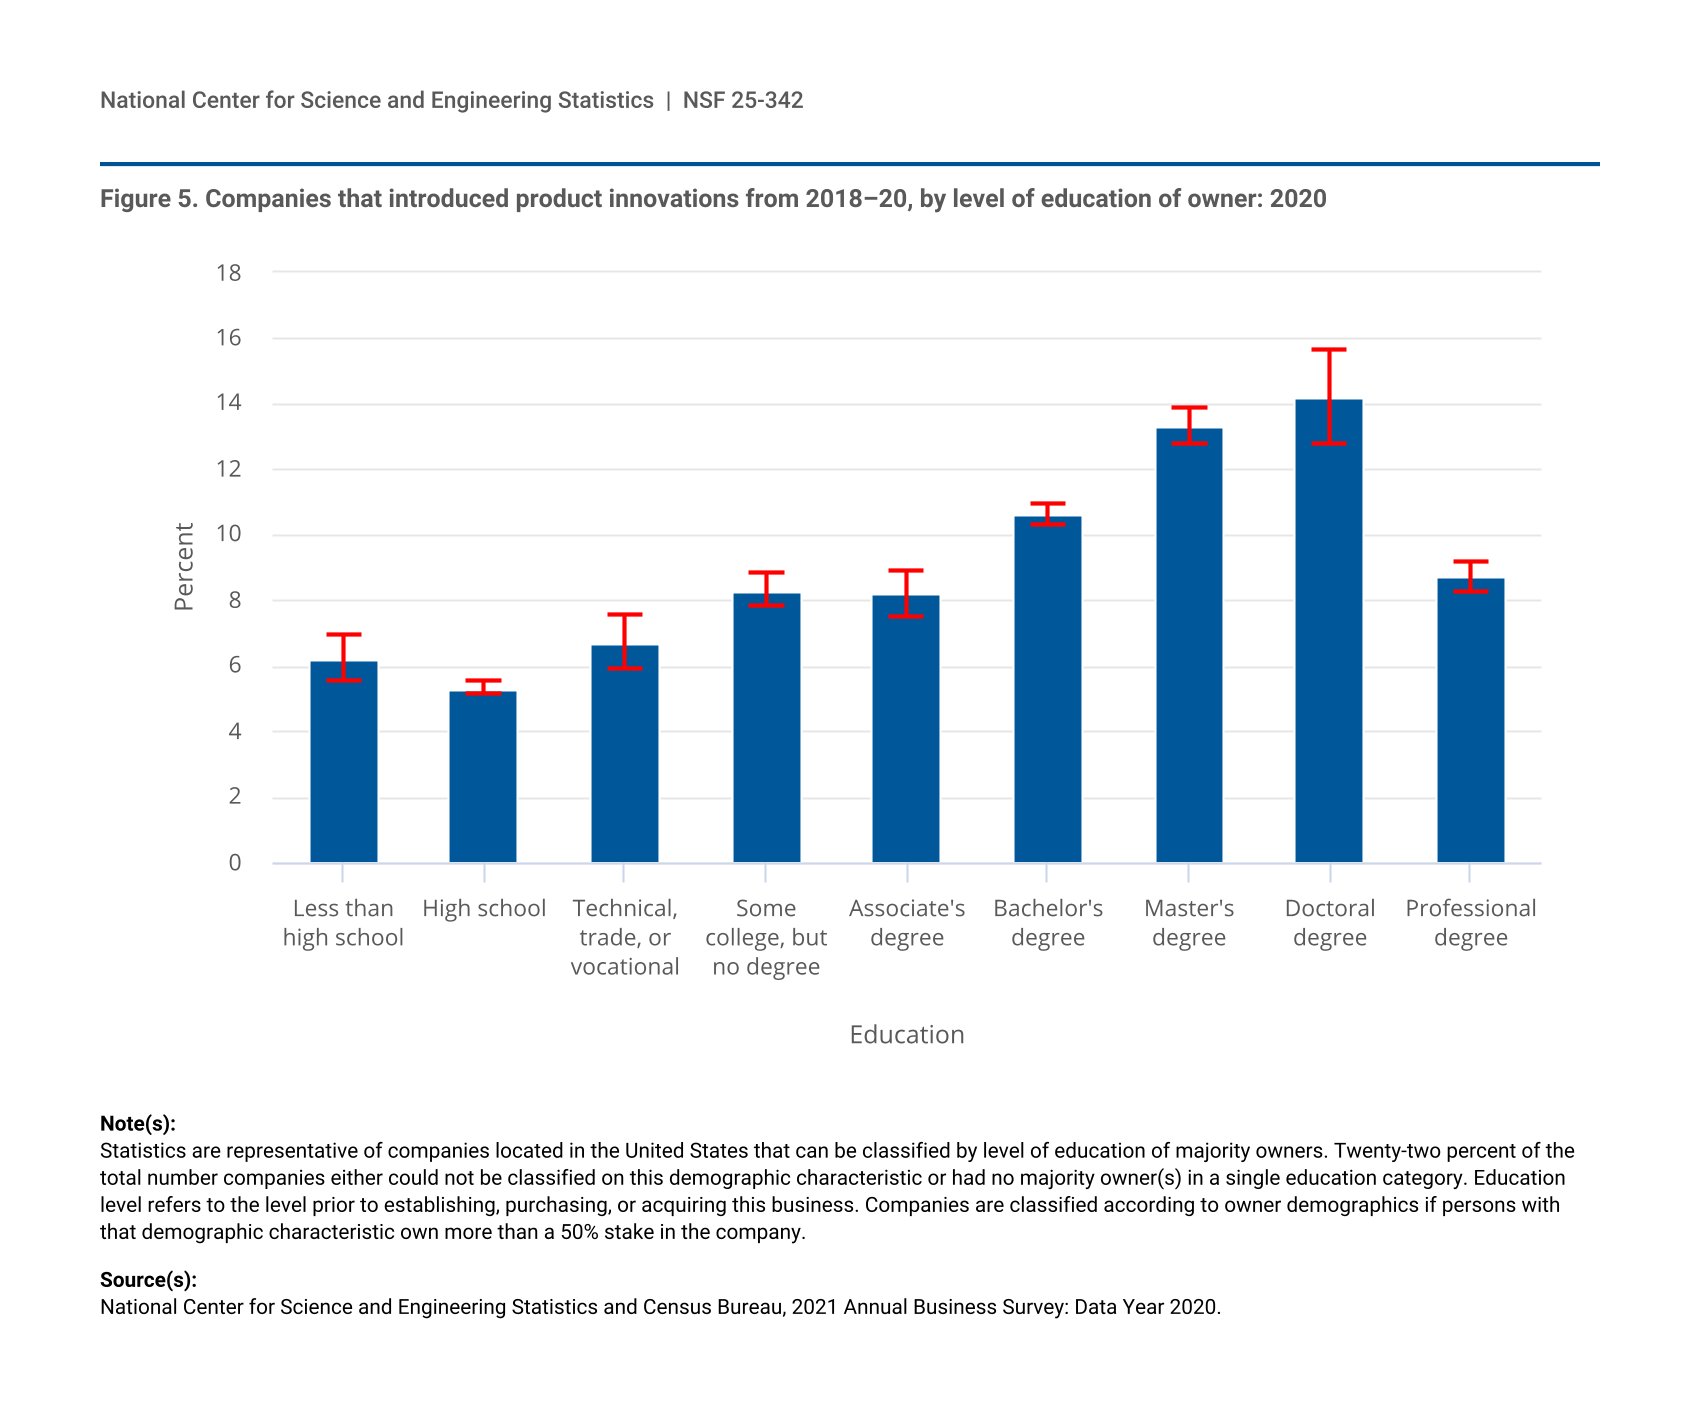
Education of Owner
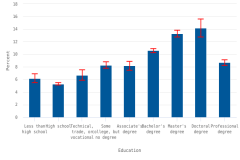
Figure 5 shows the estimated rates of product innovation along with 90% confidence intervals for businesses with owners with different levels of educational attainment prior to owning the business. Product innovation rates were lowest for businesses owned by persons whose highest level of education was high school (5.3%) and highest for businesses whose majority owners had master’s (13.3%) or doctoral (14.2%) degrees. Product innovation rates were similar for businesses whose owners had some college education but no degree (8.3%) and those whose owners had associate's degrees (8.2%). Businesses whose owners’ highest level of education was a professional degree (e.g., MD, DDS, or JD) reported product innovation rates that were lower than businesses owned by bachelor’s, master’s, or doctoral degree holders.
| Education | Product innovation rate | Margin of error |
|---|---|---|
| Less than high school | 6.2 | 0.73 |
| High school | 5.3 | 0.21 |
| Technical, trade, or vocational | 6.7 | 0.81 |
| Some college, but no degree | 8.3 | 0.49 |
| Associate's degree | 8.2 | 0.70 |
| Bachelor's degree | 10.6 | 0.33 |
| Master's degree | 13.3 | 0.54 |
| Doctoral degree | 14.2 | 1.44 |
| Professional degree | 8.7 | 0.44 |
Statistics are representative of companies located in the United States that can be classified by level of education of majority owners. Twenty-two percent of the total number companies either could not be classified on this demographic characteristic or had no majority owner(s) in a single education category. Education level refers to the level prior to establishing, purchasing, or acquiring this business. Companies are classified according to owner demographics if persons with that demographic characteristic own more than a 50% stake in the company.
National Center for Science and Engineering Statistics and Census Bureau, 2021 Annual Business Survey: Data Year 2020.
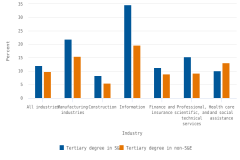
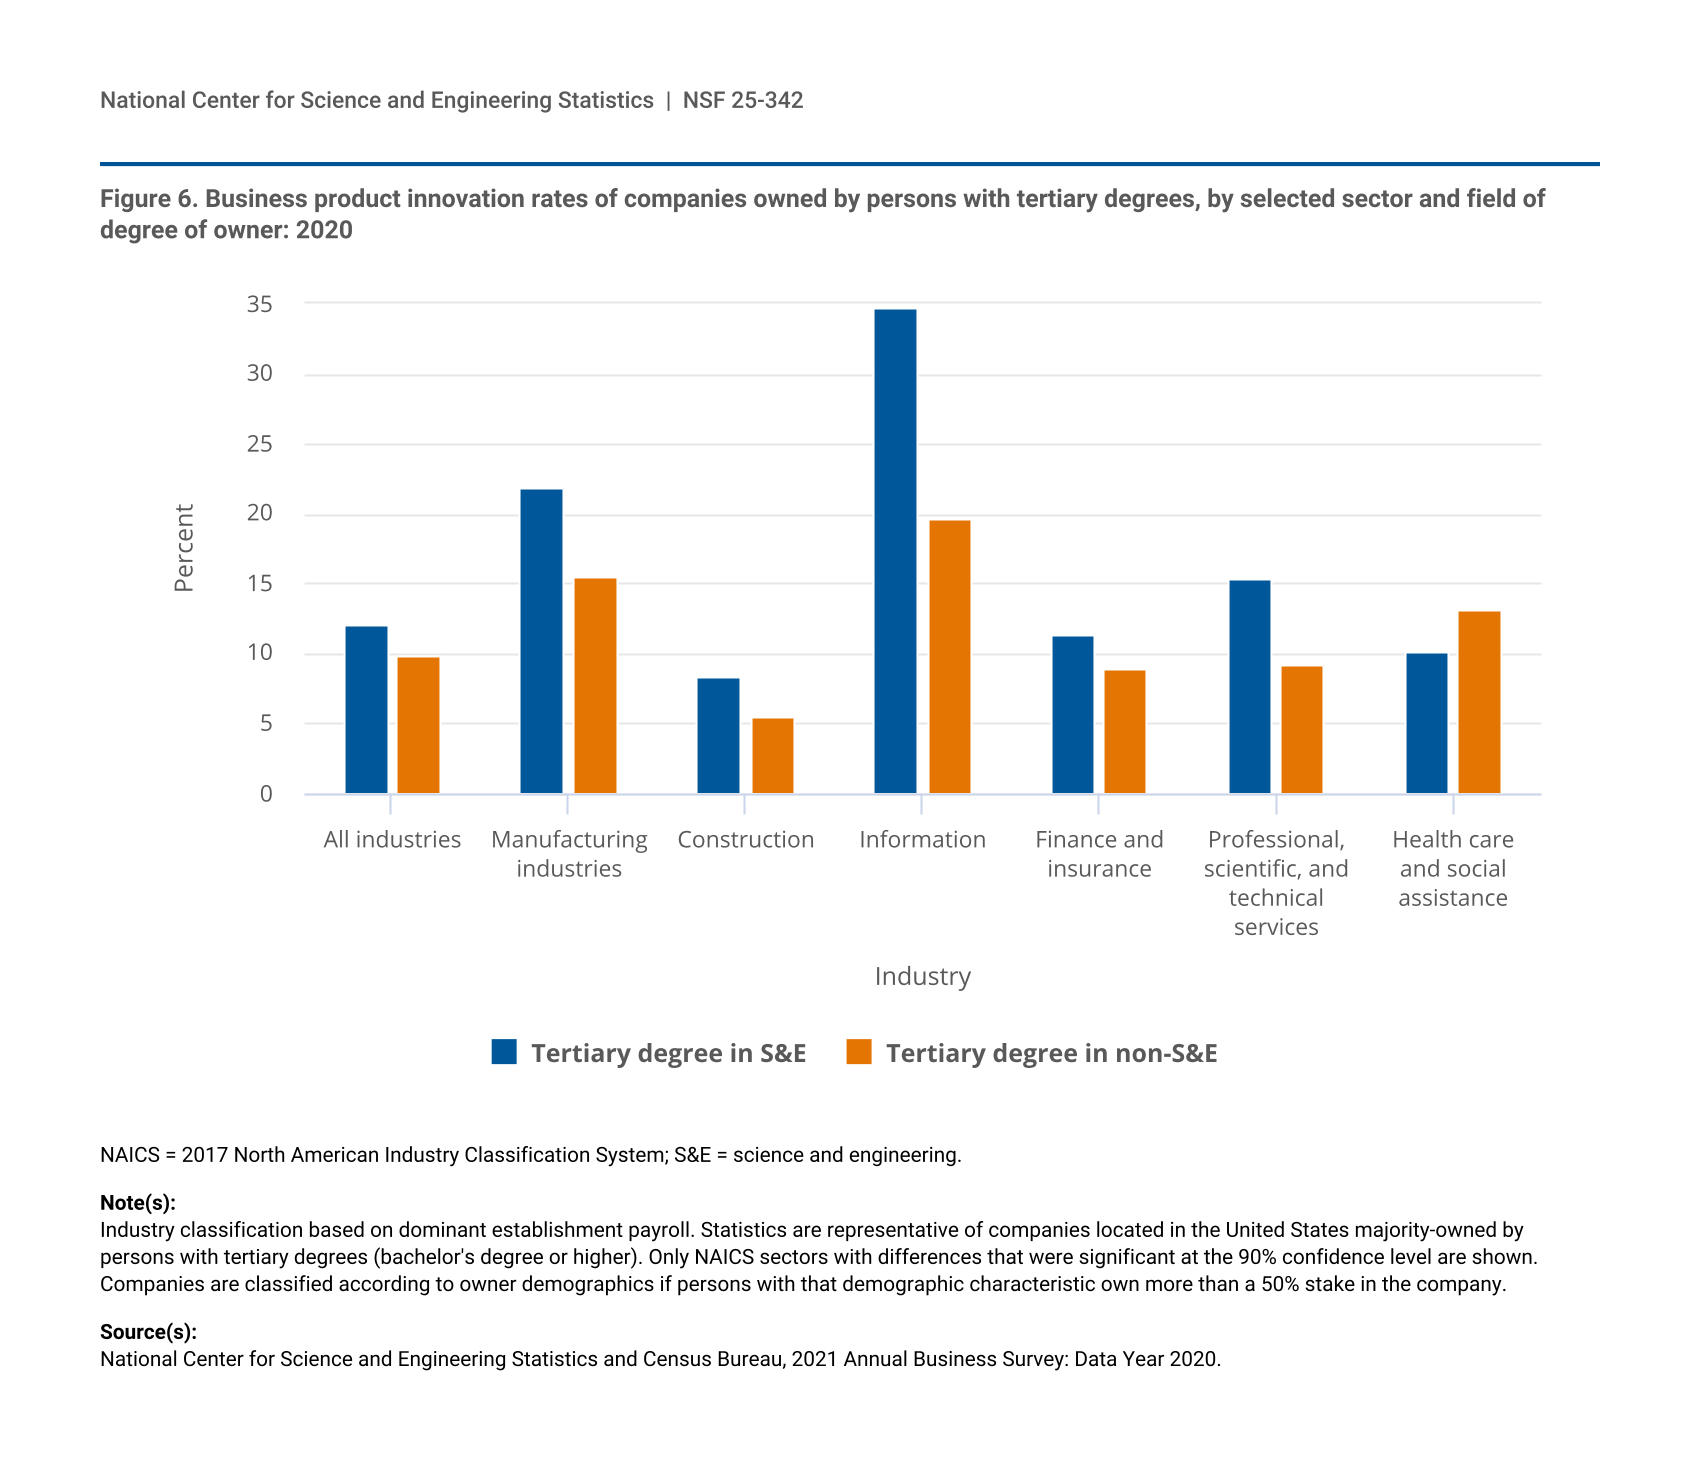
For businesses owned by persons with tertiary degrees (bachelor’s degree or higher), product innovation rates are higher for those owned by science and engineering (S&E) degree holders (figure 6). The difference is largest for the information sector (NAICS 51), where companies owned by S&E degree holders have innovation rates of 34.7%, compared with 19.7% for companies owned by non-S&E degree holders. An exception to this pattern is the health care and social assistance sector (NAICS 62), in which businesses owned by non-S&E degree holders reported higher rates of product innovation than those owned by S&E degree holders. Unlike other sectors, in this sector, S&E degree holders make up the vast majority of business owners.
| Industry | Tertiary degree in S&E | Tertiary degree in non-S&E |
|---|---|---|
| All industries | 12.0 | 9.8 |
| Manufacturing industries | 21.9 | 15.5 |
| Construction | 8.4 | 5.5 |
| Information | 34.7 | 19.7 |
| Finance and insurance | 11.3 | 8.9 |
| Professional, scientific, and technical services | 15.4 | 9.2 |
| Health care and social assistance | 10.2 | 13.1 |
NAICS = 2017 North American Industry Classification System; S&E = science and engineering.
Industry classification based on dominant establishment payroll. Statistics are representative of companies located in the United States majority-owned by persons with tertiary degrees (bachelor's degree or higher). Only NAICS sectors with differences that were significant at the 90% confidence level are shown. Companies are classified according to owner demographics if persons with that demographic characteristic own more than a 50% stake in the company.
National Center for Science and Engineering Statistics and Census Bureau, 2021 Annual Business Survey: Data Year 2020.
Company counts and percentage of companies reporting product innovation by demographic characteristics have not been previously released (table 1 through table 6). Researchers are encouraged to explore these tables and ABS microdata further to improve the understanding of how various demographic factors contribute to product innovation and how these factors may interact with each other.
r = relative standard error > 50%.
NAICS = 2017 North American Industry Classification System.
Detail may not add to total because of rounding. Industry classification based on dominant establishment payroll. Statistics are representative of companies located in the United States. Companies are classified according to owner demographics if persons with that demographic characteristic own more than a 50% stake in the company.
National Center for Science and Engineering Statistics and Census Bureau, 2021 Annual Business Survey: Data Year 2020.
i = > 50% of the estimate is a combination of imputation and reweighting to account for nonresponse; r = relative standard error > 50%.
NAICS = 2017 North American Industry Classification System.
Detail may not add to total because of rounding. Industry classification based on dominant establishment payroll. Statistics are representative of companies located in the United States. Companies are classified according to owner demographics if persons with that demographic characteristic own more than a 50% stake in the company.
National Center for Science and Engineering Statistics and Census Bureau, 2021 Annual Business Survey: Data Year 2020.
r = relative standard error > 50%.
NAICS = 2017 North American Industry Classification System; S&E = science and engineering.
Detail may not add to total because of rounding. Industry classification based on dominant establishment payroll. Statistics are representative of companies located in the United States. Companies are classified according to owner demographics if persons with that demographic characteristic own more than a 50% stake in the company.
National Center for Science and Engineering Statistics and Census Bureau, 2021 Annual Business Survey: Data Year 2020.
Data Source, Limitations, and Availability
The ABS is a sample survey, designed to collect a wide range of data on business research and development, intellectual property, company and primary owner characteristics, and innovation activities in the United States. The ABS was developed and is cosponsored by the National Center for Science and Engineering Statistics (NCSES) within the National Science Foundation and by the Census Bureau. The statistics from the survey are based on a sample, and as such, they are subject to both sampling and nonsampling errors (see the Technical Notes in the data tables report Annual Business Survey: 2021 (Data Year 2020).
For the 2021 ABS, a total of 300,000 employer companies were sampled to represent the population of 4.9 million employer companies. For the 2021 ABS, the unit response rate was 68.8%.
Statistics presented here from the ABS differ from statistics produced by the Census Bureau on the demographics of business owners; statistics shown here represent only for-profit businesses, whereas the Census statistics represent all businesses regardless of tax status.
The full set of data tables on innovation, R&D, and company demographics from this survey are available in the report Annual Business Survey: 2021 (Data Year 2020). Individual data tables and tables with relative standard errors and imputation rates from the 2021 survey are available from NCSES on request. The most recent data and methodology are also available at the survey’s homepage (https://ncses.nsf.gov/surveys/annual-business-survey).
The estimates in this InfoBrief are based on responses from a sample of the population and may differ from actual values because of sampling variability or other factors. As a result, apparent differences between the estimates for two or more groups may not be statistically significant. All comparative statements in this InfoBrief have undergone statistical testing and are significant at the 90% confidence level unless otherwise noted. The ABS used the extended delete-a-group jackknife variance estimator.
Restricted microdata from the ABS are available at any of the 33 secure Federal Statistical Research Data Centers (FSRDCs) administered by the Census Bureau. To learn more about the FSRDCs and how to apply, please visit the Census page on research with restricted-use data. Assistance from an FSRDC administrator will greatly reduce the need for future revisions to applications. For general questions, including appropriate FSRDC administrator contact information, please reach out to the Census Bureau at ced.fsrdc.info@census.gov.
NCSES has reviewed this product for unauthorized disclosure of confidential information and approved its release (NCSES-DRN25-035).
Notes
1 The most recent methodology and tabulated data for the Annual Business Survey are available at https://ncses.nsf.gov/surveys/annual-business-survey.
2 ABS questions are based on internationally recognized definitions and guidelines for measuring innovation. Organisation for Economic Co-operation and Development (OECD) and Statistical Office of the European Communities (Eurostat). 2018. Oslo Manual: Guidelines for Collecting and Interpreting Innovation Data, 4th edition, Paris.
3 National Center for Science and Engineering Statistics (NCSES). 2025. Relationship Between Product Innovation and Business Owner Demographics Varies by Industry. NSF 25-343. Alexandria, VA: U.S. National Science Foundation. Available at https://ncses.nsf.gov/pubs/nsf25343.
4 The remaining 3% of businesses were equally owned by persons who had owned prior businesses and persons who had not.
5 Restricted microdata from the ABS are available at any of the 33 secure Federal Statistical Research Data Centers (FSRDCs) administered by the Census Bureau. To learn more about the FSRDCs and how to apply, please visit the Census page on research with restricted-use data (https://www.census.gov/topics/research/guidance/restricted-use-microdata.html). Assistance from an FSRDC administrator will greatly reduce the need for future revisions to applications. For general questions, including appropriate FSRDC administrator contact information, please reach out to the Census Bureau at ced.fsrdc.info@census.gov.
6 See https://www.census.gov/library/stories/2023/01/who-owns-americas-businesses.html.
Suggested Citation
National Center for Science and Engineering Statistics (NCSES). 2025. Relationships Between Business Owner Age, Education, and Experience and Product Innovation. NSF 25-342. Alexandria, VA: U.S. National Science Foundation. Available at https://ncses.nsf.gov/pubs/nsf25342.
Contact Us
National Center for Science and Engineering Statistics
Directorate for Social, Behavioral and Economic Sciences
U.S. National Science Foundation
2415 Eisenhower Avenue, Suite W14200
Alexandria, VA 22314
Tel: (703) 292-8780
FIRS: (800) 877-8339
TDD: (800) 281-8749
E-mail: ncsesweb@nsf.gov