 An official website of the United States government

Baccalaureate Origins of Underrepresented Minority Research Doctorate Recipients
The educational pathways of doctorate recipients in the United States differ in many ways by race and ethnicity. Despite steady growth in educational attainment, Blacks, Hispanics, and American Indians and Alaska Natives (AIANs) remain underrepresented among U.S. bachelor’s, master’s, and doctoral degree recipients. The persistence of this imbalance has driven greater investment in initiatives focused on closing these gaps and the identification of best practices within successful academic programs. Extending prior analyses, this InfoBrief examines the baccalaureate origins of doctorate recipients from 2010–20 by citizenship status, race, and ethnicity. Black, Hispanic, and AIAN doctorate recipients from 2010–20 disproportionately earned a bachelor’s degree from minority-serving institutions, underscoring the importance of these colleges and universities for enhancing the diversity of the U.S. research enterprise. Although most Black and Hispanic doctorate recipients earned a bachelor’s degree from public colleges and universities, a higher proportion of Black and Hispanic students with undergraduate degrees from private colleges and universities went on to earn a research doctorate.
Baccalaureate Origins of U.S. Doctorate Recipients
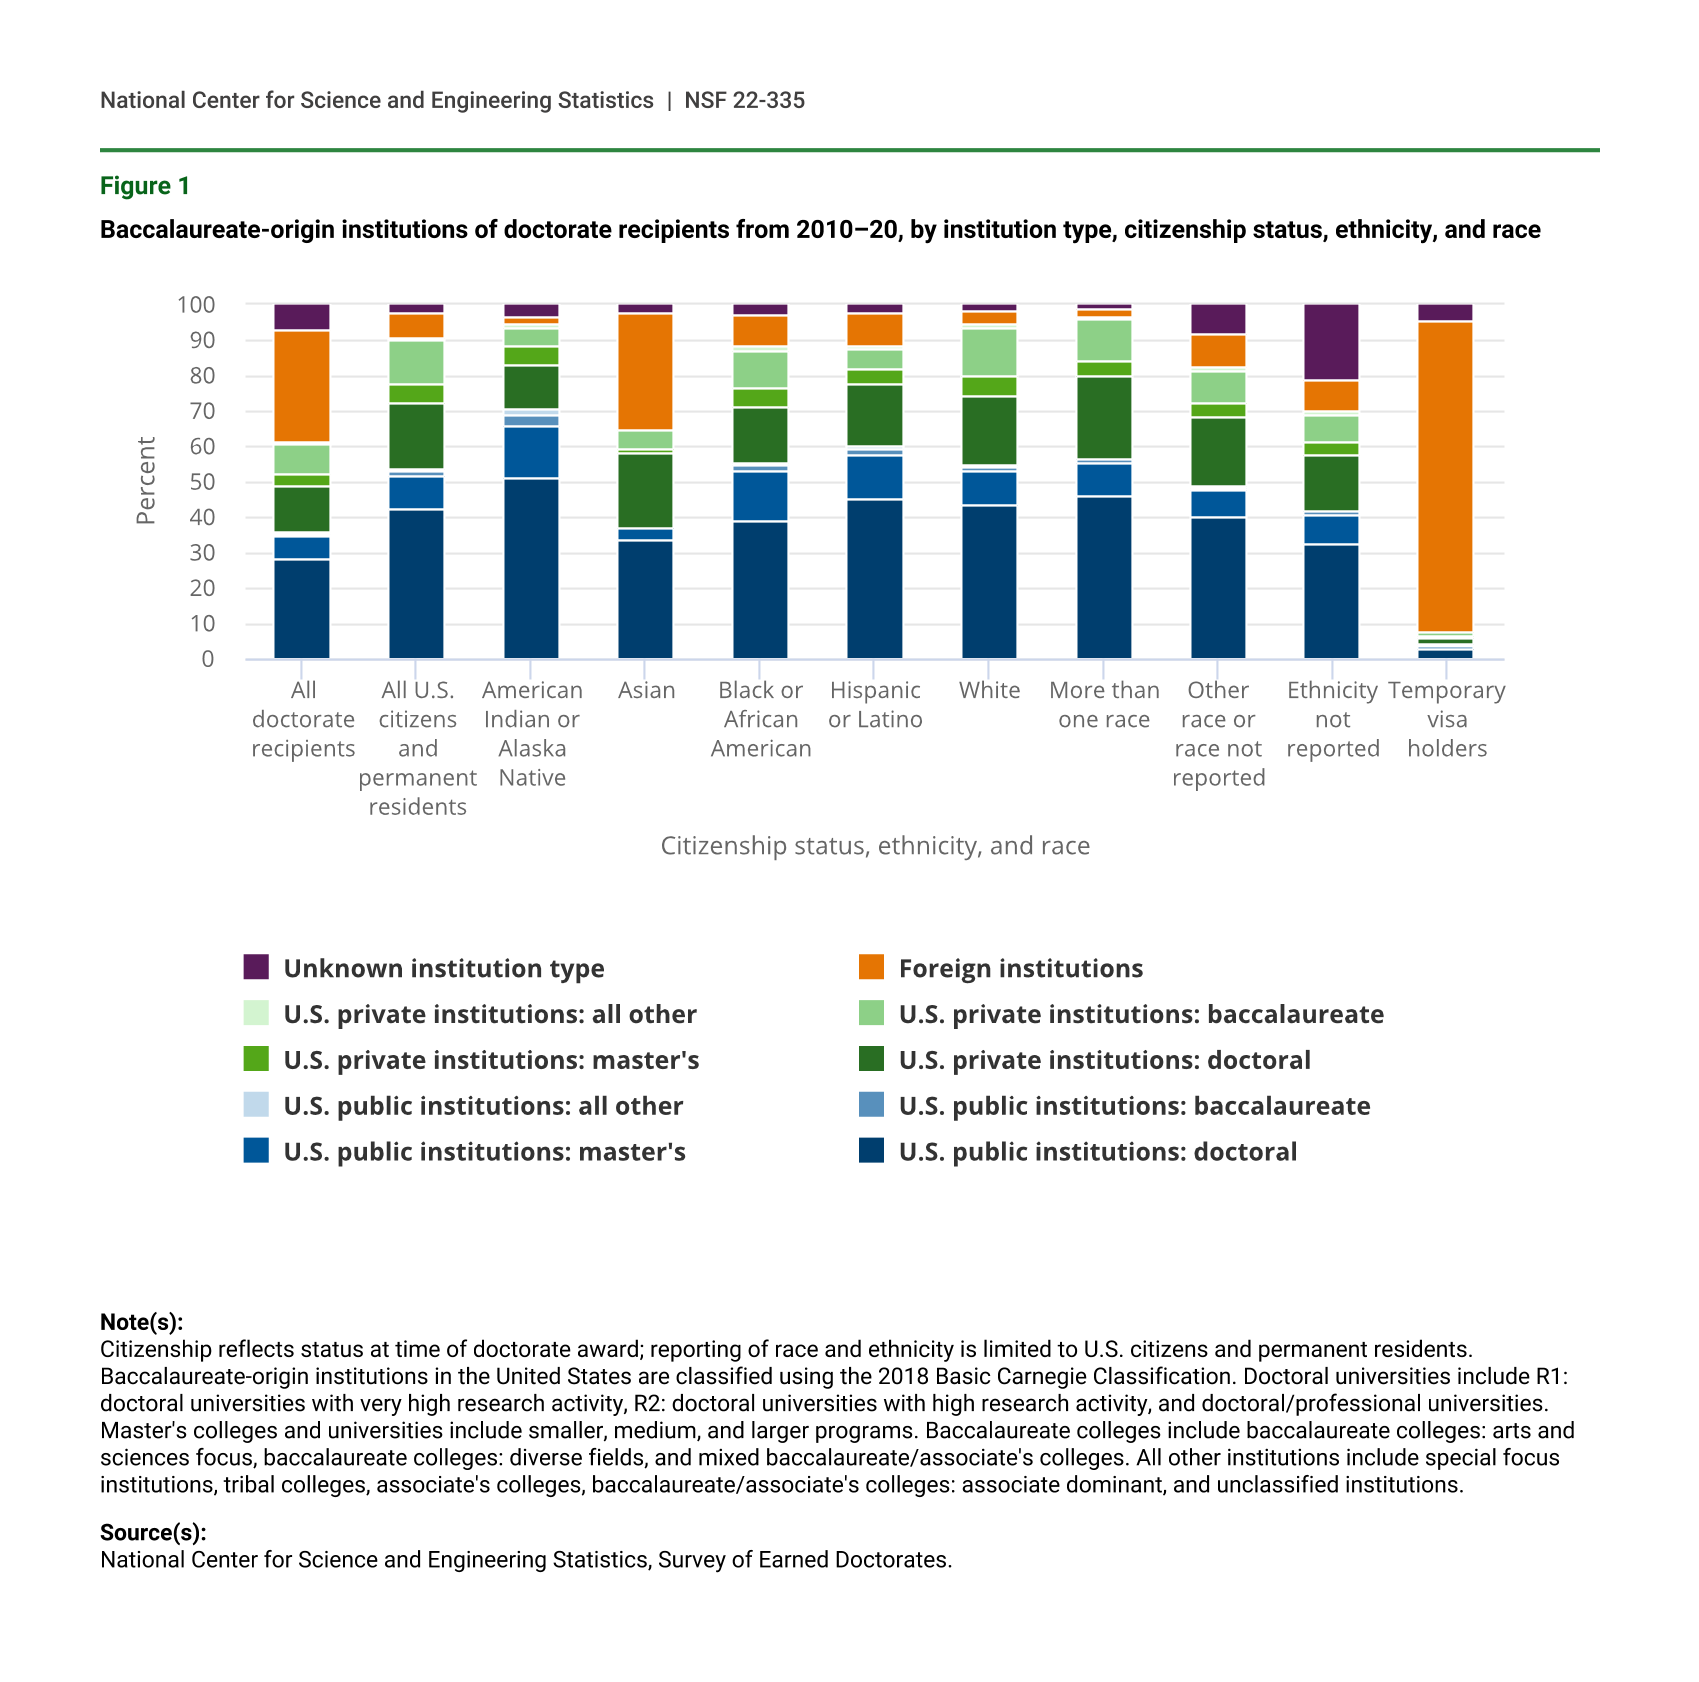
Figure 1 shows the baccalaureate origins of doctorate recipients from 2010–20 by type of institution, and it highlights several key differences by citizenship status, race, and ethnicity. For this analysis, race and ethnicity is limited to U.S. citizens and permanent residents; citizenship reflects status at time of doctorate award. Although just over half of all U.S. citizens and permanent residents earned a bachelor’s degree from a public college or university in the United States, a substantially greater percentage of AIAN doctorate recipients (70.6%) and Hispanic or Latino doctorate recipients (60.2%) earned a bachelor’s degree from public U.S. institutions. White doctorate recipients and those reporting more than one race disproportionately earned a bachelor’s degree from private U.S. institutions (39.9% and 40.0%, respectively). Almost a third (32.4%) of Asian doctorate recipients and the vast majority (87.6%) of doctorate recipients with temporary visas earned a bachelor’s degree from non-U.S. institutions.
Baccalaureate-origin institutions of doctorate recipients from 2010–20, by institution type, citizenship status, ethnicity, and race
| Citizenship status, ethnicity, and race | U.S. public institutions: doctoral | U.S. public institutions: master's | U.S. public institutions: baccalaureate | U.S. public institutions: all other | U.S. private institutions: doctoral | U.S. private institutions: master's | U.S. private institutions: baccalaureate | U.S. private institutions: all other | Foreign institutions | Unknown institution type |
|---|---|---|---|---|---|---|---|---|---|---|
| All doctorate recipients | 28.4 | 6.3 | 0.8 | 0.3 | 13.2 | 3.5 | 8.1 | 0.5 | 31.6 | 7.3 |
| All U.S. citizens and permanent residents | 42.3 | 9.4 | 1.2 | 0.4 | 19.4 | 5.2 | 11.9 | 0.8 | 7.3 | 2.2 |
| American Indian or Alaska Native | 51.0 | 15.1 | 2.7 | 1.9 | 12.2 | 5.4 | 5.5 | 1.2 | 1.7 | 3.3 |
| Asian | 33.7 | 3.1 | 0.2 | 0.1 | 21.1 | 1.3 | 5.0 | 0.5 | 32.4 | 2.6 |
| Black or African American | 38.9 | 14.3 | 1.8 | 0.5 | 15.8 | 5.2 | 10.6 | 1.2 | 9.0 | 2.7 |
| Hispanic or Latino | 45.1 | 12.3 | 2.1 | 0.6 | 17.2 | 4.1 | 6.0 | 0.8 | 9.4 | 2.3 |
| White | 43.6 | 9.4 | 1.2 | 0.4 | 19.7 | 5.8 | 13.6 | 0.8 | 3.9 | 1.5 |
| More than one race | 46.1 | 9.1 | 1.1 | 0.3 | 23.4 | 4.2 | 11.7 | 0.8 | 2.5 | 1.0 |
| Other race or race not reported | 40.1 | 7.8 | 0.6 | 0.3 | 19.3 | 4.4 | 8.9 | 1.0 | 9.4 | 8.2 |
| Ethnicity not reported | 32.4 | 8.1 | 1.1 | 0.3 | 15.6 | 3.7 | 7.9 | 0.8 | 8.9 | 21.3 |
| Temporary visa holders | 3.2 | 0.6 | 0.1 | 0.0 | 2.0 | 0.3 | 1.2 | 0.1 | 87.6 | 4.9 |
Note(s):
Citizenship reflects status at time of doctorate award; reporting of race and ethnicity is limited to U.S. citizens and permanent residents. Baccalaureate-origin institutions in the United States are classified using the 2018 Basic Carnegie Classification. Doctoral universities include R1: doctoral universities with very high research activity, R2: doctoral universities with high research activity, and doctoral/professional universities. Master's colleges and universities include smaller, medium, and larger programs. Baccalaureate colleges include baccalaureate colleges: arts and sciences focus, baccalaureate colleges: diverse fields, and mixed baccalaureate/associate's colleges. All other institutions include special focus institutions, tribal colleges, associate's colleges, baccalaureate/associate's colleges: associate dominant, and unclassified institutions.
Source(s):
National Center for Science and Engineering Statistics, Survey of Earned Doctorates.
In addition to differences in institutional control (public or private) of baccalaureate-origin schools, there are differences by race and ethnicity in terms of the Carnegie Classification of these schools. AIAN, Black, and Hispanic doctorate recipients disproportionately earned a bachelor’s degree from public master’s institutions (15.1%, 14.3%, and 12.3%, respectively, versus 9.4% for all U.S. citizens and permanent residents). White doctorate recipients had the highest proportion of bachelor’s degrees from private baccalaureate colleges (13.6%) and were the only group above the 11.9% average for all U.S. citizens and permanent residents to earn a degree from a private baccalaureate college.
Of all doctorate recipients who earned their undergraduate degrees in the United States, about half (49.0%) of White doctorate recipients earned a bachelor’s degree from R1 doctoral universities, while only 36.2% of Black and 43.2% of AIAN doctorate recipients earned a bachelor’s degree from these very high research activity universities (table 1). In contrast, over three-quarters (76.8%) of Asian doctoral recipients who earned their undergraduate degrees in the United States earned a bachelor’s degree from R1 doctoral universities. Black and AIAN doctoral recipients had the highest percentages of bachelor’s degrees from other doctoral universities (25.6% and 23.1%, respectively) among all ethnic or racial groups.
Baccalaureate-origin institutions of doctorate recipients from 2010–20, by citizenship status, ethnicity, race, and institution characteristics
AIAN = American Indian or Alaska Native.
Note(s):
Baccalaureate-origin institutions in the United States are classified using the 2018 Basic Carnegie Classification. R1: doctoral universities are a single category of institution in the Carnegie classification with very high research activity. Other doctoral universities include the R2: doctoral universities with high research activity and doctoral/professional universities. Master's colleges and universities include smaller, medium, and larger programs. Baccalaureate colleges include baccalaureate colleges: arts and sciences focus, baccalaureate colleges: diverse fields, and mixed baccalaureate/associate's colleges. All other colleges include special focus institutions, tribal colleges, associate’s colleges, and unclassified institutions. High-Hispanic-enrollment institutions are defined as those colleges and universities where at least 25% of the total undergraduate enrollment is Hispanic. High-AIAN-enrollment institutions are defined as those colleges and universities where at least 10% of the total undergraduate enrollment is American Indian or Alaska Native.
Source(s):
National Center for Science and Engineering Statistics, Survey of Earned Doctorates.
Substantial numbers of doctorate recipients from all three underrepresented groups (Hispanic, Black, and AIAN) earned a bachelor’s degree from minority-serving institutions. Of those who earned a bachelor’s degree in the United States, 42.4% of Hispanic doctorate recipients earned a bachelor’s degree from a high-Hispanic-enrollment (HHE) institution, 25.7% of Black doctorate recipients earned a bachelor’s degree from a historically Black college or university (HBCU), and 6.8% of AIAN doctorate recipients earned a bachelor’s degree from a tribal college or high-AIAN enrollment (HAIANE) institution. An additional 19.2% of AIAN doctorate recipients earned a bachelor’s degree from an HHE institution.
The relative importance of public and minority-serving institutions within the educational paths of underrepresented minority doctorate recipients is consistent with the overall postsecondary student enrollment patterns of U.S. citizens and permanent residents and highlights the role of minority-serving institutions as steppingstones on the path toward a research doctorate for underrepresented minority (URM) students.,
Top Baccalaureate Origins of URM Doctorate Recipients
Top 50 U.S. baccalaureate-origin institutions of Black or African American doctorate recipients from 2010–20, by institutional control, 2018 Carnegie classification, and HBCU status
na = not applicable.
HBCU = historically Black college and university.
Note(s):
Includes only U.S. citizens and permanent residents. Institutions with the same number of doctorate recipients are listed alphabetically. R1: doctoral universities are those with very high research activity. R2: doctoral universities are institutions with high research activity.
Source(s):
National Center for Science and Engineering Statistics, Survey of Earned Doctorates.
Table 3 presents the top 10 U.S. baccalaureate-origin institutions of Black doctorate recipients by broad field of doctorate. Although the top 10 institutions from table 2 are well represented in table 3, significant variation is seen across these broad field lists. Five institutions that were not in the overall top 50 list appear in the broad field top 10 lists: Alabama A&M University (physical sciences and earth sciences), Georgia Institute of Technology (engineering as well as mathematics and computer sciences), CUNY City College (engineering), Massachusetts Institute of Technology (engineering), and Princeton University (humanities and arts). Two institutions—Howard University and Florida A&M University—appear in the top 10 institutions for all eight broad fields.
Public institutions outnumber private institutions in all fields except for psychology and social sciences and for humanities and arts. Engineering is the only field where non-HBCUs outnumber HBCUs.
Top 10 U.S. baccalaureate-origin institutions of Black or African American doctorate recipients from 2010–20, by broad field of doctorate, institutional control, 2018 Carnegie classification, and HBCU status
na = not applicable.
HBCU = historically Black college and university.
a Includes agricultural sciences and natural resources; biological and biomedical sciences; and health sciences.
b Includes other non-science and engineering fields not shown separately.
Note(s):
Includes only U.S. citizens and permanent residents. Includes only U.S. institutions. Institutions with the same number of doctorate recipients are listed alphabetically. R1: doctoral universities are those with very high research activity. R2: doctoral universities are institutions with high research activity.
Source(s):
National Center for Science and Engineering Statistics, Survey of Earned Doctorates.
Among Hispanic doctorate recipients from 2010–20, approximately 4 of every 10 (42.4%) earned a bachelor’s degree from one of the 50 institutions listed in table 4. The top two baccalaureate origins of Hispanic doctorate recipients were from the University of Puerto Rico system and nearly one-third (32.3%) of all Hispanic doctorate recipients earned a bachelor’s degree from institutions in Puerto Rico, California, Texas, or Florida. Among the top 50 institutions, 38 were public institutions, and 37 were R1 doctoral universities; public R1 doctoral universities accounted for half of the top 50 institutions. Only two of the top 50 institutions were baccalaureate colleges (both University of Puerto Rico institutions), five were master’s institutions, and six were R2 doctoral universities. All the non-R1 institutions were public, and 26 of the top 50 institutions were HHE institutions.
Top 50 U.S. baccalaureate-origin institutions of Hispanic or Latino doctorate recipients from 2010–20, by institutional control, 2018 Carnegie classification, and HHE status
na = not applicable.
HHE = high-Hispanic-enrollment institution.
Note(s):
Includes only U.S. citizens and permanent residents. Institutions with the same number of doctorate recipients are listed alphabetically. R1: doctoral universities are those with very high research activity. R2: doctoral universities are institutions with high research activity.
Source(s):
National Center for Science and Engineering Statistics, Survey of Earned Doctorates.
Table 5 presents the top 10 U.S. baccalaureate-origin institutions of Hispanic doctorate recipients by broad field of doctorate. Again, public R1 doctoral universities dominate the top 10 baccalaureate-origins by broad field, accounting for at least half of the top 10 institutions in each field. HHE institutions are also well represented in these top 10 ranks, constituting 8 of the top 10 in education, seven of the top 10 in life sciences, and 6 of the top 11 in engineering and in mathematics and computer sciences. One of two University of Puerto Rico institutions—Mayaguez or Rio Piedras—occupy the top rank in all broad fields except in education, where the University of Texas, Austin occupies the top position.
Among AIAN doctorate recipients from 2010–20, 45.4% earned a bachelor’s degree from an institution listed in table 6, and 20.1% earned a bachelor’s degree from one of the top 10 AIAN baccalaureate institutions. These percentages are larger than the corresponding percentages for Hispanics (42.4% and 18.5%) and Blacks (30.9% and 11.2%), indicating that the pathways of AIAN doctorate recipients may be less diverse than those of other URM doctorate recipients.
Of these 53 institutions, 45 are public and 33 are R1 doctoral universities—more than half (28) are public R1 doctoral universities, making this the dominant institution type. Only one institution is a baccalaureate college (Fort Lewis College), seven are master’s institutions, and nine are R2 doctoral universities. Seven of the top 10 institutions are from three states—Oklahoma, New Mexico, and Arizona. Of the top 53 institutions, one is a tribal college, and six others are high-AIAN-enrollment (HAIANE) institutions.
Top 10 U.S. baccalaureate-origin institutions of Hispanic or Latino doctorate recipients from 2010–20, by broad field of doctorate, institutional control, 2018 Carnegie classification, and HHE status
na = not applicable.
HHE = high-Hispanic-enrollment institution.
a Includes agricultural sciences and natural resources; biological and biomedical sciences; and health sciences.
b Includes other non-science and engineering fields not shown separately.
Note(s):
Includes only U.S. citizens and permanent residents. Includes only U.S. institutions. Institutions with the same number of doctorate recipients are listed alphabetically. R1: doctoral universities are those with very high research activity. R2: doctoral universities are institutions with high research activity.
Source(s):
National Center for Science and Engineering Statistics, Survey of Earned Doctorates.
Top 50 U.S. baccalaureate-origin institutions of American Indian or Alaska Native doctorate recipients from 2010–20, by institutional control, 2018 Carnegie classification, and HAIANE status
na = not applicable.
AIAN = American Indian or Alaska Native; HAIANE = high-AIAN-enrollment institution.
Note(s):
Includes only U.S. citizens and permanent residents. Institutions with the same number of doctorate recipients are listed alphabetically. R1: doctoral universities are those with very high research activity. R2: doctoral universities are institutions with high research activity.
Source(s):
National Center for Science and Engineering Statistics, Survey of Earned Doctorates.
Table 7 shows the top U.S. baccalaureate origins of AIAN doctorate recipients by broad field. To reduce the risk of individual disclosure, this table only lists institutions where sufficient number of AIAN bachelor’s degree recipients went on to earn a U.S. research doctorate in the specified field between 2010 and 2020. Twelve institutions met these criteria within psychology and social sciences, 7 in education, and 6 in life sciences. Oklahoma State University, Stillwater and the University of Oklahoma, Norman were the only institutions listed in four or more broad fields. As with table 6, more than half of the institutions listed (16 of 29) are public R1 doctoral universities.
Top U.S. baccalaureate-origin institutions of American Indian or Alaska Native doctorate recipients from 2010–20, by broad field of doctorate, institutional control, 2018 Carnegie classification, and HAIANE status
na = not applicable.
AIAN = American Indian or Alaska Native; HAIANE = high-AIAN-enrollment institution.
a Includes agricultural sciences and natural resources; biological and biomedical sciences; and health sciences.
Note(s):
Includes only U.S. citizens and permanent residents. Includes only U.S. institutions with 5 or more graduates who earned a doctorate from 2010–20. Institutions with the same number of doctorate recipients are listed alphabetically. R1: doctoral universities are those with very high research activity. R2: doctoral universities are institutions with high research activity. Physical sciences and earth sciences, mathematics and computer sciences, and other non-science and engineering fields are not shown in this table due to the small number of AIAN doctorate recipients.
Source(s):
National Science Foundation, National Center for Science and Engineering Statistics, Survey of Earned Doctorates.
Top Baccalaureate-Origins of Black and Hispanic Doctorate Recipients by Institutional-Yield Ratio
Because of the larger pool of potential doctorate recipients, rankings of baccalaureate-origin institutions based on the number of doctorate recipients who attended a particular institution may overemphasize the role of larger institutions and understate the contributions of smaller, non-R1 institutions in the production of doctorate recipients. The institutional-yield ratio (IYR) metric was created to address this disparity., The IYR for a baccalaureate-origin institution is calculated as the number of graduates who earned a research doctorate over a given period (2010–20 in this analysis), divided by the number of bachelor’s degrees conferred by that institution over the period 9 years earlier (i.e., from 2001–11 for this analysis). This figure is then multiplied by 100 to express the term as a percentage or ratio. For example, if an institution has an IYR of 15.0 from 2010–20 it is estimated that 15% of that institution’s baccalaureate conferrals (or 15 out of every 100) received a doctorate within nine years of earning a bachelor’s degree.
Table 8 presents the top 50 baccalaureate-origin institutions for Black doctorate recipients from 2010–20, ranked by IYR. With the data normalized to control for the number of bachelor’s degrees awarded by each institution, a different picture emerges. Public institutions and HBCUs, which predominated in table 2, are far fewer in number. Private colleges and universities become much more prominent and only one of the top 10 institutions in table 2 (Spelman College, rank 2) remains in the top 10 (rank 10) in table 8. When ranked by IYR, only 11 public institutions are listed in the top 50, and private institutions occupy the top 13 places in table 8. The number of Carnegie classified baccalaureate colleges increased from 3 in table 2 to 11 in table 8, including 5 of the top 10 IYRs. The number of HBCUs represented in the top 50 rankings declined from 19 to 7.
Top 50 U.S. baccalaureate-origin institutions of Black or African American doctorate recipients from 2010–20, by institutional-yield ratio, institutional control, 2018 Carnegie classification, and HBCU status
HBCU = historically Black college and university.
a The institutional-yield ratio is defined as the number of 2010–20 Black doctorate recipients who received bachelor's degrees from an institution divided by the number of bachelor's degrees awarded to Blacks 9 years earlier (2001–2011) from that same institution. The ratio is expressed as the number of Black doctorates per 100 bachelor's degrees awarded to Black students. For example, 82 Black doctorate recipients over the 2010–20 period reported earning bachelor's degrees from the Massachusetts Institute of Technology (MIT), and a total of 691 Black students earned bachelor's degrees from MIT between 2001 and 2011. Thus, MIT's institutional-yield ratio for the 2010–20 period is 11.9 Black doctorate recipients per 100 bachelor's degrees awarded to Black students at MIT 9 years earlier.
Note(s):
Includes only U.S. citizens and permanent residents. The 2010–20 rankings are based on unrounded institutional-yield ratios. Includes only baccalaureate-awarding institutions in the United States with 25 or more Black graduates later awarded research doctorates and reported bachelor's graduation counts to IPEDS from 2001–11. R1: doctoral universities are those with very high research activity. R2: doctoral universities are institutions with high research activity.
Source(s):
National Center for Science and Engineering Statistics, Survey of Earned Doctorates; National Center for Education Statistics, Integrated Postsecondary Education Data System, Completions Survey.
A similar change is seen when examining the IYR rankings of baccalaureate-origins for Hispanic doctorate recipients (table 9). Private institutions and baccalaureate colleges again become much more prominent, while the rankings of public and HHE institutions decline. Ranked by IYR, the top 31 institutions (and 41 of the top 50) were private colleges and universities. Although the number of R1 doctoral universities among the top 50 declined slightly (from 37 in table 4 to 33 in table 9), baccalaureate colleges increased from 2 to 14. Only one HHE institution (New Mexico Institute of Mining and Technology) was ranked in the top 50 by IYR. The high IYR for the California Institute of Technology is notable and driven by the small size of their undergraduate population; from 2001–11 only 132 Hispanic students received a bachelor’s degree from the California Institute of Technology.
Top 50 U.S. baccalaureate-origin institutions of Hispanic or Latino doctorate recipients from 2010–20, by institutional-yield ratio, institutional control, 2018 Carnegie classification, and HHE status
HHE = high-Hispanic-enrollment institution.
a The institutional-yield ratio is defined as the number of 2010–20 Hispanic doctorate recipients who received bachelor's degrees from an institution divided by the number of bachelor's degrees awarded to Hispanics 9 years earlier (2001–2011) from that same institution. The ratio is expressed as the number of Hispanic doctorates per 100 bachelor's degrees awarded to Hispanic students. For example, 55 Hispanic doctorate recipients over the 2010–20 period reported earning bachelor's degrees from the California Institute of Technology (Cal Tech), and a total of 132 Hispanic students earned bachelor's degrees from Cal Tech between 2001 and 2011. Thus, Cal Tech's institutional-yield ratio for the 2010–20 period is 41.7 Hispanic doctorate recipients per 100 bachelor's degrees awarded to Hispanic students at Cal Tech 9 years earlier.
Note(s):
Includes only U.S. citizens and permanent residents. The 2010–20 rankings are based on unrounded institutional-yield ratios. Includes only baccalaureate-awarding institutions in the United States with 25 or more Hispanic graduates later awarded research doctorates and reported bachelor's graduation counts to IPEDS from 2001–11. R1: doctoral universities are those with very high research activity. R2: doctoral universities are institutions with high research activity.
Source(s):
National Center for Science and Engineering Statistics, Survey of Earned Doctorates; National Center for Education Statistics, Integrated Postsecondary Education Data System, Completions Survey.
IYR rankings for AIAN doctorate recipients are not presented as few baccalaureate origin institutions had more than 25 AIAN doctorate recipients from 2010–20, the minimum number previously used to derive the IYR statistic. Calculation of the yield ratio with lower minimum number of AIAN doctorate recipients did not identify any new institutions other than those already listed in table 6, and the differences in the IYRs were small.
Overall, the results in this InfoBrief show that rankings of baccalaureate-origin institutions are highly dependent on whether production is viewed in absolute terms (number of bachelor’s degree recipients who complete a research doctorate) or relative terms (percentage of an institution’s bachelor’s degree recipients that complete a research doctorate). They also illustrate the varied educational pathways Black, Hispanic, and AIAN students take on their way to obtaining a U.S. research doctorate and the key role minority-serving institutions and many other institutions play in developing a diverse S&E workforce.
Data Sources, Limitations, and Availability
The Survey of Earned Doctorates (SED) data are used to report the numbers of research doctorate recipients between 2010 and 2020, as well as their baccalaureate-origin institutions. Data from the Department of Education's Integrated Postsecondary Education Data System (IPEDS) Completions Survey provide the numbers of bachelor's degrees awarded between 2001 and 2011 and were downloaded from the IPEDS Data Center. As seen in table 31 in the Survey of Earned Doctorates report, the median time from receipt of bachelor's degree to doctorate for all doctorate recipients between 2010 and 2020 was approximately 9 years (9.3 in 2010 and 8.7 in 2020). Among broad fields in 2020, time to degree was the shortest in physical sciences and earth sciences (7.0 years) and in engineering (7.5 years), and the longest in education (15.0 years). Due to the collection methods of race and ethnicity data in the IPEDS Completions Survey, the analysis of these underrepresented minorities in this InfoBrief is limited to U.S. citizens and permanent residents.
The 2018 version of the Carnegie Basic Classification for the colleges and universities categorizes academic institutions on the basis of highest degree conferred, level of degree production, and research activity. Institutions that award at least 20 research or scholarship doctoral degrees per year are called doctorate universities and are distributed among three subgroups based on the level of research activity—R1 doctoral universities (very high research activity), R2 doctoral universities (high research activity), and doctoral/professional universities. In this InfoBrief, the latter two subgroups are combined into a single category, called "Other doctoral universities." Master's colleges and universities are institutions that award at least 50 master's degrees and fewer than 20 doctoral degrees per year. Baccalaureate colleges are non-tribal colleges that award fewer than 50 master's degrees or 20 doctoral degrees per year and at which baccalaureate or higher degrees represent at least 50% of all degrees. See https://carnegieclassifications.acenet.edu/classification_descriptions/basic.php for more information on Carnegie Basic Classification.
Notes
1National Center for Science and Engineering Statistics (NCSES). 2021. Field of degree: Minorities. In Women, Minorities, and Persons with Disabilities in Science and Engineering. Special Report NSF 21-321. Available at https://ncses.nsf.gov/pubs/nsf21321/report/field-of-degree-minorities.
2National Science Foundation INCLUDES—Inclusion across the Nation of Communities of Learners of Underrepresented Discoverers in Engineering and Science. Available at https://beta.nsf.gov/funding/opportunities/inclusion-across-nation-communities-learners-underrepresented-discoverers.
3Burrelli J, Rapoport A, Lehming R. 2008. Role of HBCUs as Baccalaureate-Origin Institutions of Black S&E Doctorate Recipients. InfoBrief NSF 08-319. Arlington, VA: Division of Science Resources Statistics, National Science Foundation. Available at www.nsf.gov/statistics/infbrief/nsf08319/. Fiegener MK, Proudfoot SL; National Center for Science and Engineering Statistics (NCSES). 2013. Baccalaureate Origins of U.S.-trained S&E Doctorate Recipients Available at https://www.nsf.gov/statistics/infbrief/nsf13323/.
4High-Hispanic-enrollment (HHE) institutions are defined as those colleges and universities where at least 25% of the total undergraduate enrollment in 2020 Integrated Postsecondary Education Data System (IPEDS) Completions Survey were identified as Hispanic. High–American Indian or Alaska Native-enrollment (HAIANE) institutions are defined as non-tribal colleges and universities where at least 10% of the total undergraduate enrollment in IPEDS 2020 were identified as AIAN.
5National Center for Science and Engineering Statistics (NCSES). 2021. Enrollment. In Women, Minorities, and Persons with Disabilities in Science and Engineering. NSF 21-321. Alexandria, VA: National Science Foundation. Available at https://ncses.nsf.gov/pubs/nsf21321/report/enrollment#enrollment.
6National Center for Educational Statistics (NCES). 2020. Condition of Education: Postsecondary Education. NCES 2020144. Washington, DC: Department of Education. Available at https://nces.ed.gov/programs/coe/.
7Burrelli J, Rapoport A. 2008. Baccalaureate Origins of S&E Doctorate Recipients. InfoBrief NSF 08-311. Arlington, VA: Division of Science Resources Statistics, National Science Foundation. Available at https://www.nsf.gov/statistics/infbrief/nsf08311. While IYR was first published in this InfoBrief, this concept was based on the research of Fuller (1986) and Carrier and Davis-Van Atta (1987) which found that several small private, liberal arts colleges contribute greatly to production of research doctorates.
8Fuller CH. 1986. Ph.D. Recipients: Where Did They Go to College? Change 18:42–51. Available at https://www.jstor.org/stable/40164449. Carrier SC, Davis-Van Atta D. 1987. Maintaining America’s Scientific Productivity: The Necessity of the Liberal Arts Colleges. Oberlin, Ohio: Oberlin College.
Suggested Citation
Einaudi P, Gordon J, Kang K; National Center for Science and Engineering Statistics (NCSES). 2022. Baccalaureate Origins of Underrepresented Minority Doctorate Recipients. NSF 22-335. Alexandria, VA: National Science Foundation. Available at https://ncses.nsf.gov/pubs/nsf22335/.
Contact Us
NCSES
National Center for Science and Engineering Statistics
Directorate for Social, Behavioral and Economic Sciences
National Science Foundation
2415 Eisenhower Avenue, Suite W14200
Alexandria, VA 22314
Tel: (703) 292-8780
FIRS: (800) 877-8339
TDD: (800) 281-8749
E-mail: ncsesweb@nsf.gov
NSF 22-335
|August 9, 2022